| Param | Original file | Final file |
|---|---|---|
| Filename | modeM0/AS1C07_001T02_9000006452_50982cztM0_level2.fits | modeM0/AS1C07_001T02_9000006452_50982cztM0_level2_quad_clean.evt |
| Size (bytes) | 577,572,480 | 86,892,480 |
| Size | 550.8 MB | 82.9 MB |
| Events in quadrant A | 3,413,741 | 580,872 |
| Events in quadrant B | 3,941,383 | 619,941 |
| Events in quadrant C | 5,114,088 | 539,001 |
| Events in quadrant D | 8,413,419 | 443,280 |
| Mode SS | |||
|---|---|---|---|
| Quadrant | BADHDUFLAG | Total packets | Discarded packets |
| A | 0 | 130 | 0 |
| B | 0 | 130 | 0 |
| C | 0 | 130 | 0 |
| D | 0 | 130 | 0 |
| Mode M9 | |||
|---|---|---|---|
| Quadrant | BADHDUFLAG | Total packets | Discarded packets |
| A | 0 | 9 | 0 |
| B | 0 | 9 | 0 |
| C | 0 | 9 | 0 |
| D | 0 | 9 | 0 |
| Mode M0 | |||
|---|---|---|---|
| Quadrant | BADHDUFLAG | Total packets | Discarded packets |
| A | 0 | 14506 | 1 |
| B | 0 | 16431 | 1 |
| C | 0 | 19740 | 1 |
| D | 0 | 29515 | 1 |
| Quadrant | Total seconds | Saturated seconds | Saturation percentage |
|---|---|---|---|
| A | 6415 | 57 | 0.888542% |
| B | 6415 | 190 | 2.961808% |
| C | 6416 | 510 | 7.948878% |
| D | 6416 | 1283 | 19.996883% |
Noise dominated data is calculated using 1-second bins in cleaned event files. If a bin has >2000 counts, and if more than 50% of those come from <1% of pixels, then it is considered to be noise-dominated and hence unusable.
| Quadrant | # 1 sec bins | Bins with >0 counts | Bins with >2000 counts | High rate bins dominated by noise | Noise dominated (total time) | Noise dominated (detector-on time) | Marked lightcurve |
|---|---|---|---|---|---|---|---|
| A | 7275 | 6416 | 35 | 35 | 0.48% | 0.55% | 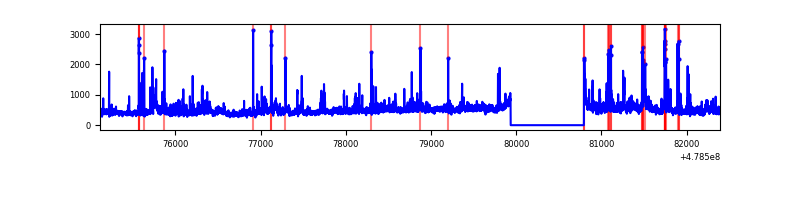 |
| B | 7275 | 6415 | 107 | 107 | 1.47% | 1.67% | 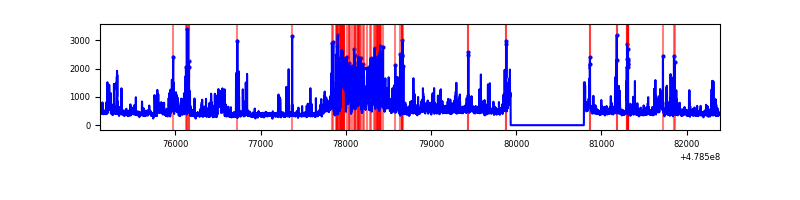 |
| C | 7276 | 6416 | 467 | 467 | 6.42% | 7.28% | 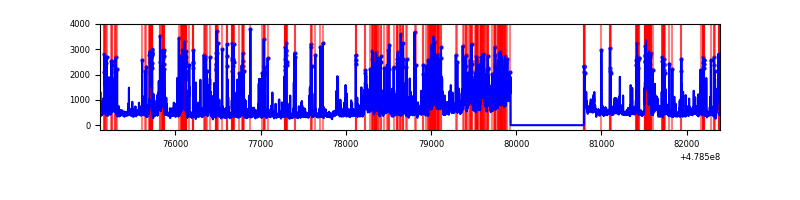 |
| D | 7276 | 6417 | 1399 | 1399 | 19.23% | 21.80% | 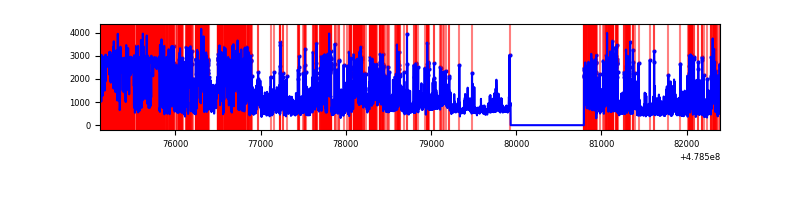 |
Top three noisy pixels from each quadrant. If the there are fewer than three noisy pixels in the level2.evt file, extra rows are filled as -1
| Pixel properties | Quadrant properties | ||||||
|---|---|---|---|---|---|---|---|
| Quadrant | DetID | PixID | Counts | Sigma | Mean | Median | Sigma |
| A | 4 | 3 | 218544 | 1354.83 | 647 | 633 | 160.8 |
| A | 12 | 3 | 205847 | 1275.89 | 647 | 633 | 160.8 |
| A | 8 | 43 | 67750 | 417.29 | 647 | 633 | 160.8 |
| B | 4 | 81 | 727576 | 5233.07 | 643 | 622 | 138.9 |
| B | 12 | 32 | 151601 | 1086.84 | 643 | 622 | 138.9 |
| B | 7 | 252 | 98366 | 703.62 | 643 | 622 | 138.9 |
| C | 1 | 44 | 654107 | 3887.35 | 612 | 606 | 168.1 |
| C | 3 | 233 | 392546 | 2331.45 | 612 | 606 | 168.1 |
| C | 13 | 3 | 391330 | 2324.22 | 612 | 606 | 168.1 |
| D | 8 | 176 | 4255765 | 25951.64 | 574 | 553 | 164.0 |
| D | 7 | 39 | 502967 | 3064.12 | 574 | 553 | 164.0 |
| D | 7 | 96 | 181102 | 1101.13 | 574 | 553 | 164.0 |
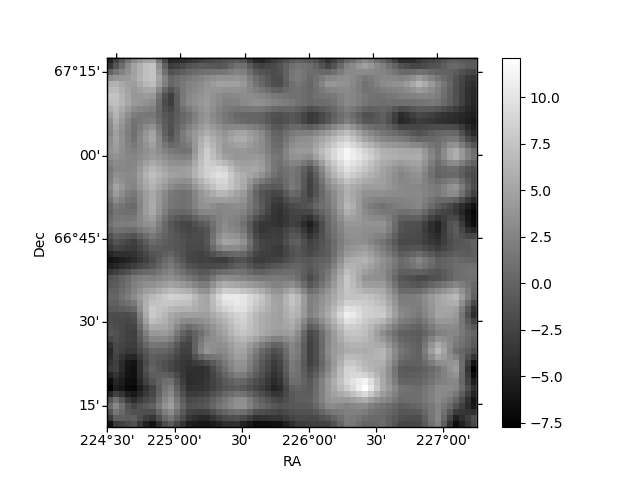
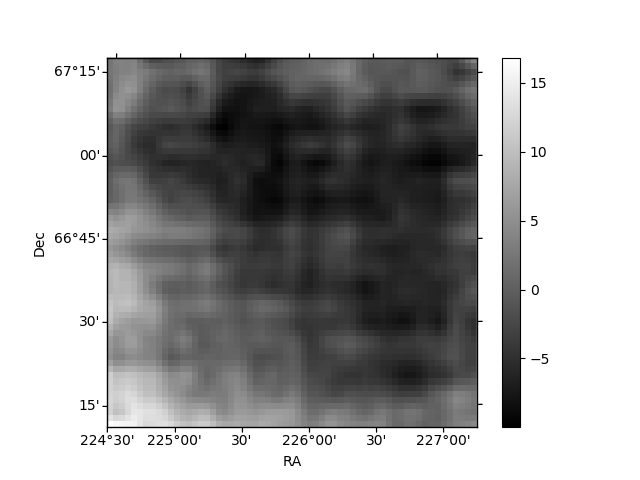
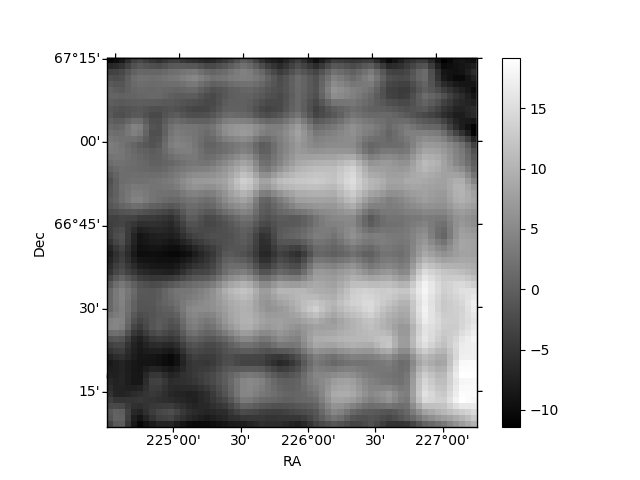
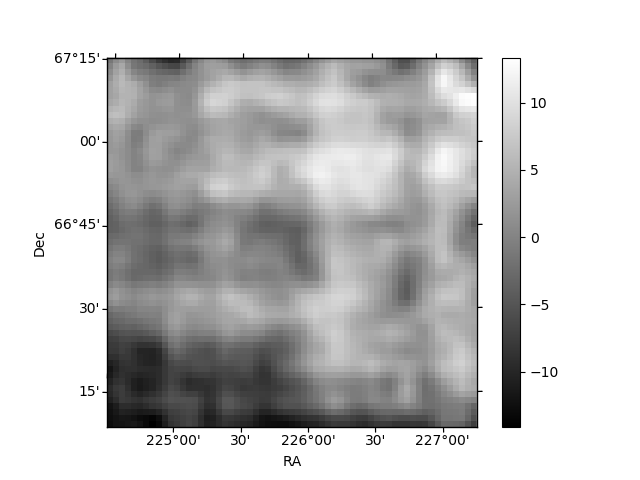
Histogram calculated using DETX and DETY for each event in the final _common_clean file
| Quadrant A | 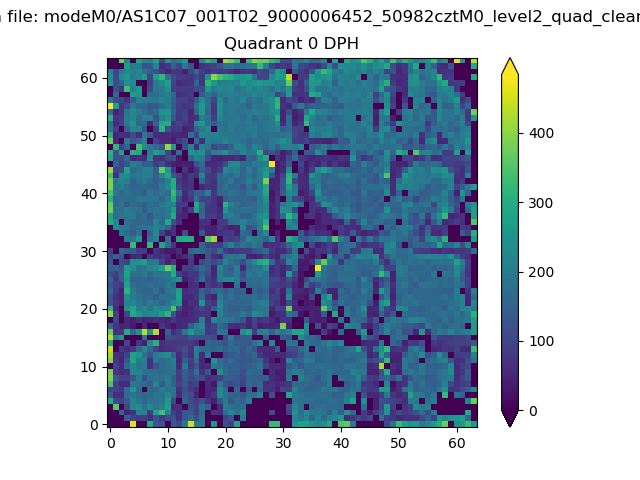 |
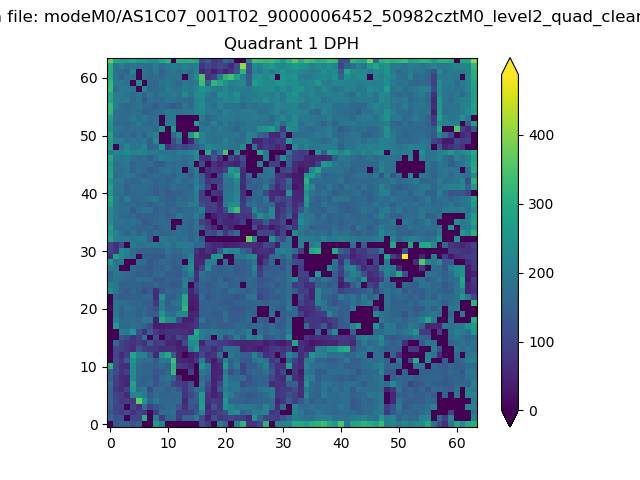 |
Quadrant B |
|---|---|---|---|
| Quadrant D | 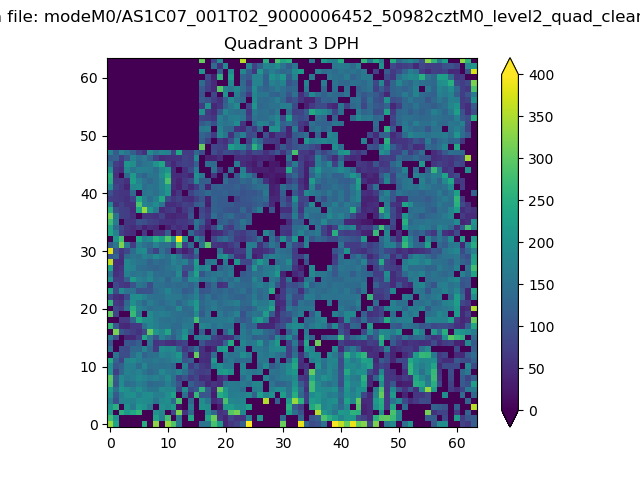 |
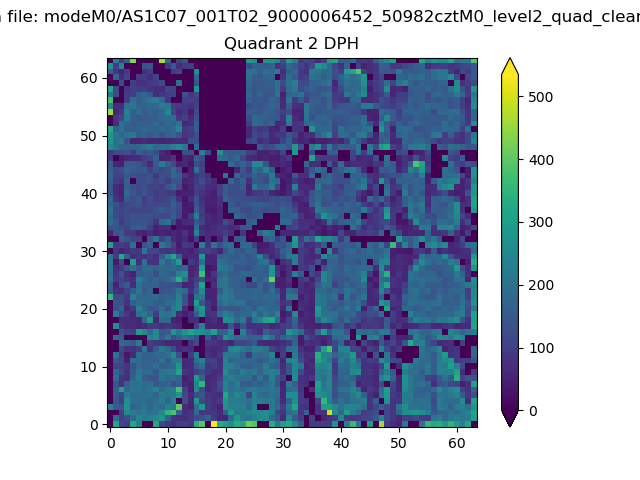 |
Quadrant C |
| Plot type | Count rate plots | Images |
|---|---|---|
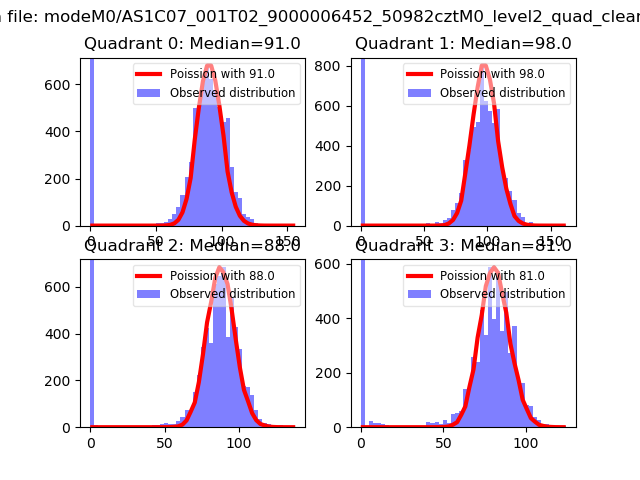
| Comparison with Poisson distribution Blue bars denote a histogram of data divided into 1 sec bins. Red curve is a Poisson curve with rate = median count rate of data. |
 |
 |
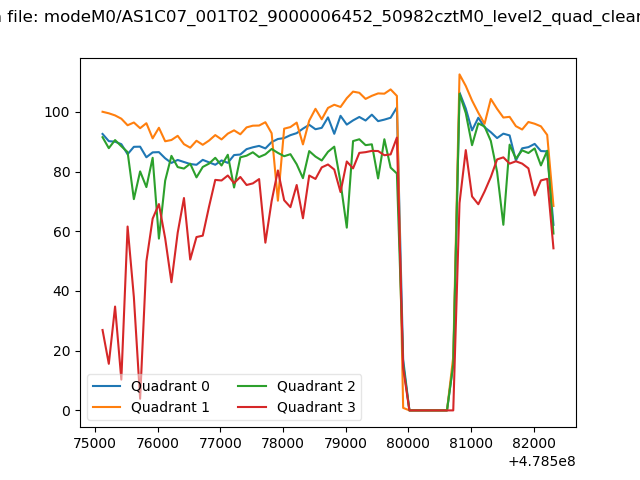
| Quadrant-wise count rates Data is divided into 100 sec bins |
 |
|
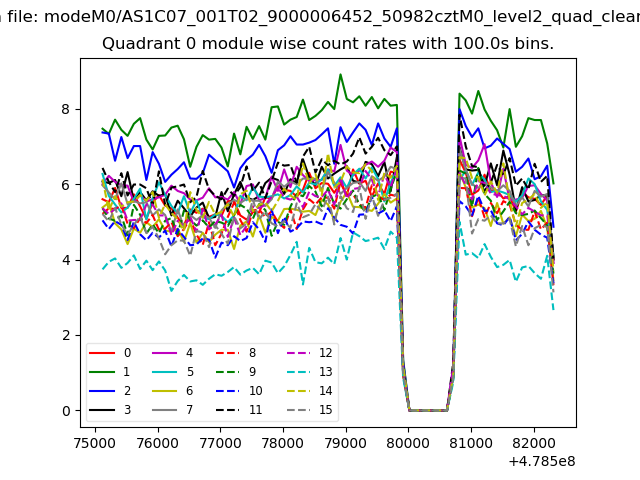
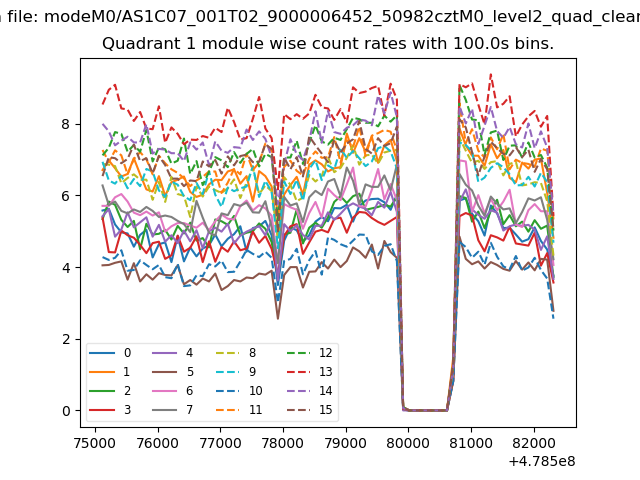
| Module-wise count rates for Quadrant A Data is divided into 100 sec bins |
 |
 |
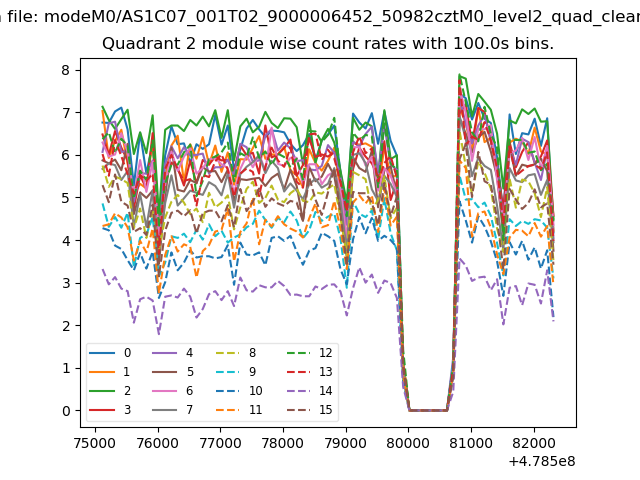
| Module-wise count rates for Quadrant B Data is divided into 100 sec bins |
 |
 |
| Module-wise count rates for Quadrant C Data is divided into 100 sec bins |
 |
 |
| Module-wise count rates for Quadrant D Data is divided into 100 sec bins |
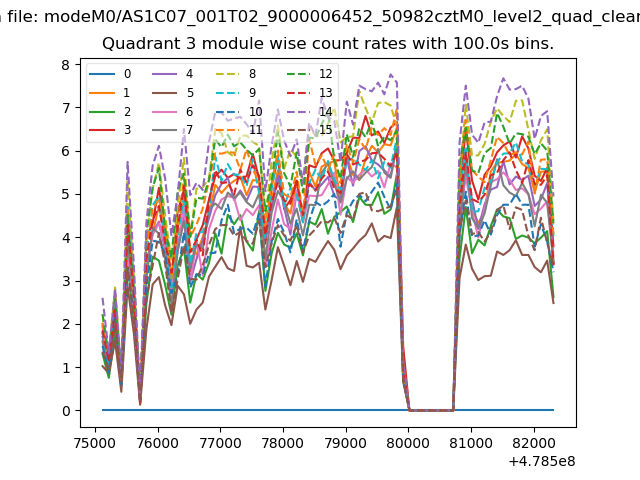 |
 |
| Parameter | Plot |
|---|---|
| CZT HV Monitor | 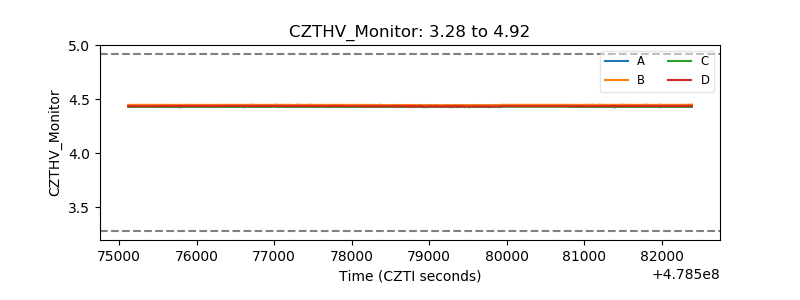 |
| D_VDD | 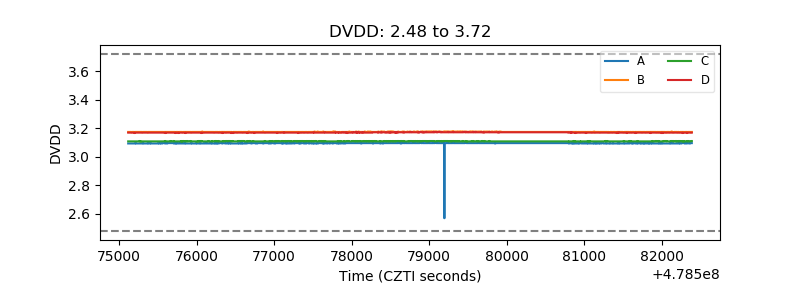 |
| Temperature 1 | 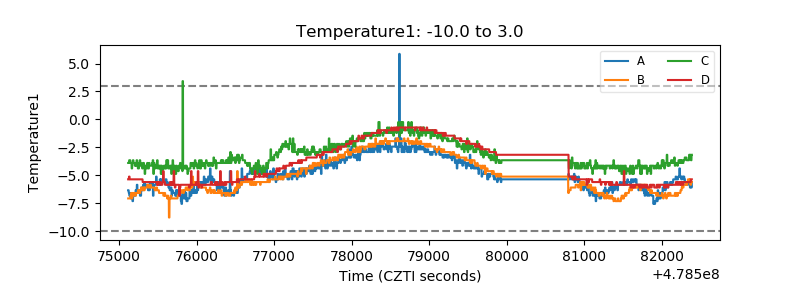 |
| Veto HV Monitor | 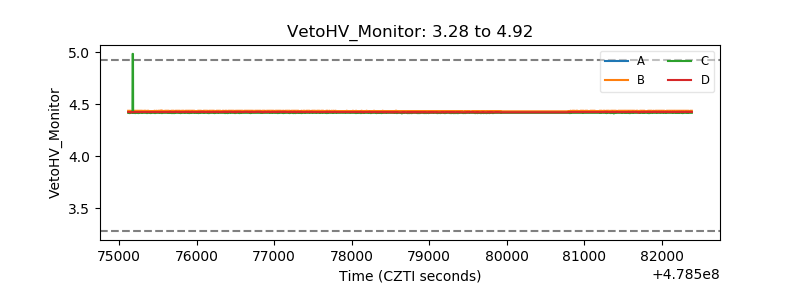 |
| Veto LLD | 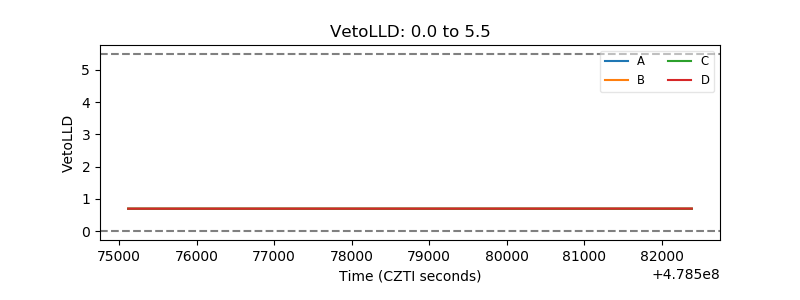 |
| Alpha Counter | 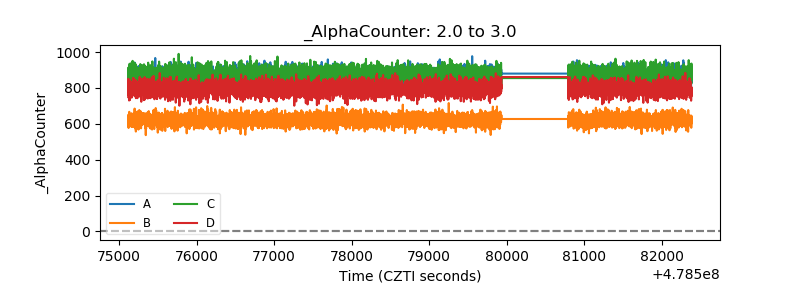 |
| _CPM_Rate | 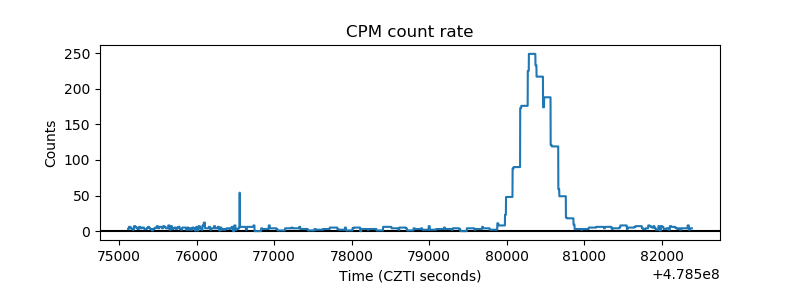 |
| CZT Counter | 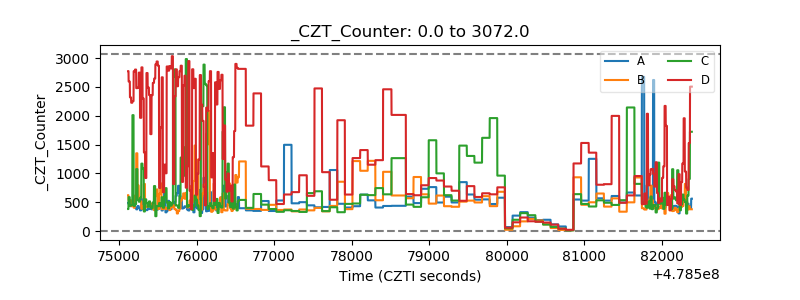 |
| +2.5 Volts monitor |  |
| +5 Volts monitor | 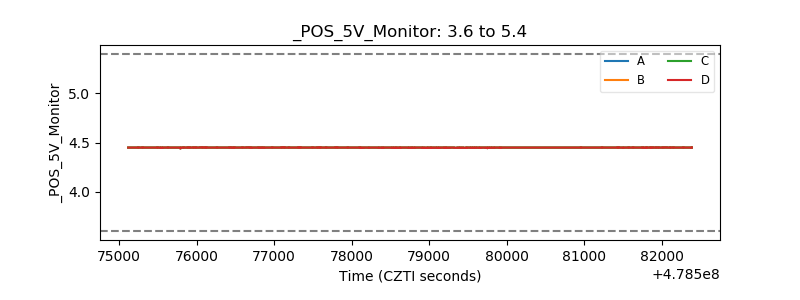 |
| _ROLL_ROT | 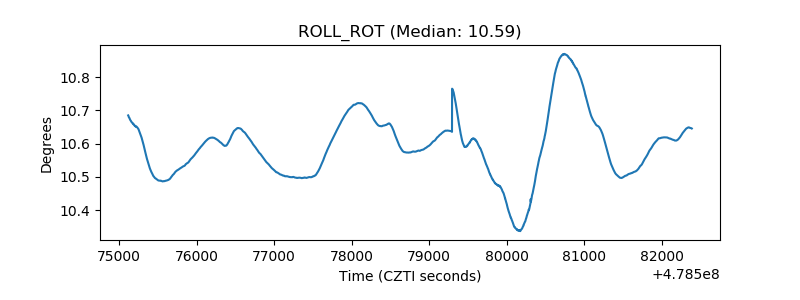 |
| _Roll_DEC | 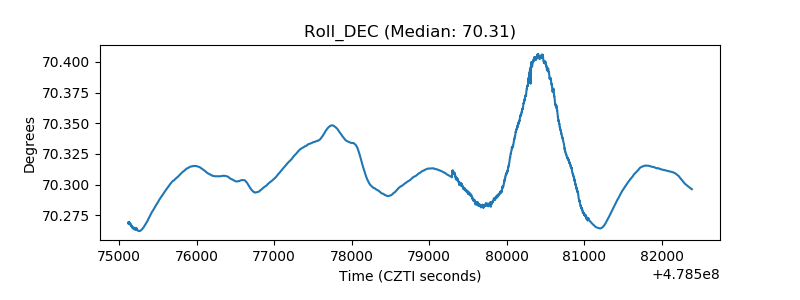 |
| _Roll_RA | 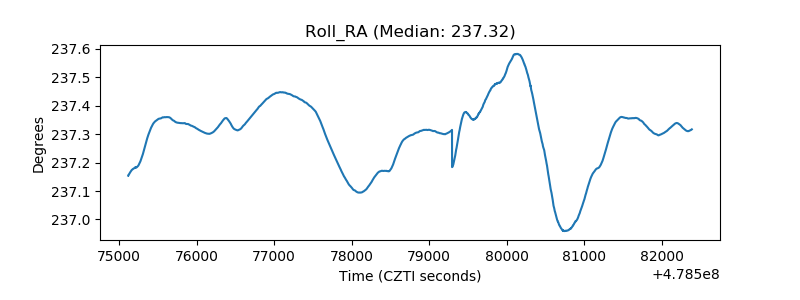 |
| Veto Counter | 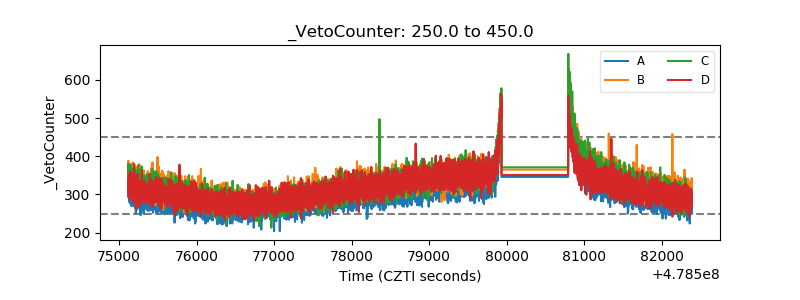 |