| Param | Original file | Final file |
|---|---|---|
| Filename | modeM0/AS1C07_001T02_9000006452_50984cztM0_level2.fits | modeM0/AS1C07_001T02_9000006452_50984cztM0_level2_quad_clean.evt |
| Size (bytes) | 553,222,080 | 89,245,440 |
| Size | 527.6 MB | 85.1 MB |
| Events in quadrant A | 3,863,254 | 592,556 |
| Events in quadrant B | 3,825,317 | 640,869 |
| Events in quadrant C | 4,534,415 | 560,199 |
| Events in quadrant D | 7,756,511 | 459,802 |
| Mode SS | |||
|---|---|---|---|
| Quadrant | BADHDUFLAG | Total packets | Discarded packets |
| A | 0 | 130 | 0 |
| B | 0 | 130 | 0 |
| C | 0 | 130 | 0 |
| D | 0 | 130 | 0 |
| Mode M9 | |||
|---|---|---|---|
| Quadrant | BADHDUFLAG | Total packets | Discarded packets |
| A | 0 | 10 | 0 |
| B | 0 | 10 | 0 |
| C | 0 | 10 | 0 |
| D | 0 | 10 | 0 |
| Mode M0 | |||
|---|---|---|---|
| Quadrant | BADHDUFLAG | Total packets | Discarded packets |
| A | 0 | 15766 | 1 |
| B | 0 | 16159 | 1 |
| C | 0 | 17898 | 1 |
| D | 0 | 27474 | 1 |
| Quadrant | Total seconds | Saturated seconds | Saturation percentage |
|---|---|---|---|
| A | 6432 | 87 | 1.352612% |
| B | 6433 | 143 | 2.222913% |
| C | 6433 | 330 | 5.129799% |
| D | 6433 | 1137 | 17.674491% |
Noise dominated data is calculated using 1-second bins in cleaned event files. If a bin has >2000 counts, and if more than 50% of those come from <1% of pixels, then it is considered to be noise-dominated and hence unusable.
| Quadrant | # 1 sec bins | Bins with >0 counts | Bins with >2000 counts | High rate bins dominated by noise | Noise dominated (total time) | Noise dominated (detector-on time) | Marked lightcurve |
|---|---|---|---|---|---|---|---|
| A | 7447 | 6433 | 72 | 72 | 0.97% | 1.12% | 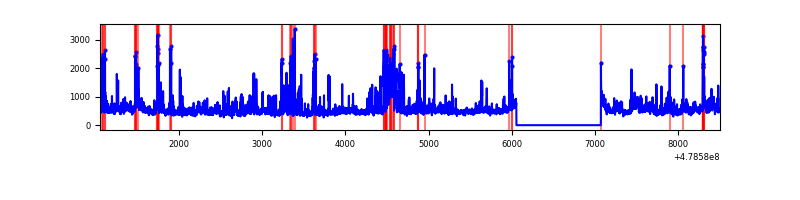 |
| B | 7448 | 6434 | 85 | 85 | 1.14% | 1.32% | 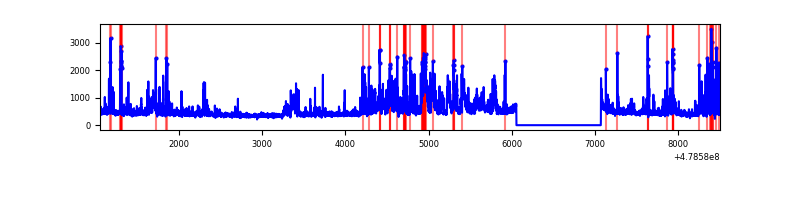 |
| C | 7448 | 6434 | 298 | 298 | 4.00% | 4.63% | 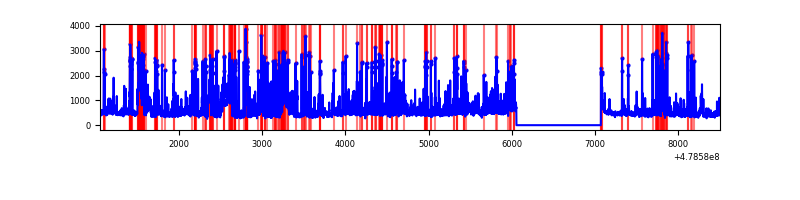 |
| D | 7448 | 6434 | 1239 | 1239 | 16.64% | 19.26% | 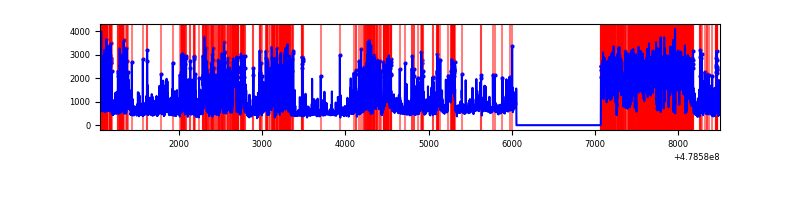 |
Top three noisy pixels from each quadrant. If the there are fewer than three noisy pixels in the level2.evt file, extra rows are filled as -1
| Pixel properties | Quadrant properties | ||||||
|---|---|---|---|---|---|---|---|
| Quadrant | DetID | PixID | Counts | Sigma | Mean | Median | Sigma |
| A | 12 | 3 | 378939 | 2279.6 | 655 | 637 | 166.0 |
| A | 4 | 3 | 173538 | 1041.88 | 655 | 637 | 166.0 |
| A | 12 | 80 | 112010 | 671.12 | 655 | 637 | 166.0 |
| B | 4 | 81 | 627680 | 4531.64 | 651 | 630 | 138.4 |
| B | 2 | 176 | 124600 | 895.92 | 651 | 630 | 138.4 |
| B | 12 | 32 | 105645 | 758.94 | 651 | 630 | 138.4 |
| C | 1 | 44 | 728686 | 4209.0 | 623 | 617 | 173.0 |
| C | 15 | 147 | 304282 | 1755.5 | 623 | 617 | 173.0 |
| C | 13 | 3 | 247660 | 1428.17 | 623 | 617 | 173.0 |
| D | 8 | 176 | 3563413 | 21760.63 | 582 | 560 | 163.7 |
| D | 15 | 93 | 505387 | 3083.3 | 582 | 560 | 163.7 |
| D | 7 | 39 | 401371 | 2448.01 | 582 | 560 | 163.7 |
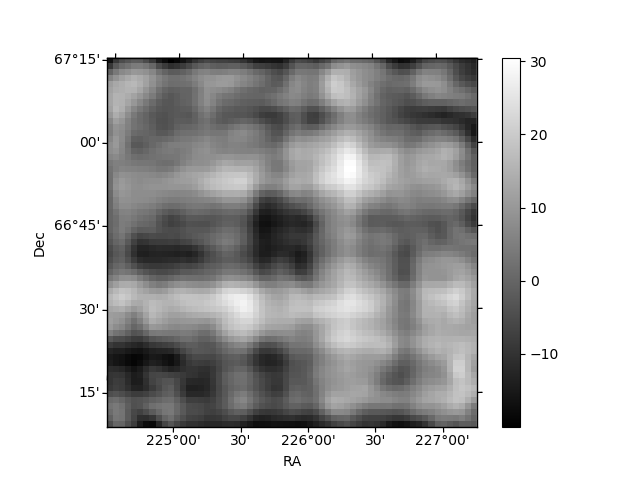
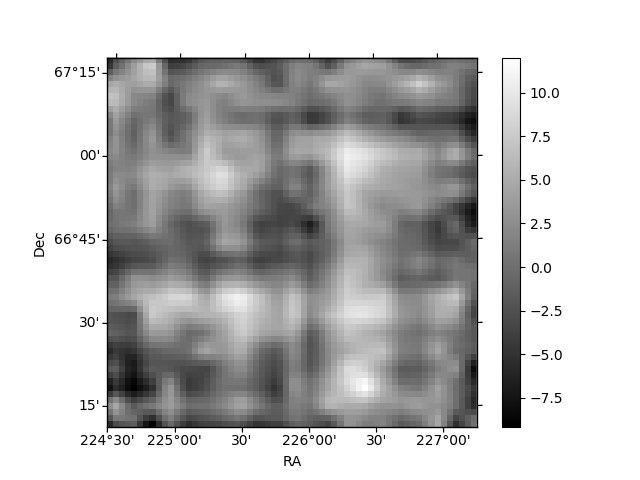
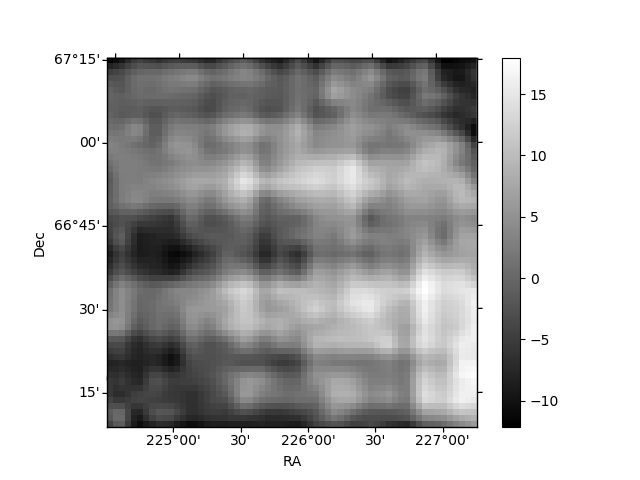
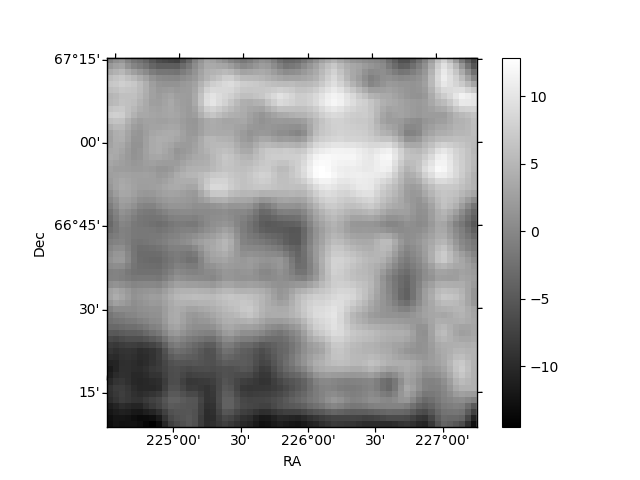
Histogram calculated using DETX and DETY for each event in the final _common_clean file
| Quadrant A | 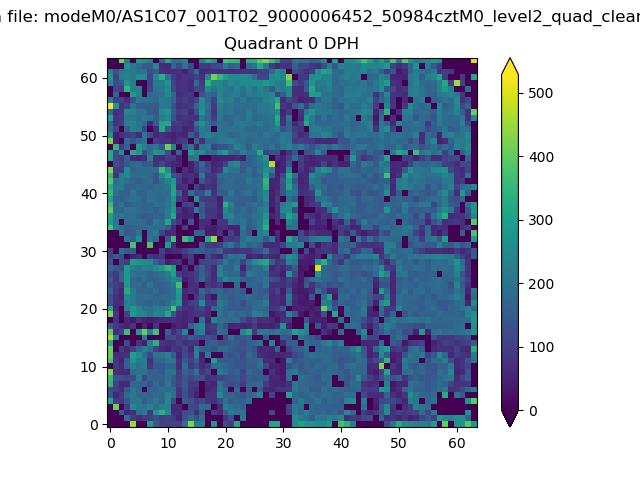 |
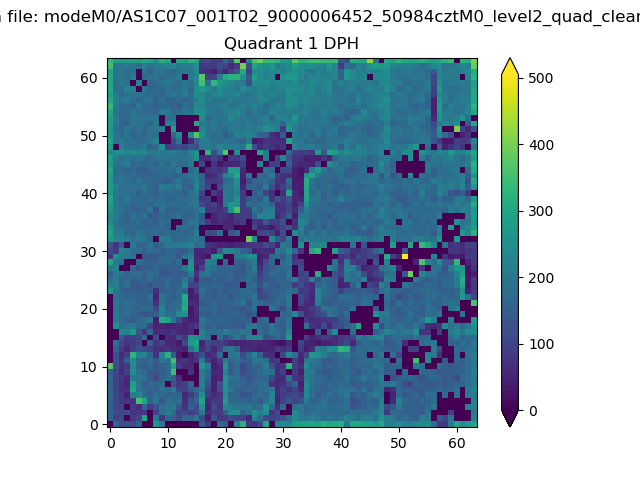 |
Quadrant B |
|---|---|---|---|
| Quadrant D | 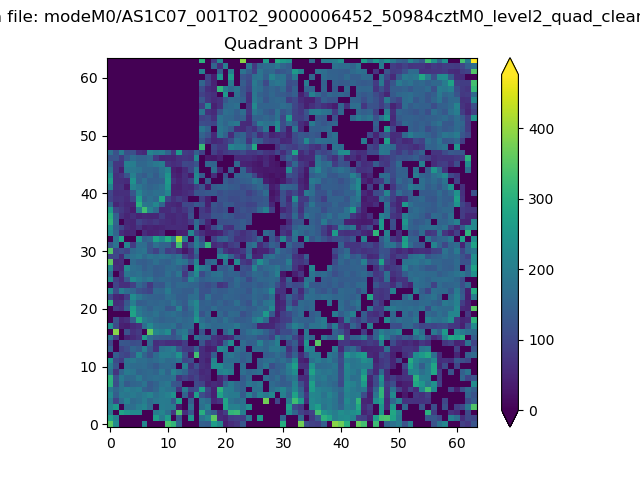 |
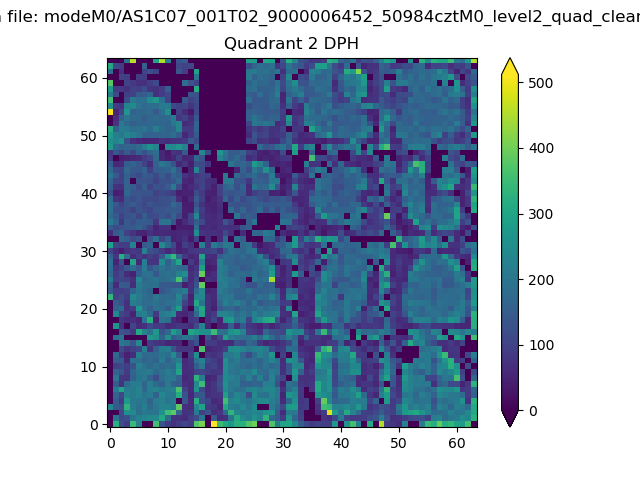 |
Quadrant C |
| Plot type | Count rate plots | Images |
|---|---|---|
| Comparison with Poisson distribution Blue bars denote a histogram of data divided into 1 sec bins. Red curve is a Poisson curve with rate = median count rate of data. |
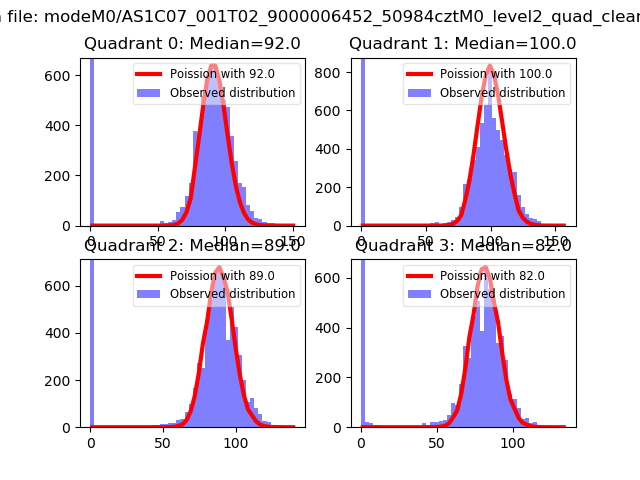 |
 |
| Quadrant-wise count rates Data is divided into 100 sec bins |
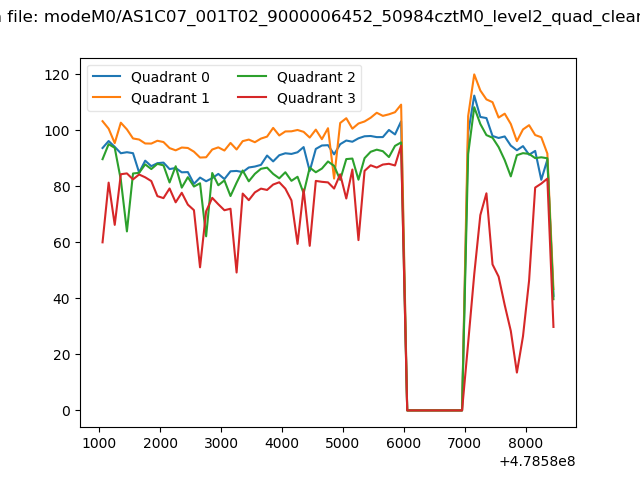 |
|
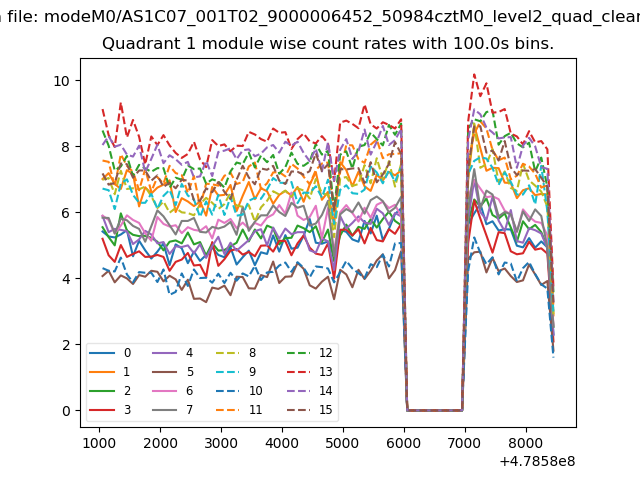
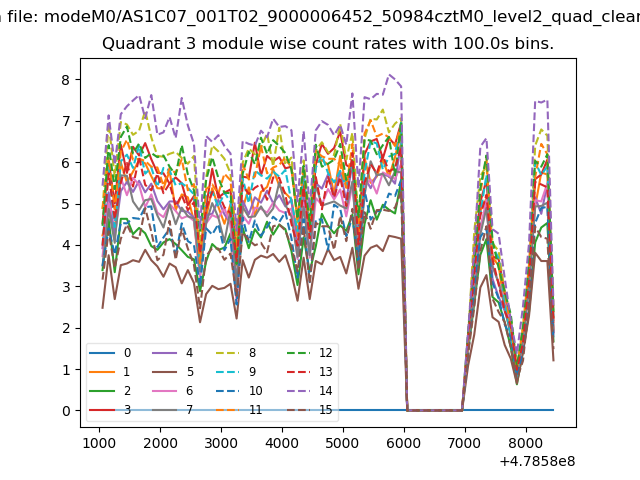
| Module-wise count rates for Quadrant A Data is divided into 100 sec bins |
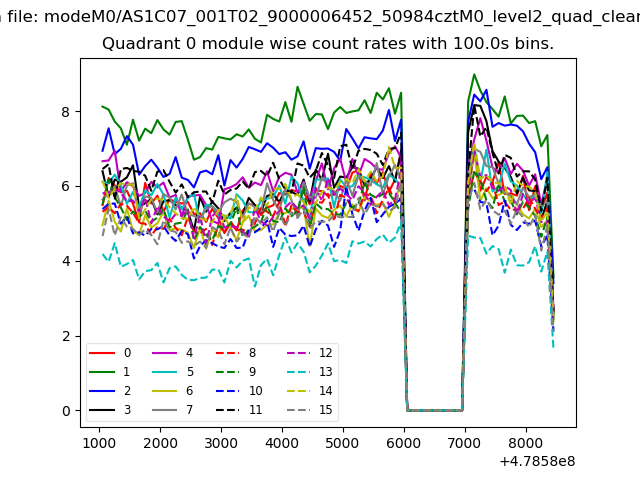 |
 |
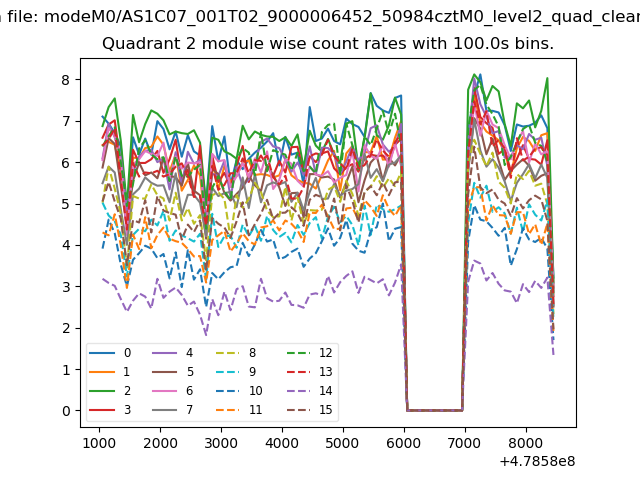
| Module-wise count rates for Quadrant B Data is divided into 100 sec bins |
 |
 |
| Module-wise count rates for Quadrant C Data is divided into 100 sec bins |
 |
 |
| Module-wise count rates for Quadrant D Data is divided into 100 sec bins |
 |
 |
| Parameter | Plot |
|---|---|
| CZT HV Monitor | 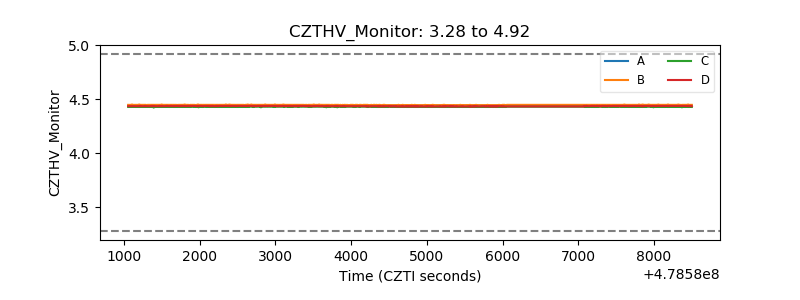 |
| D_VDD | 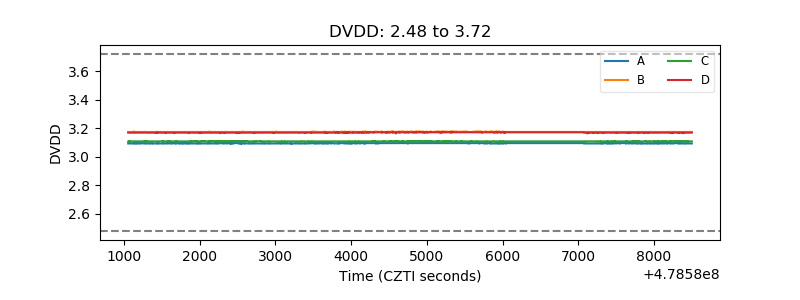 |
| Temperature 1 | 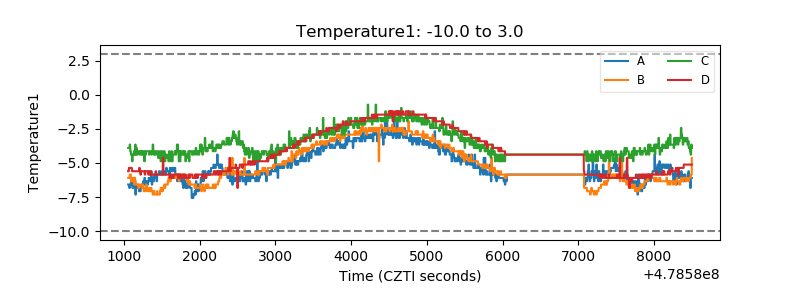 |
| Veto HV Monitor | 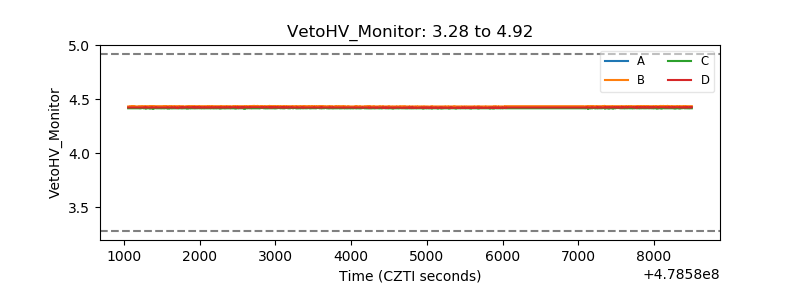 |
| Veto LLD | 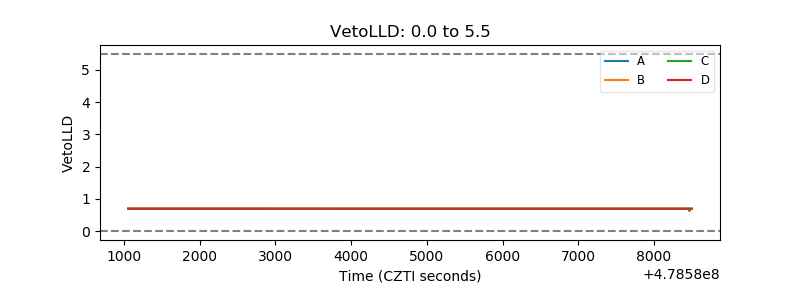 |
| Alpha Counter | 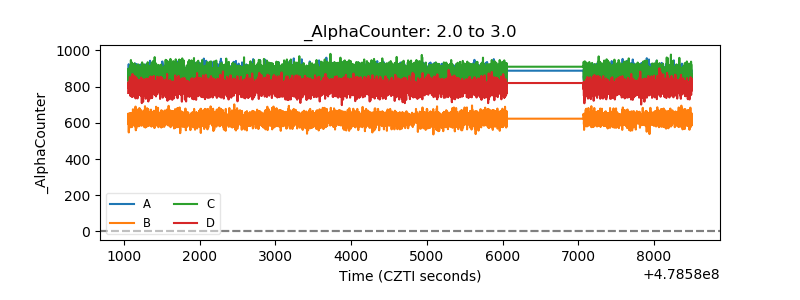 |
| _CPM_Rate | 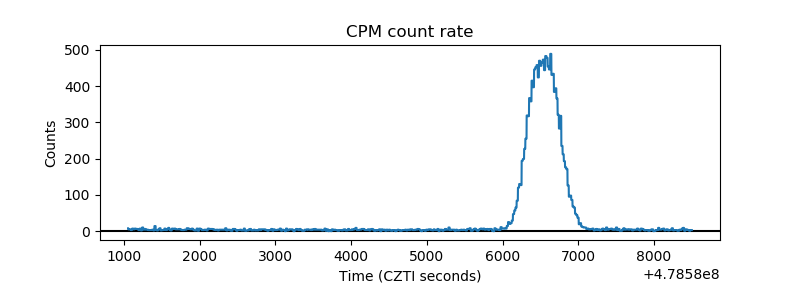 |
| CZT Counter | 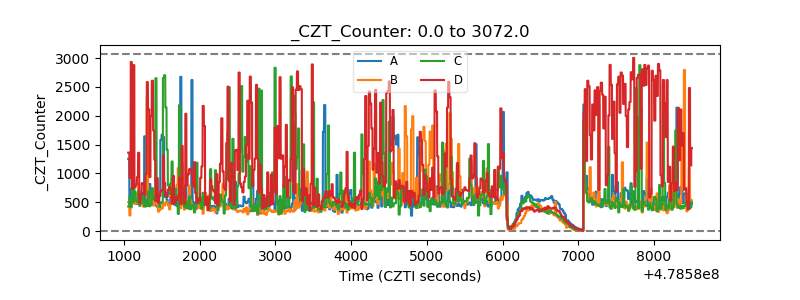 |
| +2.5 Volts monitor | 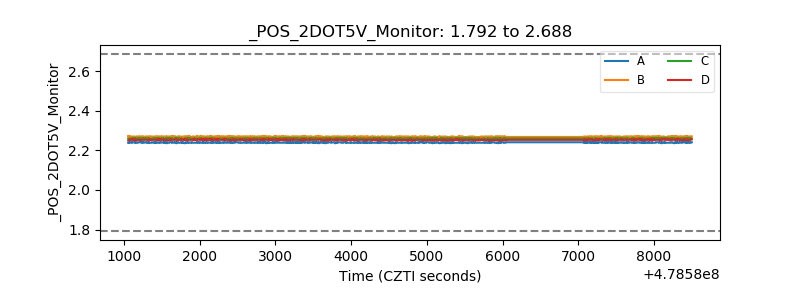 |
| +5 Volts monitor | 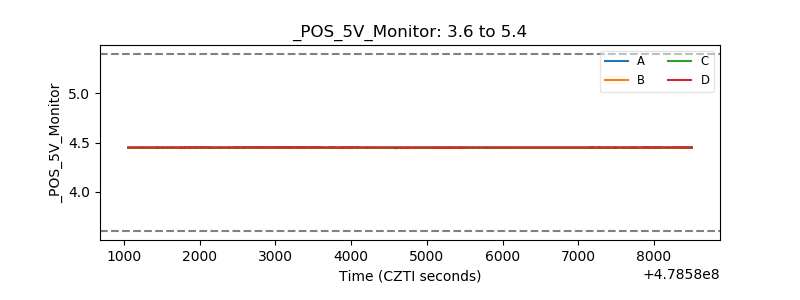 |
| _ROLL_ROT | 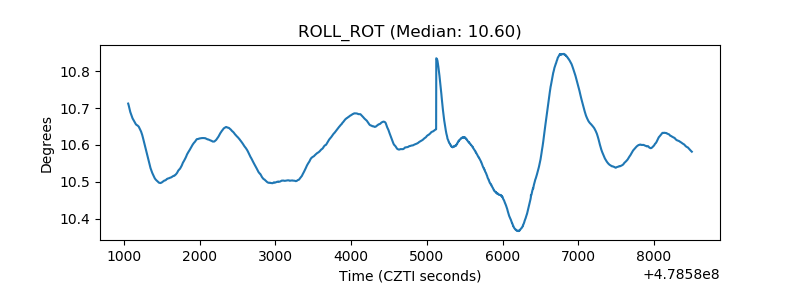 |
| _Roll_DEC | 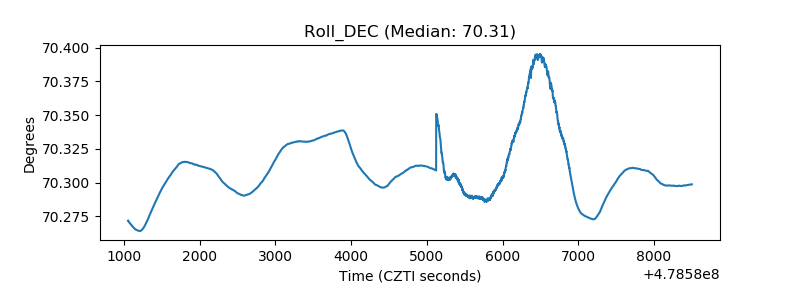 |
| _Roll_RA | 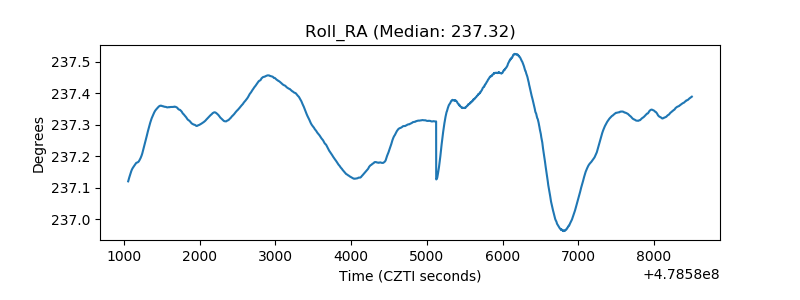 |
| Veto Counter | 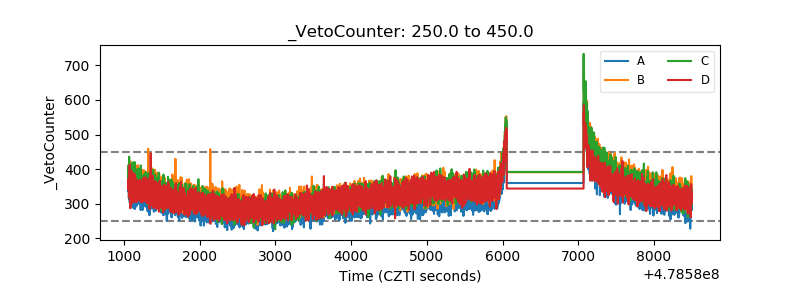 |