| Param | Original file | Final file |
|---|---|---|
| Filename | modeM0/AS1C07_001T02_9000006452_50985cztM0_level2.fits | modeM0/AS1C07_001T02_9000006452_50985cztM0_level2_quad_clean.evt |
| Size (bytes) | 517,440,960 | 74,534,400 |
| Size | 493.5 MB | 71.1 MB |
| Events in quadrant A | 3,957,071 | 496,436 |
| Events in quadrant B | 4,349,364 | 521,702 |
| Events in quadrant C | 3,546,719 | 479,781 |
| Events in quadrant D | 6,883,544 | 382,200 |
| Mode SS | |||
|---|---|---|---|
| Quadrant | BADHDUFLAG | Total packets | Discarded packets |
| A | 0 | 119 | 10 |
| B | 0 | 119 | 11 |
| C | 0 | 118 | 5 |
| D | 0 | 117 | 5 |
| Mode M9 | |||
|---|---|---|---|
| Quadrant | BADHDUFLAG | Total packets | Discarded packets |
| A | 0 | 11 | 0 |
| B | 0 | 12 | 1 |
| C | 0 | 11 | 0 |
| D | 0 | 12 | 1 |
| Mode M0 | |||
|---|---|---|---|
| Quadrant | BADHDUFLAG | Total packets | Discarded packets |
| A | 0 | 16324 | 1009 |
| B | 0 | 17825 | 1038 |
| C | 0 | 15408 | 1003 |
| D | 0 | 27441 | 3287 |
| Quadrant | Total seconds | Saturated seconds | Saturation percentage |
|---|---|---|---|
| A | 5388 | 242 | 4.491463% |
| B | 5378 | 449 | 8.348829% |
| C | 5410 | 244 | 4.510166% |
| D | 5325 | 1032 | 19.380282% |
Noise dominated data is calculated using 1-second bins in cleaned event files. If a bin has >2000 counts, and if more than 50% of those come from <1% of pixels, then it is considered to be noise-dominated and hence unusable.
| Quadrant | # 1 sec bins | Bins with >0 counts | Bins with >2000 counts | High rate bins dominated by noise | Noise dominated (total time) | Noise dominated (detector-on time) | Marked lightcurve |
|---|---|---|---|---|---|---|---|
| A | 6799 | 5489 | 170 | 170 | 2.50% | 3.10% | 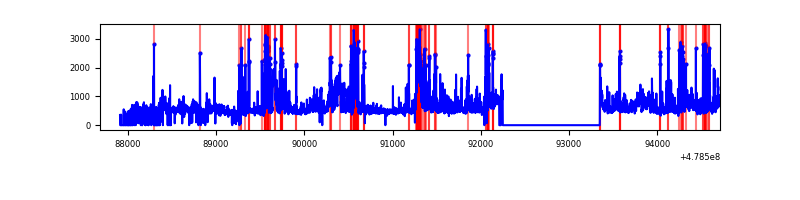 |
| B | 6729 | 5484 | 242 | 242 | 3.60% | 4.41% | 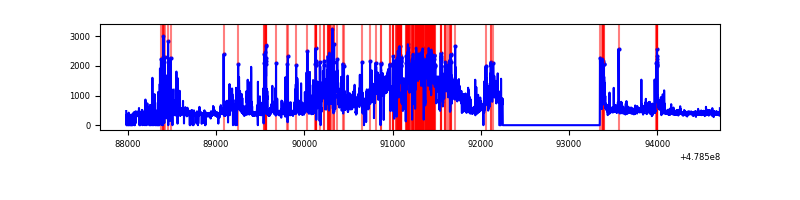 |
| C | 7026 | 5507 | 204 | 204 | 2.90% | 3.70% | 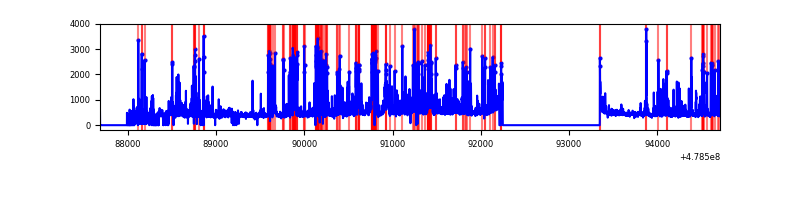 |
| D | 6642 | 5413 | 1117 | 1117 | 16.82% | 20.64% | 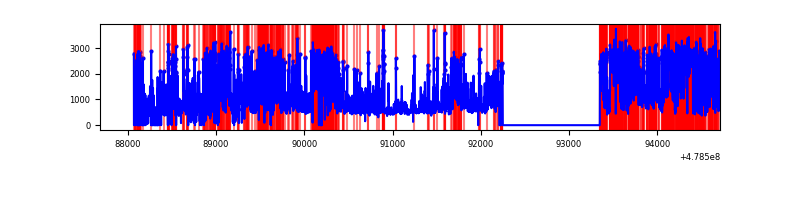 |
Top three noisy pixels from each quadrant. If the there are fewer than three noisy pixels in the level2.evt file, extra rows are filled as -1
| Pixel properties | Quadrant properties | ||||||
|---|---|---|---|---|---|---|---|
| Quadrant | DetID | PixID | Counts | Sigma | Mean | Median | Sigma |
| A | 12 | 3 | 455583 | 3247.89 | 554 | 541 | 140.1 |
| A | 8 | 43 | 454836 | 3242.56 | 554 | 541 | 140.1 |
| A | 12 | 80 | 209838 | 1493.87 | 554 | 541 | 140.1 |
| B | 4 | 81 | 1813662 | 15656.46 | 544 | 526 | 115.8 |
| B | 2 | 176 | 111515 | 958.39 | 544 | 526 | 115.8 |
| B | 4 | 206 | 35500 | 302.0 | 544 | 526 | 115.8 |
| C | 1 | 44 | 456340 | 3082.19 | 533 | 527 | 147.9 |
| C | 13 | 3 | 328871 | 2220.25 | 533 | 527 | 147.9 |
| C | 4 | 5 | 267995 | 1808.61 | 533 | 527 | 147.9 |
| D | 8 | 176 | 3447206 | 25057.9 | 489 | 470 | 137.6 |
| D | 15 | 93 | 414837 | 3012.46 | 489 | 470 | 137.6 |
| D | 10 | 181 | 390550 | 2835.9 | 489 | 470 | 137.6 |
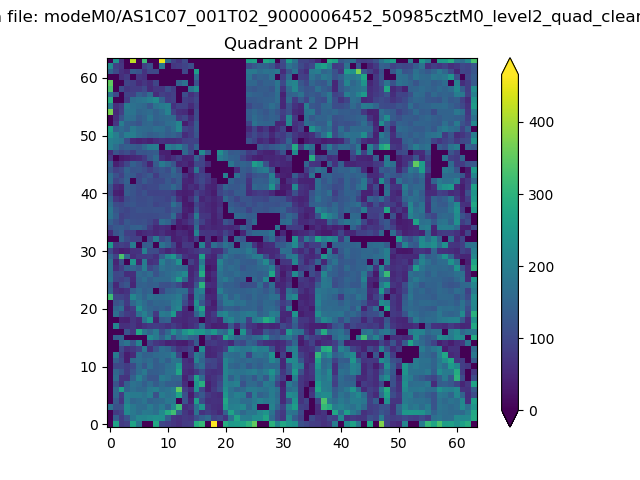
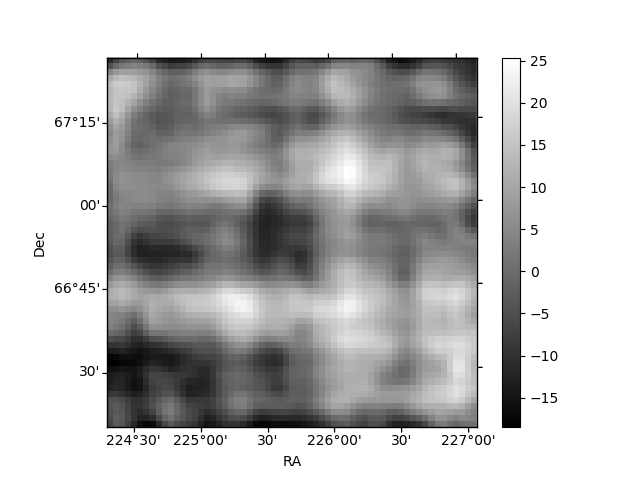
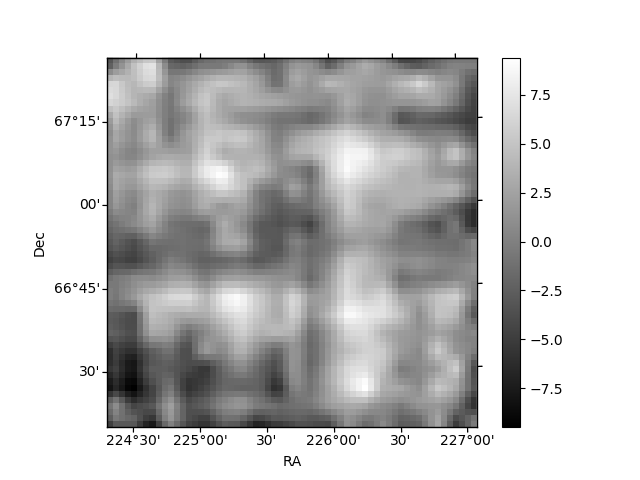
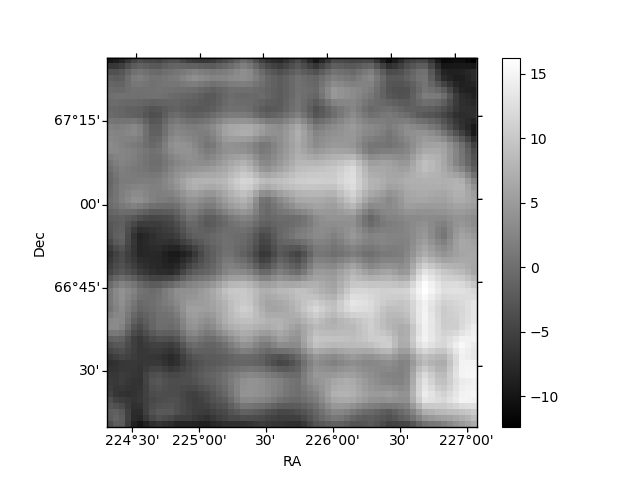
Histogram calculated using DETX and DETY for each event in the final _common_clean file
| Quadrant A | 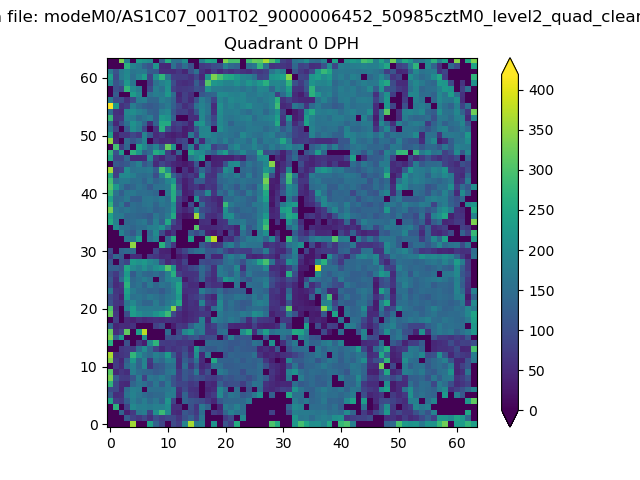 |
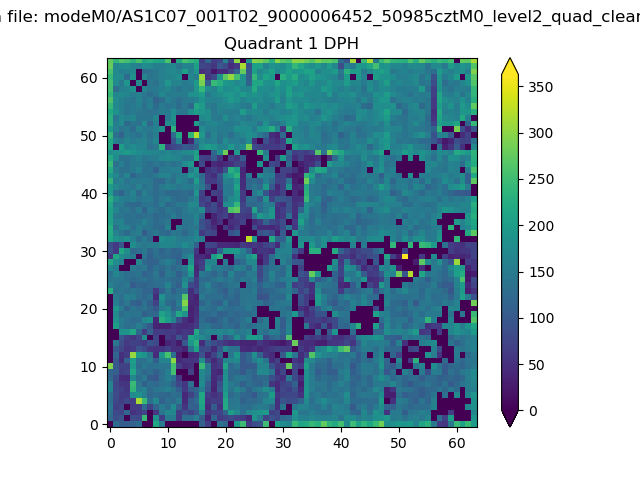 |
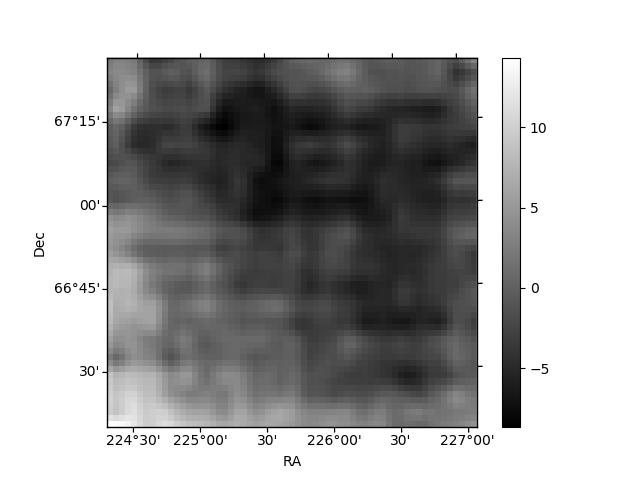
Quadrant B |
|---|---|---|---|
| Quadrant D | 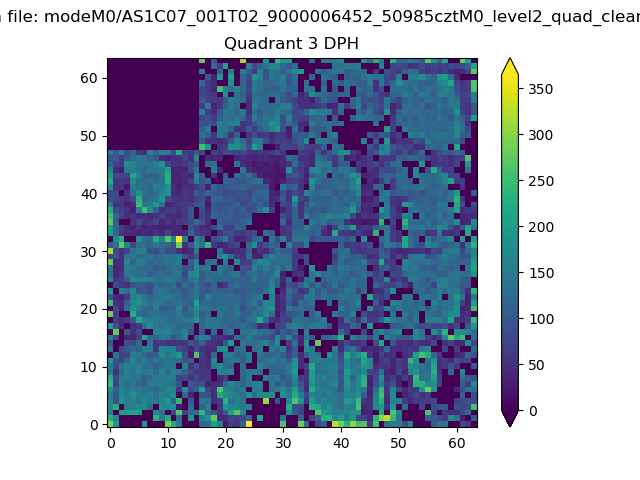 |
 |
Quadrant C |
| Plot type | Count rate plots | Images |
|---|---|---|
| Comparison with Poisson distribution Blue bars denote a histogram of data divided into 1 sec bins. Red curve is a Poisson curve with rate = median count rate of data. |
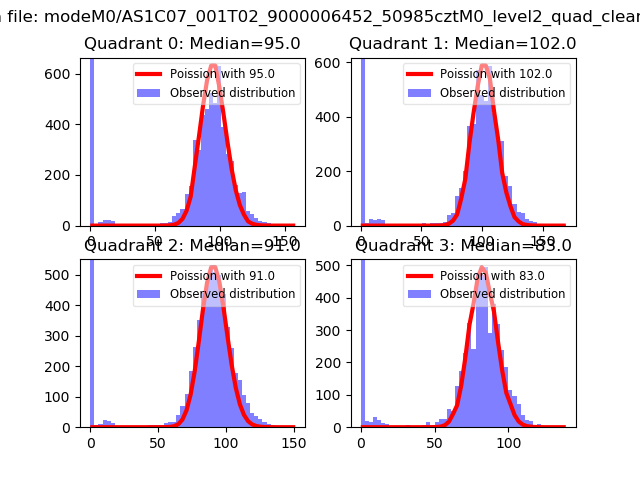 |
 |
| Quadrant-wise count rates Data is divided into 100 sec bins |
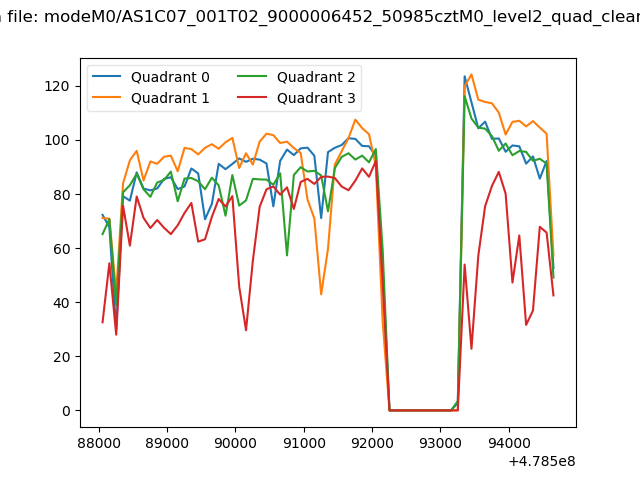 |
|
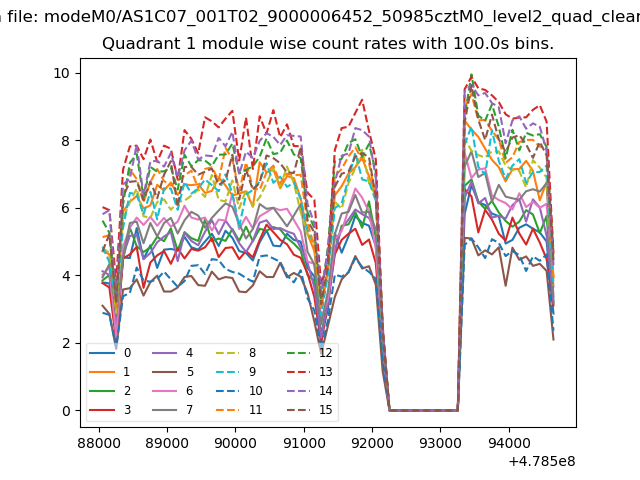
| Module-wise count rates for Quadrant A Data is divided into 100 sec bins |
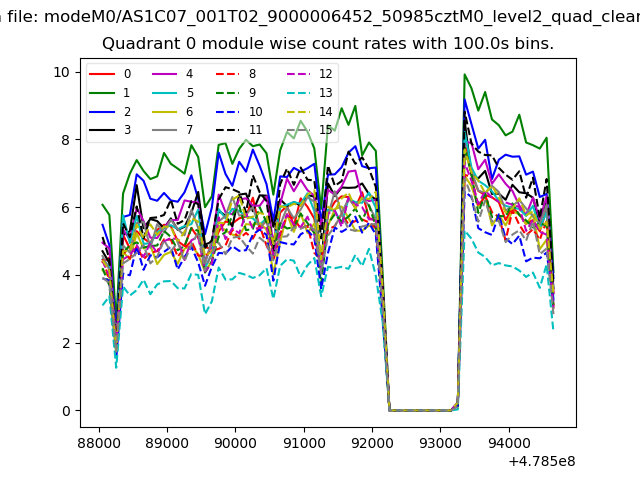 |
 |
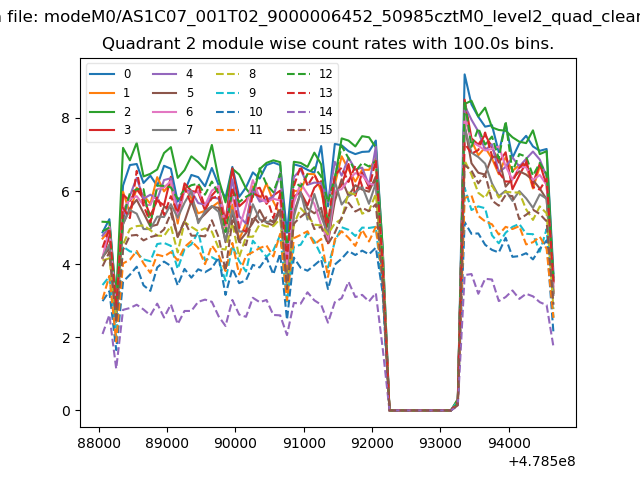
| Module-wise count rates for Quadrant B Data is divided into 100 sec bins |
 |
 |
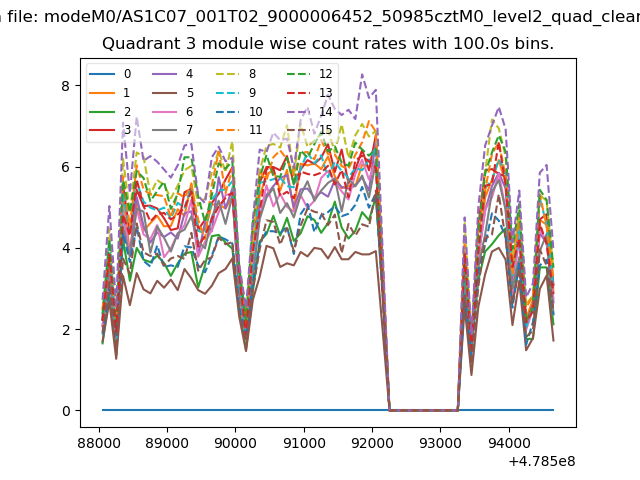
| Module-wise count rates for Quadrant C Data is divided into 100 sec bins |
 |
 |
| Module-wise count rates for Quadrant D Data is divided into 100 sec bins |
 |
 |
| Parameter | Plot |
|---|---|
| CZT HV Monitor | 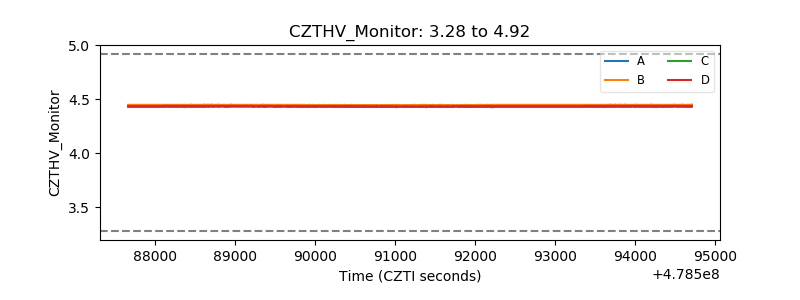 |
| D_VDD | 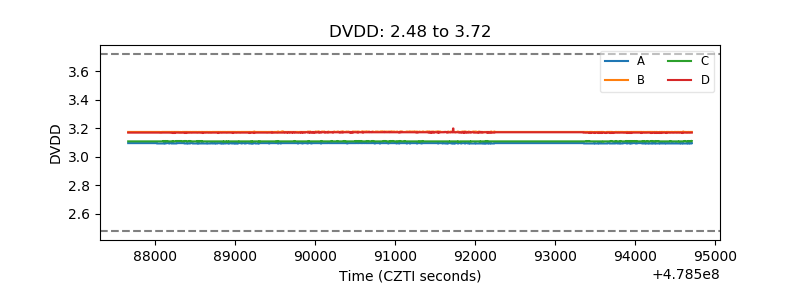 |
| Temperature 1 | 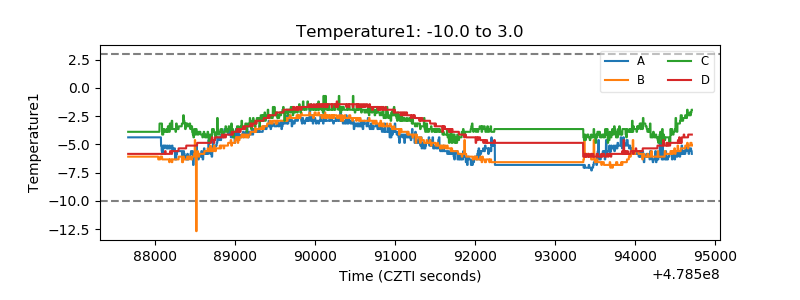 |
| Veto HV Monitor |  |
| Veto LLD | 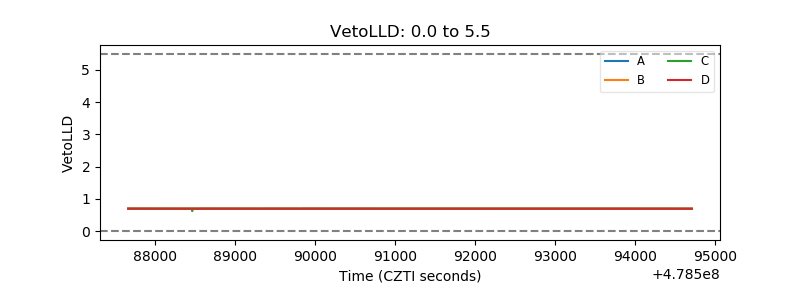 |
| Alpha Counter | 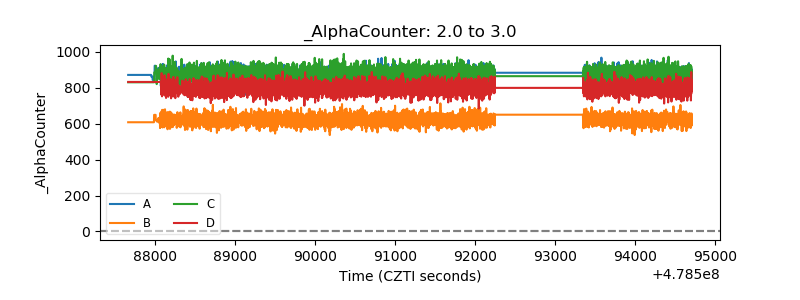 |
| _CPM_Rate | 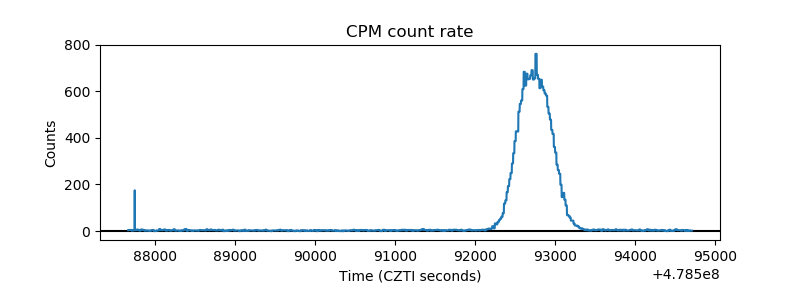 |
| CZT Counter | 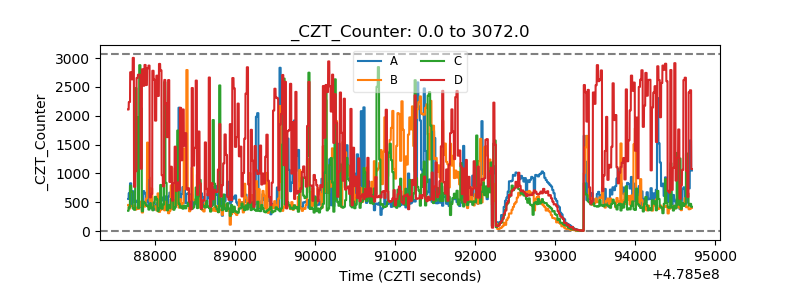 |
| +2.5 Volts monitor | 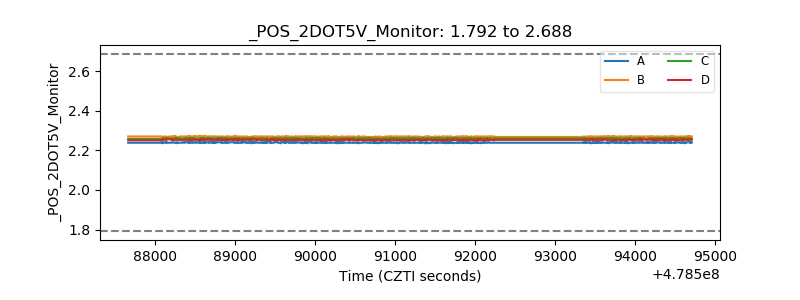 |
| +5 Volts monitor | 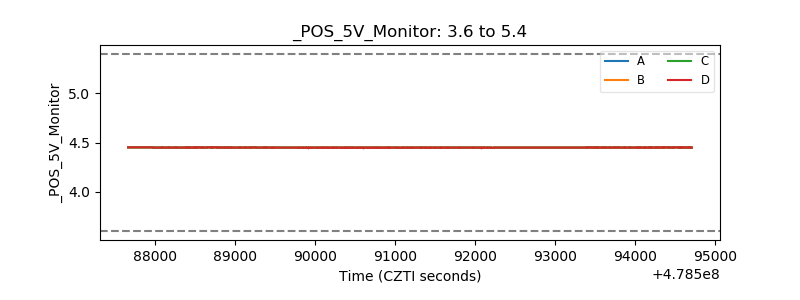 |
| _ROLL_ROT | 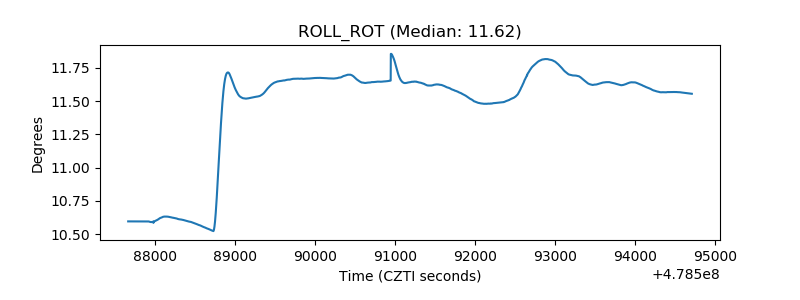 |
| _Roll_DEC | 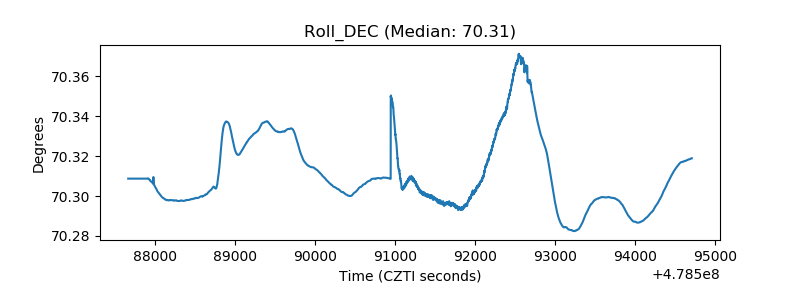 |
| _Roll_RA | 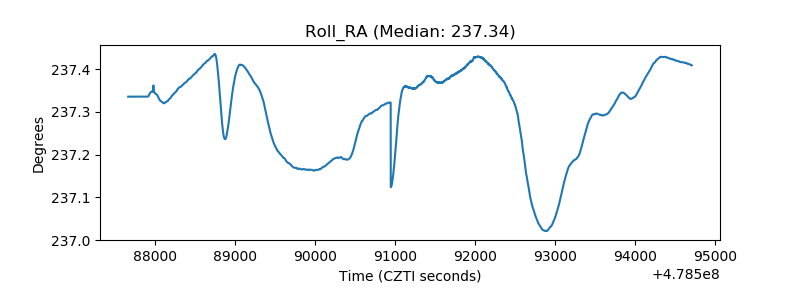 |
| Veto Counter | 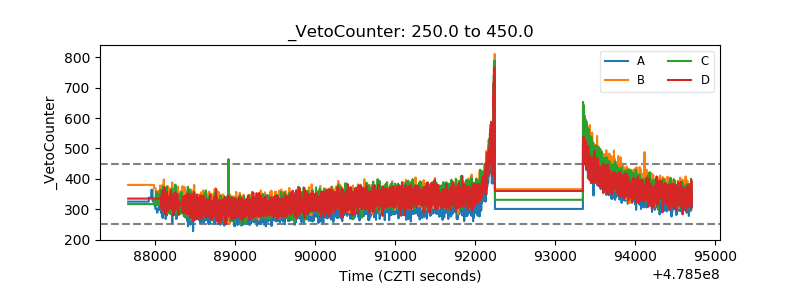 |