| Param | Original file | Final file |
|---|---|---|
| Filename | modeM0/AS1C07_001T02_9000006452_50986cztM0_level2.fits | modeM0/AS1C07_001T02_9000006452_50986cztM0_level2_quad_clean.evt |
| Size (bytes) | 571,078,080 | 84,839,040 |
| Size | 544.6 MB | 80.9 MB |
| Events in quadrant A | 4,591,339 | 568,654 |
| Events in quadrant B | 4,996,524 | 605,068 |
| Events in quadrant C | 3,720,661 | 547,721 |
| Events in quadrant D | 7,367,351 | 429,350 |
| Mode SS | |||
|---|---|---|---|
| Quadrant | BADHDUFLAG | Total packets | Discarded packets |
| A | 0 | 122 | 0 |
| B | 0 | 122 | 0 |
| C | 0 | 122 | 0 |
| D | 0 | 122 | 0 |
| Mode M9 | |||
|---|---|---|---|
| Quadrant | BADHDUFLAG | Total packets | Discarded packets |
| A | 0 | 11 | 0 |
| B | 0 | 11 | 0 |
| C | 0 | 11 | 0 |
| D | 0 | 11 | 0 |
| Mode M0 | |||
|---|---|---|---|
| Quadrant | BADHDUFLAG | Total packets | Discarded packets |
| A | 0 | 17763 | 1 |
| B | 0 | 19085 | 1 |
| C | 0 | 15273 | 1 |
| D | 0 | 26080 | 1 |
| Quadrant | Total seconds | Saturated seconds | Saturation percentage |
|---|---|---|---|
| A | 5985 | 259 | 4.327485% |
| B | 5984 | 462 | 7.720588% |
| C | 5984 | 235 | 3.927139% |
| D | 5985 | 1258 | 21.019215% |
Noise dominated data is calculated using 1-second bins in cleaned event files. If a bin has >2000 counts, and if more than 50% of those come from <1% of pixels, then it is considered to be noise-dominated and hence unusable.
| Quadrant | # 1 sec bins | Bins with >0 counts | Bins with >2000 counts | High rate bins dominated by noise | Noise dominated (total time) | Noise dominated (detector-on time) | Marked lightcurve |
|---|---|---|---|---|---|---|---|
| A | 7115 | 5985 | 156 | 156 | 2.19% | 2.61% | 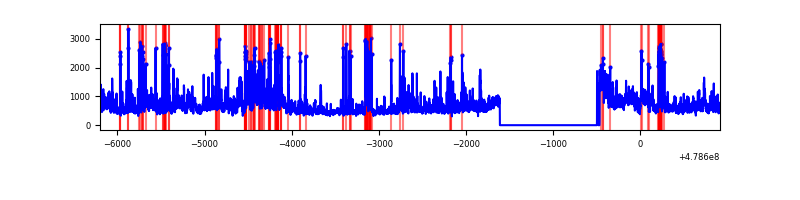 |
| B | 7114 | 5984 | 300 | 300 | 4.22% | 5.01% | 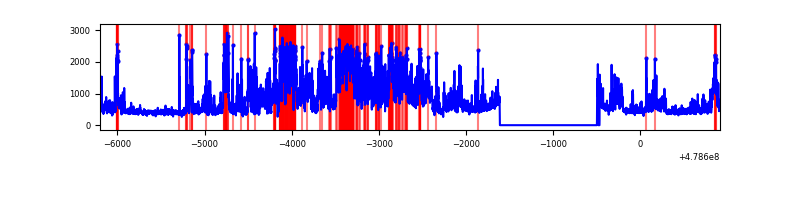 |
| C | 7114 | 5985 | 174 | 174 | 2.45% | 2.91% | 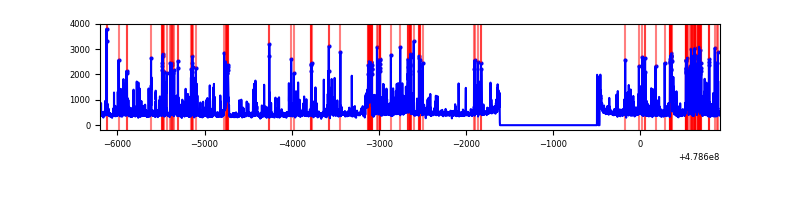 |
| D | 7115 | 5985 | 1248 | 1248 | 17.54% | 20.85% | 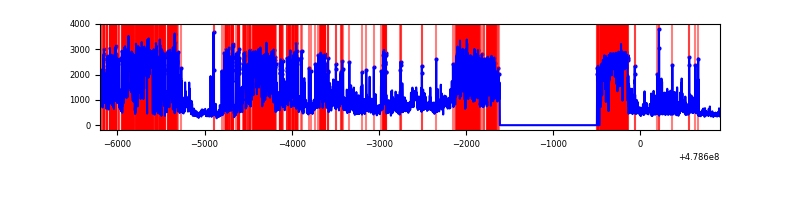 |
Top three noisy pixels from each quadrant. If the there are fewer than three noisy pixels in the level2.evt file, extra rows are filled as -1
| Pixel properties | Quadrant properties | ||||||
|---|---|---|---|---|---|---|---|
| Quadrant | DetID | PixID | Counts | Sigma | Mean | Median | Sigma |
| A | 12 | 3 | 886486 | 5648.71 | 628 | 614 | 156.8 |
| A | 8 | 43 | 222017 | 1411.76 | 628 | 614 | 156.8 |
| A | 7 | 206 | 196565 | 1249.47 | 628 | 614 | 156.8 |
| B | 4 | 81 | 1941581 | 14953.65 | 615 | 595 | 129.8 |
| B | 12 | 32 | 191844 | 1473.41 | 615 | 595 | 129.8 |
| B | 10 | 247 | 64821 | 494.81 | 615 | 595 | 129.8 |
| C | 1 | 44 | 525818 | 3168.77 | 601 | 597 | 165.7 |
| C | 15 | 147 | 201171 | 1210.11 | 601 | 597 | 165.7 |
| C | 4 | 5 | 141625 | 850.85 | 601 | 597 | 165.7 |
| D | 8 | 176 | 3387369 | 22129.86 | 546 | 527 | 153.0 |
| D | 10 | 181 | 460918 | 3008.23 | 546 | 527 | 153.0 |
| D | 12 | 191 | 319902 | 2086.82 | 546 | 527 | 153.0 |
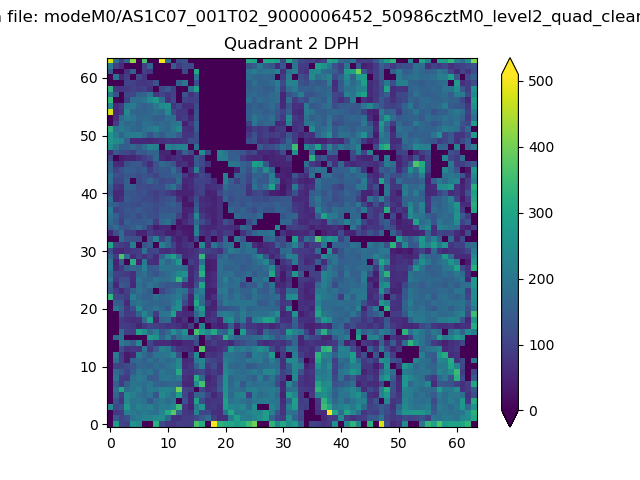
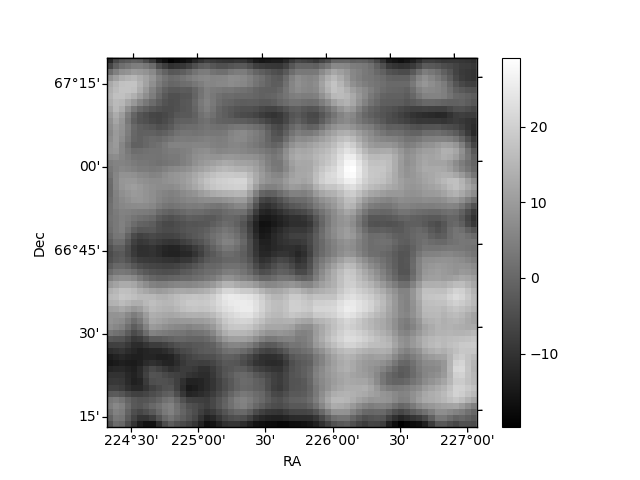
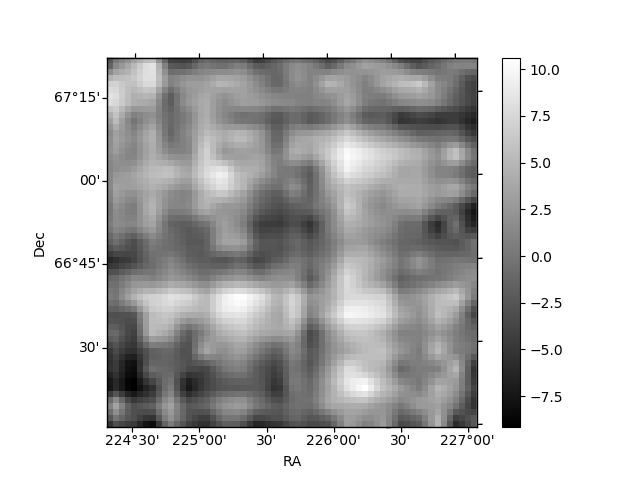
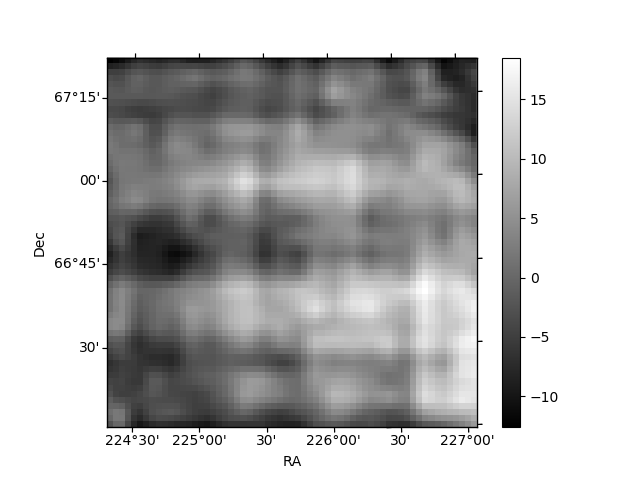
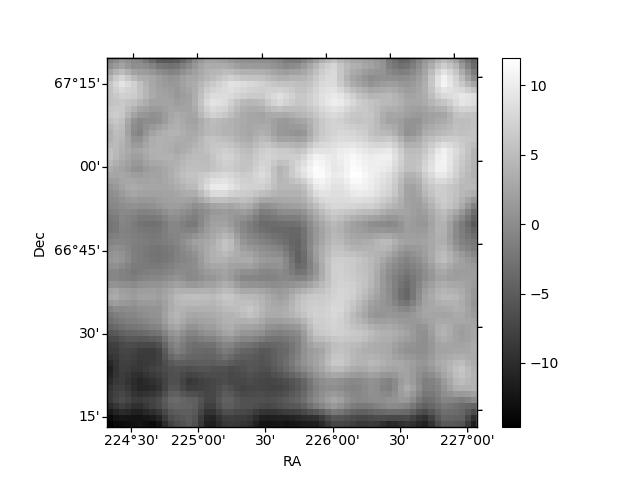
Histogram calculated using DETX and DETY for each event in the final _common_clean file
| Quadrant A | 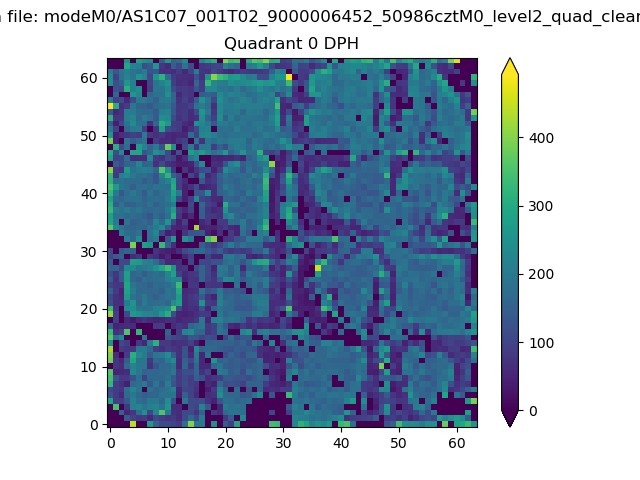 |
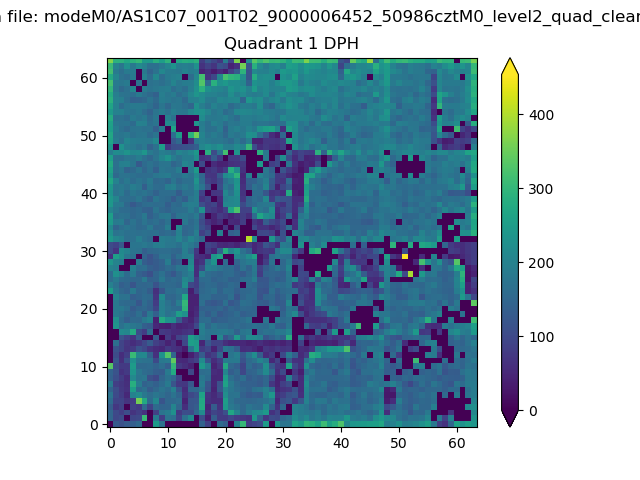 |
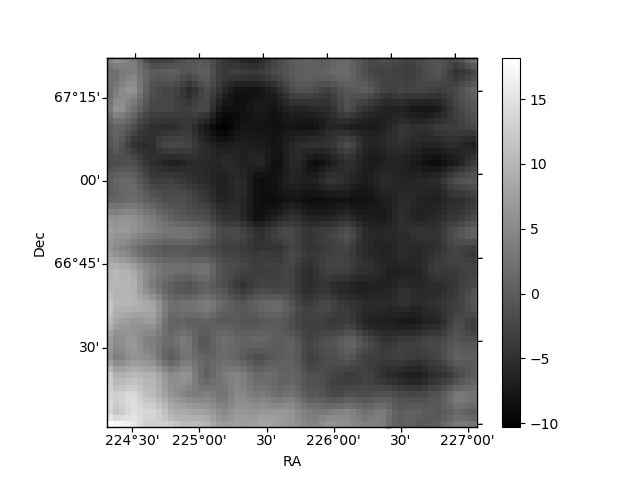
Quadrant B |
|---|---|---|---|
| Quadrant D | 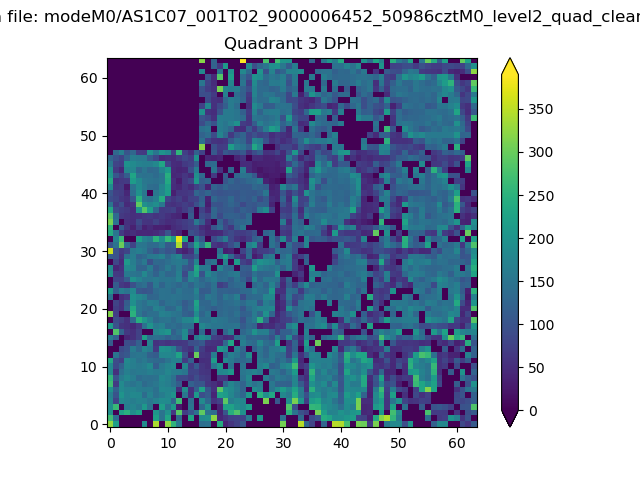 |
 |
Quadrant C |
| Plot type | Count rate plots | Images |
|---|---|---|
| Comparison with Poisson distribution Blue bars denote a histogram of data divided into 1 sec bins. Red curve is a Poisson curve with rate = median count rate of data. |
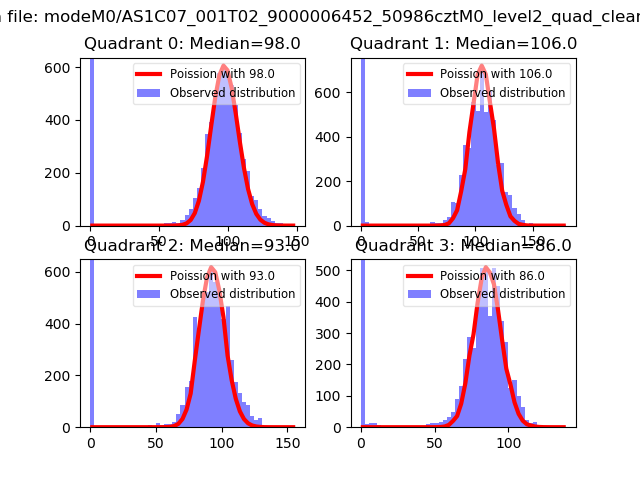 |
 |
| Quadrant-wise count rates Data is divided into 100 sec bins |
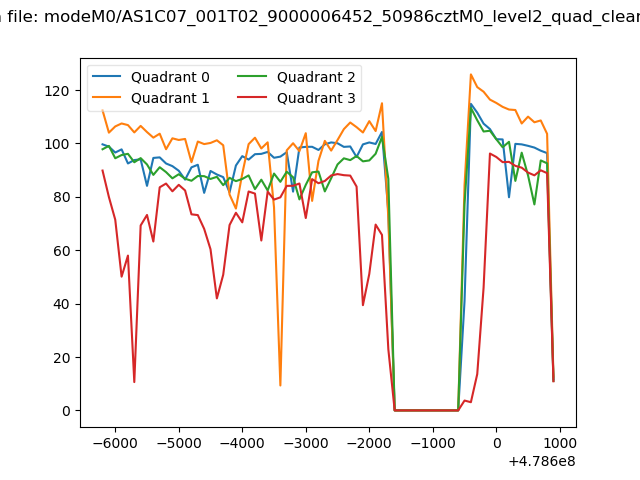 |
|
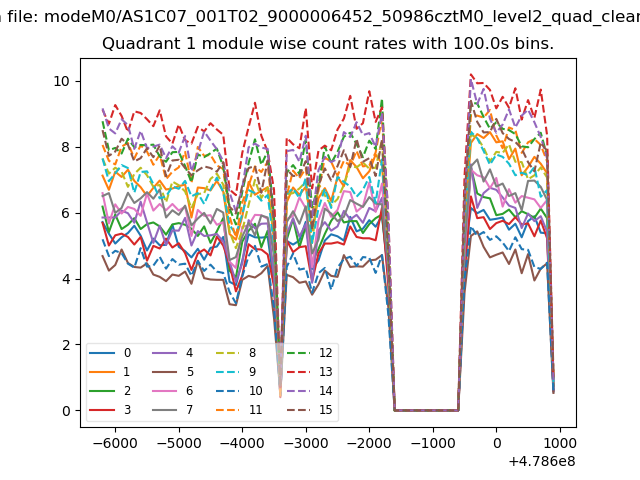
| Module-wise count rates for Quadrant A Data is divided into 100 sec bins |
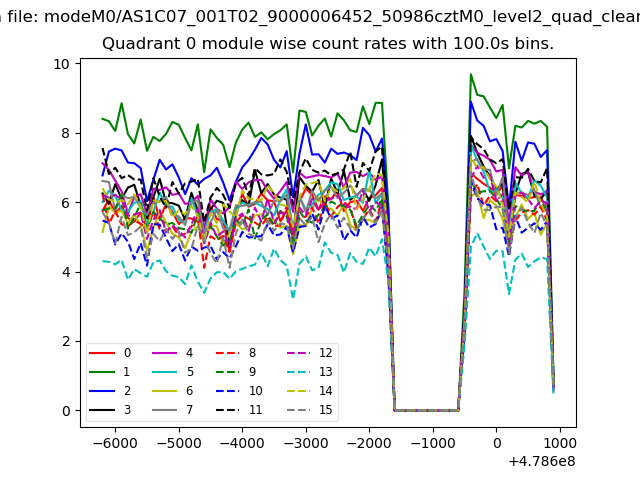 |
 |
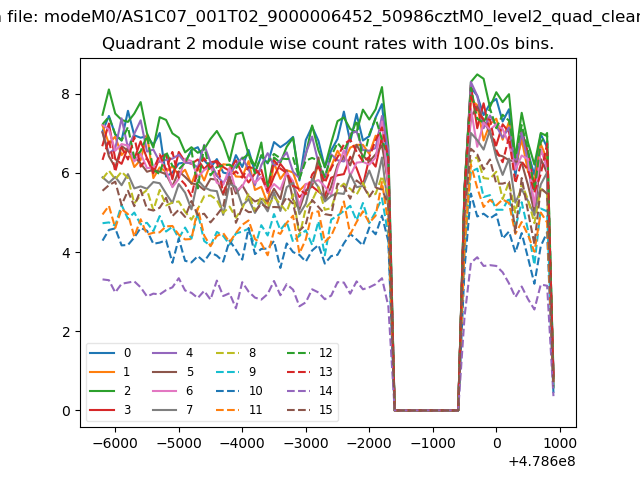
| Module-wise count rates for Quadrant B Data is divided into 100 sec bins |
 |
 |
| Module-wise count rates for Quadrant C Data is divided into 100 sec bins |
 |
 |
| Module-wise count rates for Quadrant D Data is divided into 100 sec bins |
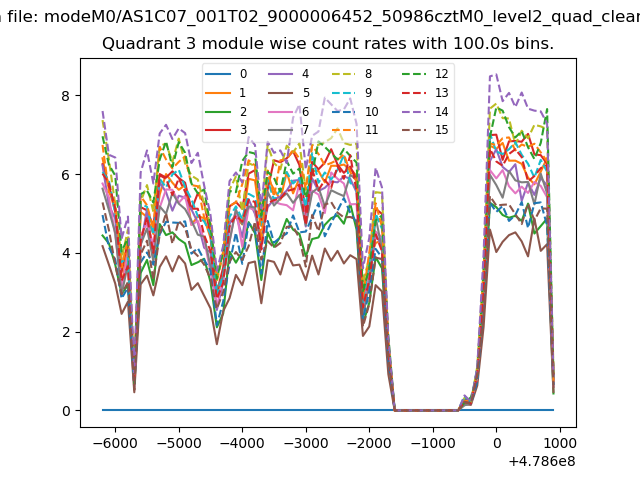 |
 |
| Parameter | Plot |
|---|---|
| CZT HV Monitor | 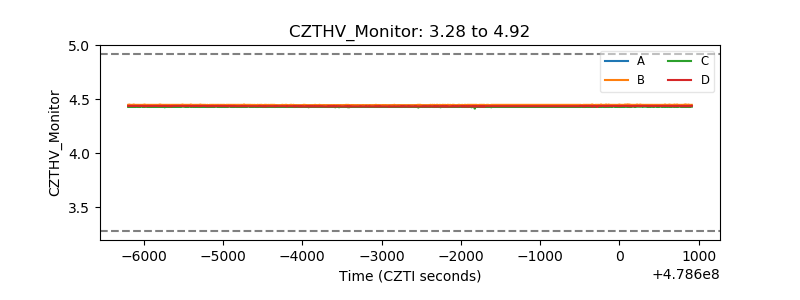 |
| D_VDD | 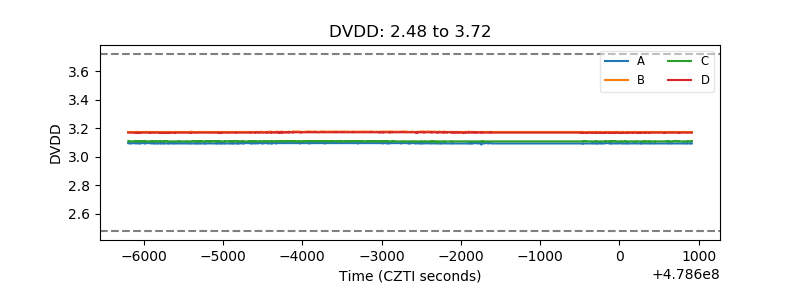 |
| Temperature 1 |  |
| Veto HV Monitor | 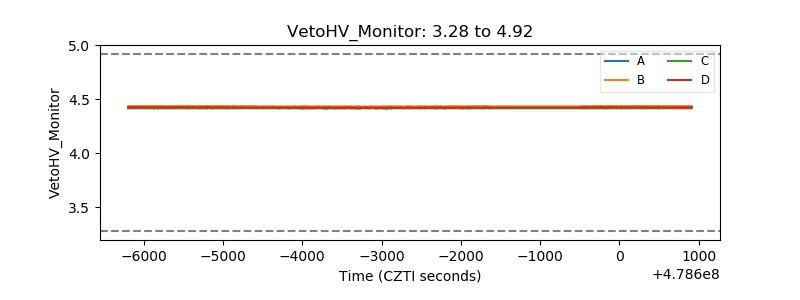 |
| Veto LLD | 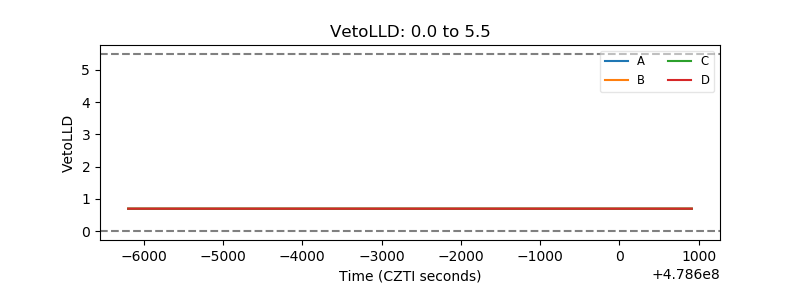 |
| Alpha Counter | 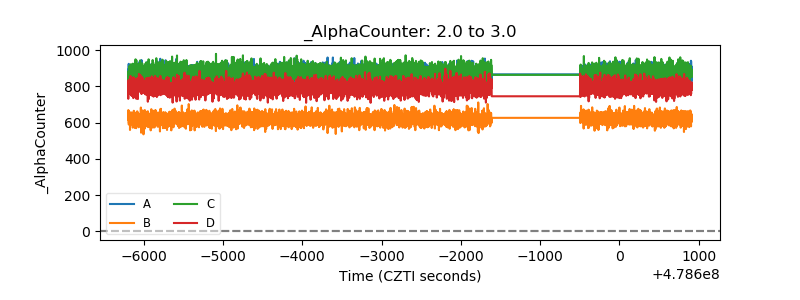 |
| _CPM_Rate | 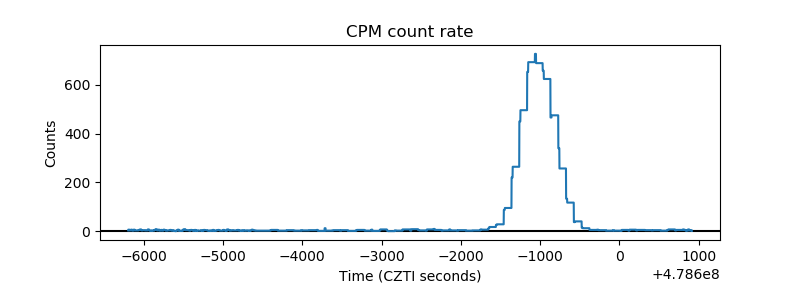 |
| CZT Counter | 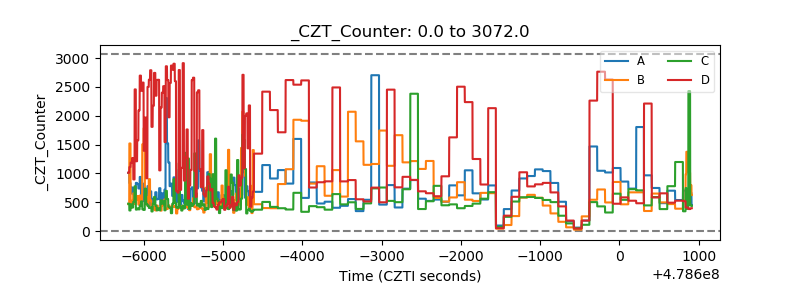 |
| +2.5 Volts monitor | 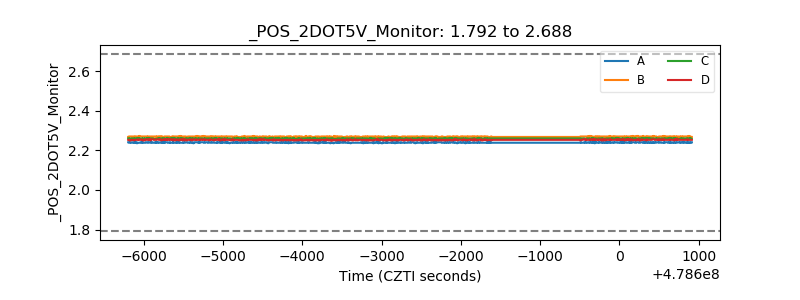 |
| +5 Volts monitor | 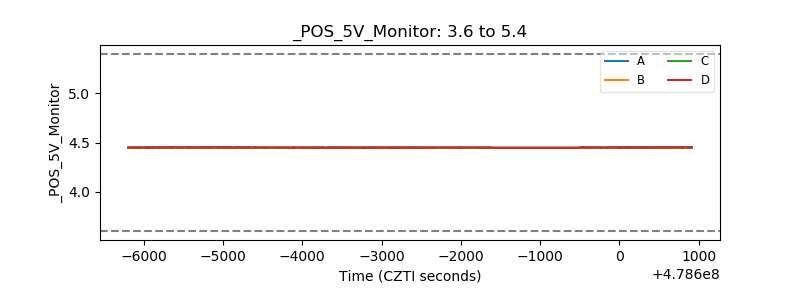 |
| _ROLL_ROT | 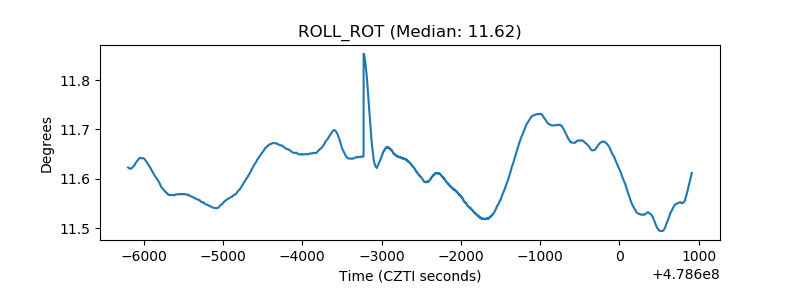 |
| _Roll_DEC | 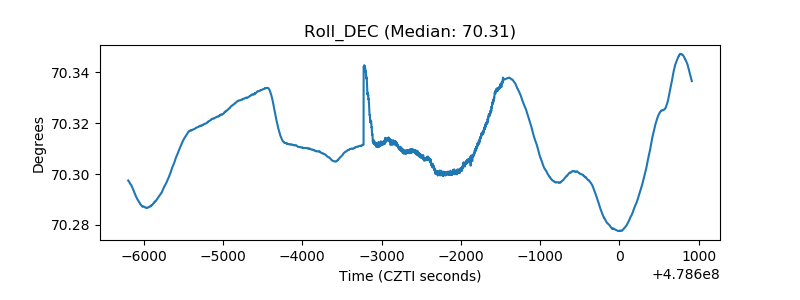 |
| _Roll_RA | 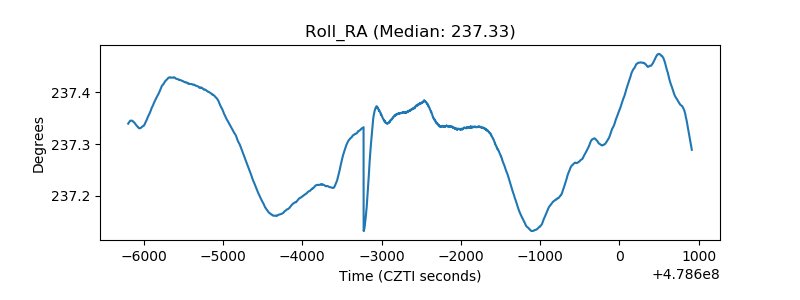 |
| Veto Counter | 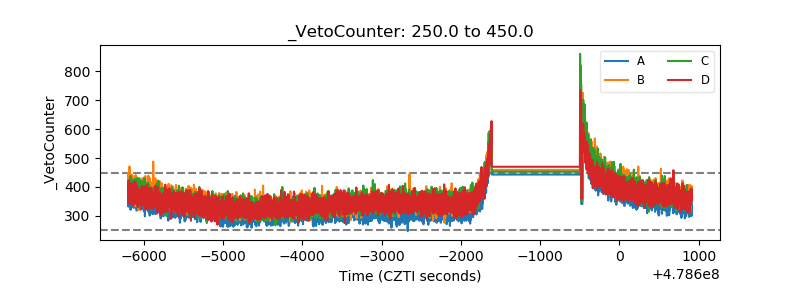 |