| Param | Original file | Final file |
|---|---|---|
| Filename | modeM0/AS1C07_001T02_9000006452_50987cztM0_level2.fits | modeM0/AS1C07_001T02_9000006452_50987cztM0_level2_quad_clean.evt |
| Size (bytes) | 526,334,400 | 93,700,800 |
| Size | 502.0 MB | 89.4 MB |
| Events in quadrant A | 5,054,732 | 612,317 |
| Events in quadrant B | 4,916,079 | 658,036 |
| Events in quadrant C | 4,383,552 | 584,761 |
| Events in quadrant D | 4,634,541 | 537,807 |
| Mode SS | |||
|---|---|---|---|
| Quadrant | BADHDUFLAG | Total packets | Discarded packets |
| A | 0 | 128 | 0 |
| B | 0 | 128 | 0 |
| C | 0 | 128 | 0 |
| D | 0 | 128 | 0 |
| Mode M9 | |||
|---|---|---|---|
| Quadrant | BADHDUFLAG | Total packets | Discarded packets |
| A | 0 | 12 | 0 |
| B | 0 | 12 | 0 |
| C | 0 | 12 | 0 |
| D | 0 | 12 | 0 |
| Mode M0 | |||
|---|---|---|---|
| Quadrant | BADHDUFLAG | Total packets | Discarded packets |
| A | 0 | 19435 | 3 |
| B | 0 | 18975 | 1 |
| C | 0 | 17456 | 1 |
| D | 0 | 18069 | 1 |
| Quadrant | Total seconds | Saturated seconds | Saturation percentage |
|---|---|---|---|
| A | 6371 | 312 | 4.897190% |
| B | 6371 | 441 | 6.921990% |
| C | 6371 | 352 | 5.525035% |
| D | 6372 | 410 | 6.434401% |
Noise dominated data is calculated using 1-second bins in cleaned event files. If a bin has >2000 counts, and if more than 50% of those come from <1% of pixels, then it is considered to be noise-dominated and hence unusable.
| Quadrant | # 1 sec bins | Bins with >0 counts | Bins with >2000 counts | High rate bins dominated by noise | Noise dominated (total time) | Noise dominated (detector-on time) | Marked lightcurve |
|---|---|---|---|---|---|---|---|
| A | 7521 | 6371 | 206 | 206 | 2.74% | 3.23% | 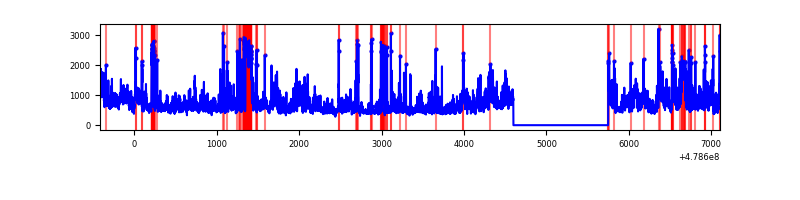 |
| B | 7521 | 6371 | 319 | 319 | 4.24% | 5.01% | 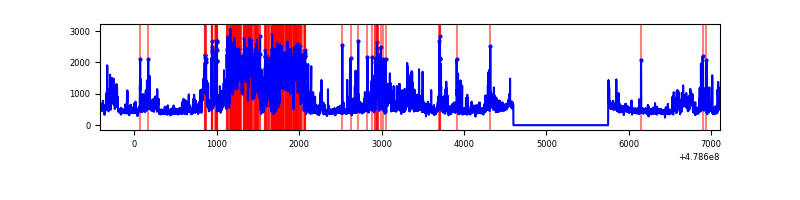 |
| C | 7521 | 6371 | 306 | 306 | 4.07% | 4.80% | 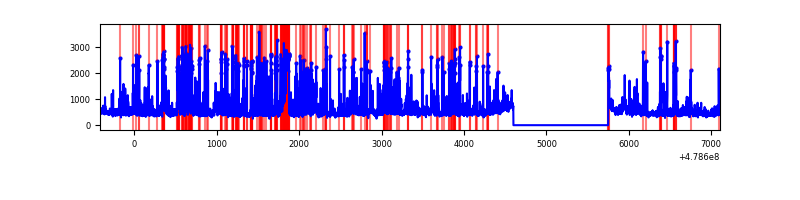 |
| D | 7522 | 6373 | 368 | 368 | 4.89% | 5.77% | 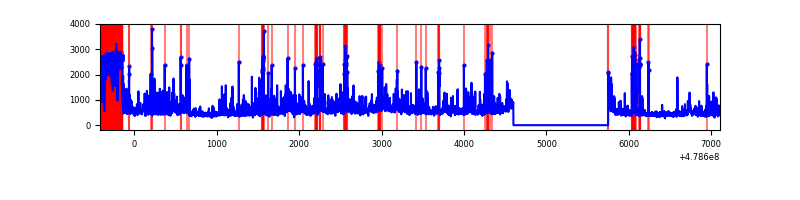 |
Top three noisy pixels from each quadrant. If the there are fewer than three noisy pixels in the level2.evt file, extra rows are filled as -1
| Pixel properties | Quadrant properties | ||||||
|---|---|---|---|---|---|---|---|
| Quadrant | DetID | PixID | Counts | Sigma | Mean | Median | Sigma |
| A | 12 | 3 | 1082933 | 6432.87 | 678 | 661 | 168.2 |
| A | 8 | 43 | 234793 | 1391.65 | 678 | 661 | 168.2 |
| A | 7 | 206 | 214411 | 1270.5 | 678 | 661 | 168.2 |
| B | 4 | 81 | 1589091 | 11349.07 | 667 | 646 | 140.0 |
| B | 0 | 172 | 118311 | 840.69 | 667 | 646 | 140.0 |
| B | 10 | 14 | 94491 | 670.5 | 667 | 646 | 140.0 |
| C | 1 | 44 | 965969 | 5459.12 | 645 | 639 | 176.8 |
| C | 15 | 147 | 272862 | 1539.47 | 645 | 639 | 176.8 |
| C | 15 | 230 | 82641 | 463.74 | 645 | 639 | 176.8 |
| D | 8 | 176 | 597194 | 3386.97 | 635 | 612 | 176.1 |
| D | 10 | 181 | 521907 | 2959.54 | 635 | 612 | 176.1 |
| D | 7 | 39 | 357078 | 2023.76 | 635 | 612 | 176.1 |
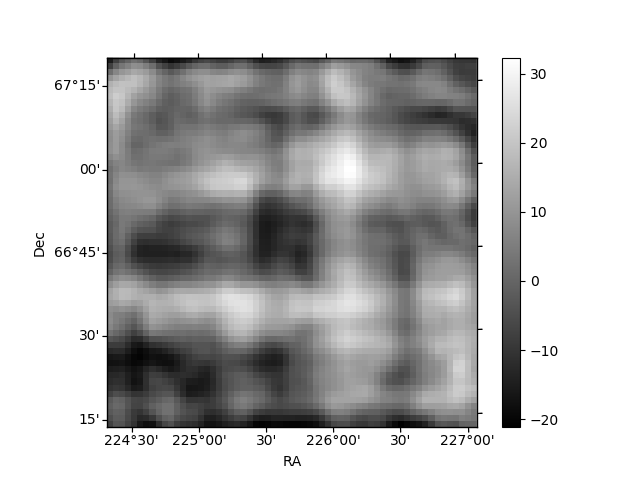
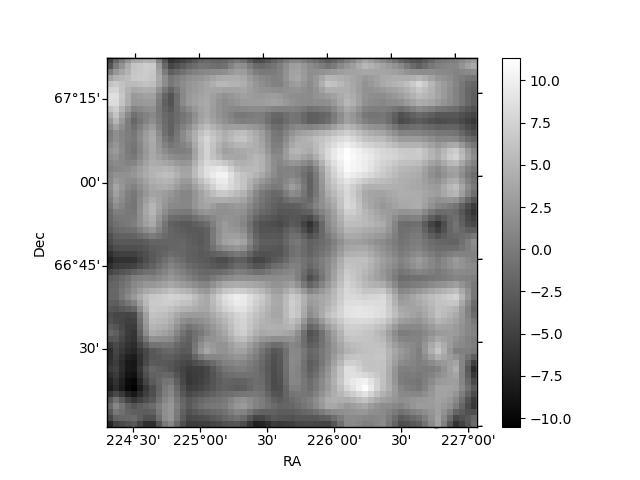
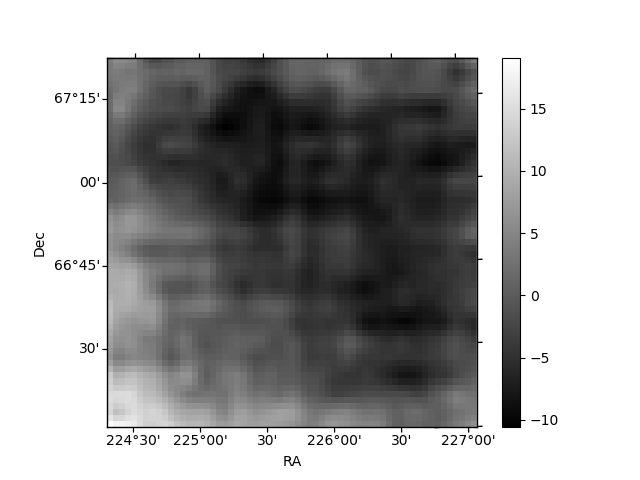
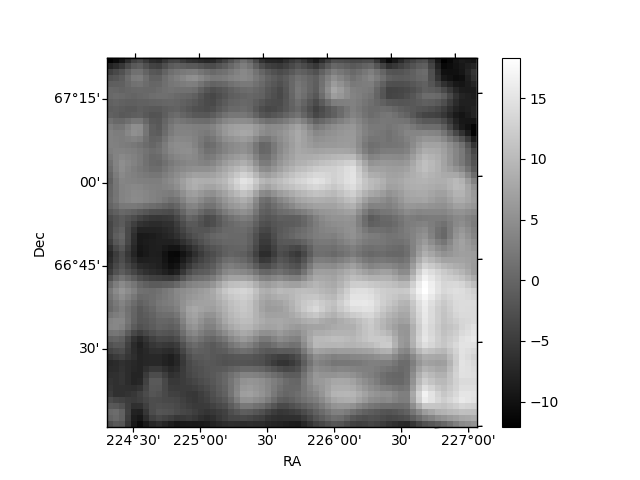
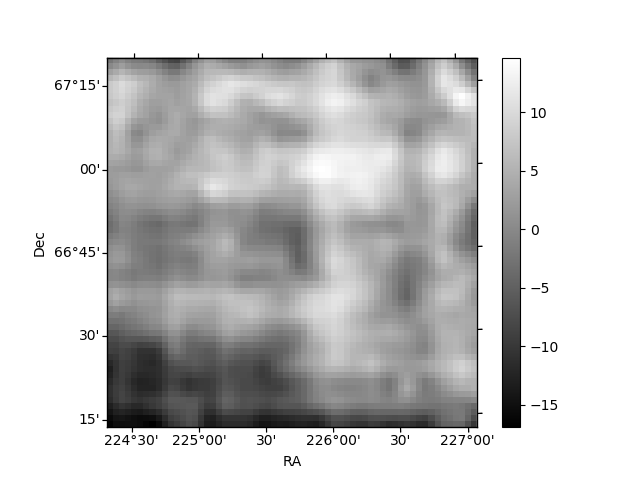
Histogram calculated using DETX and DETY for each event in the final _common_clean file
| Quadrant A | 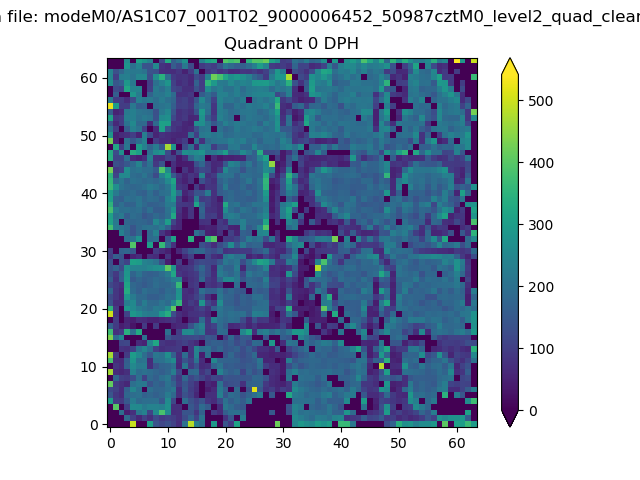 |
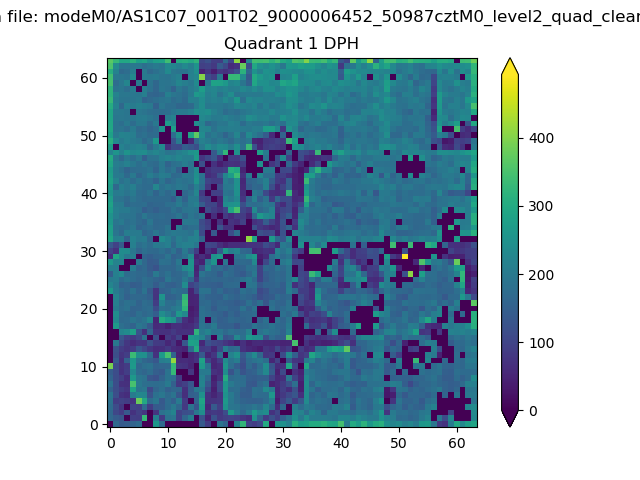 |
Quadrant B |
|---|---|---|---|
| Quadrant D | 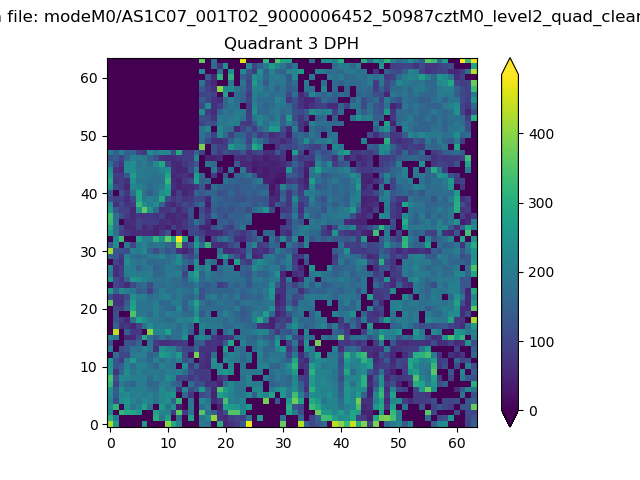 |
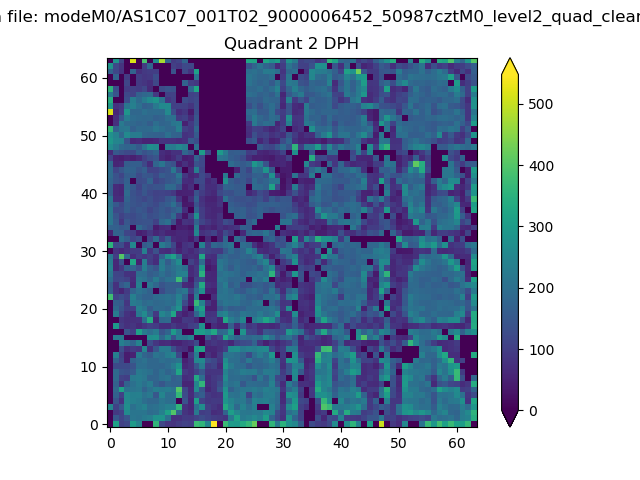 |
Quadrant C |
| Plot type | Count rate plots | Images |
|---|---|---|
| Comparison with Poisson distribution Blue bars denote a histogram of data divided into 1 sec bins. Red curve is a Poisson curve with rate = median count rate of data. |
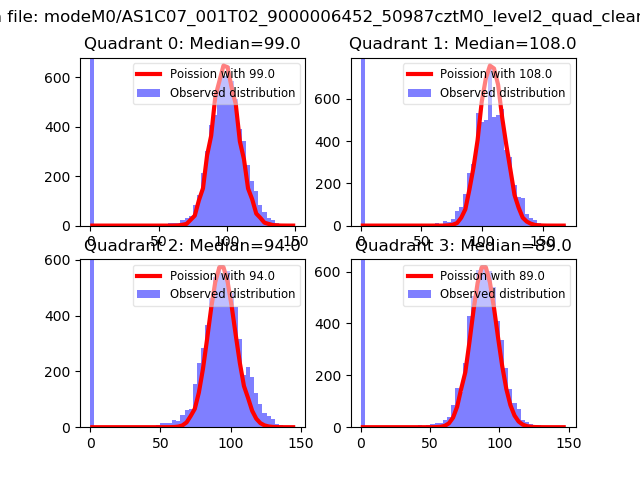 |
 |
| Quadrant-wise count rates Data is divided into 100 sec bins |
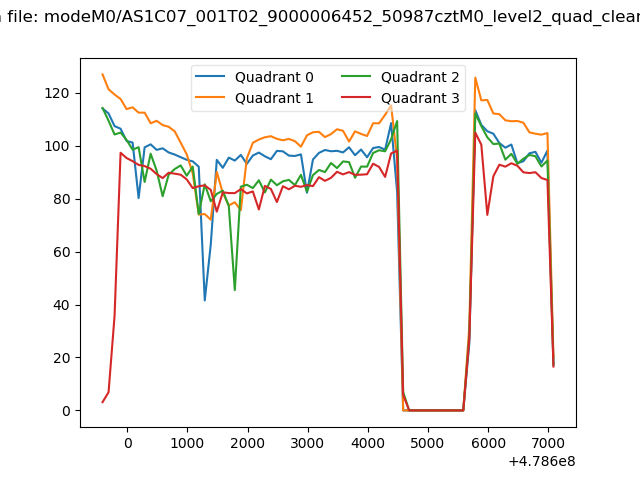 |
|
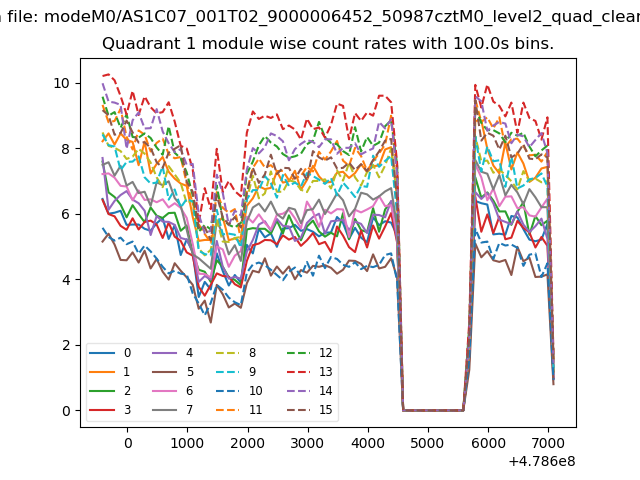
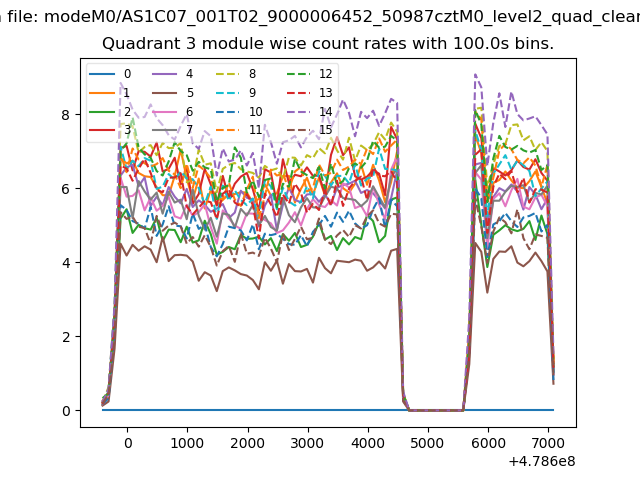
| Module-wise count rates for Quadrant A Data is divided into 100 sec bins |
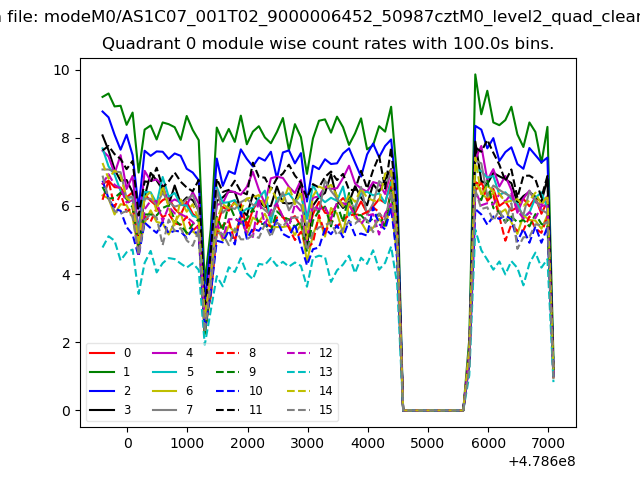 |
 |
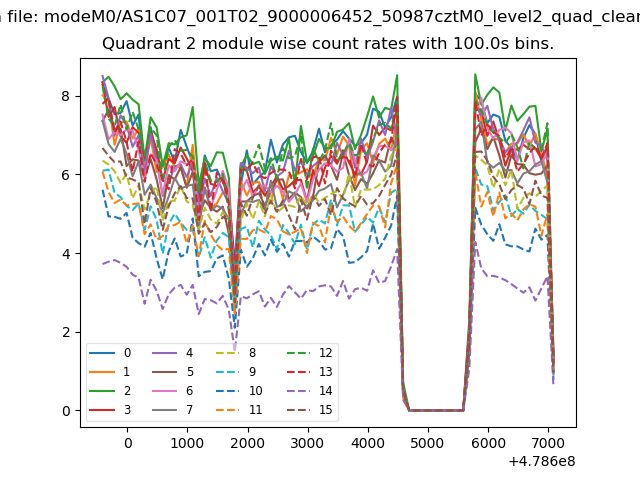
| Module-wise count rates for Quadrant B Data is divided into 100 sec bins |
 |
 |
| Module-wise count rates for Quadrant C Data is divided into 100 sec bins |
 |
 |
| Module-wise count rates for Quadrant D Data is divided into 100 sec bins |
 |
 |
| Parameter | Plot |
|---|---|
| CZT HV Monitor | 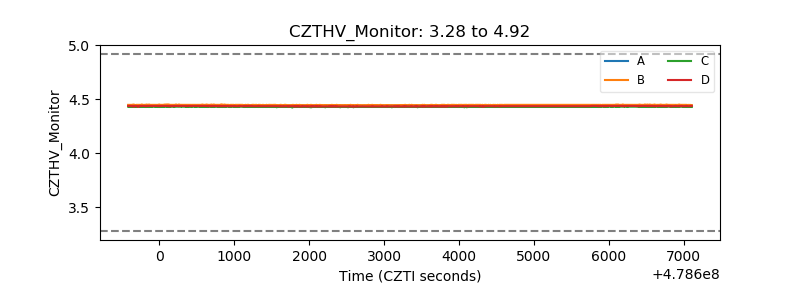 |
| D_VDD | 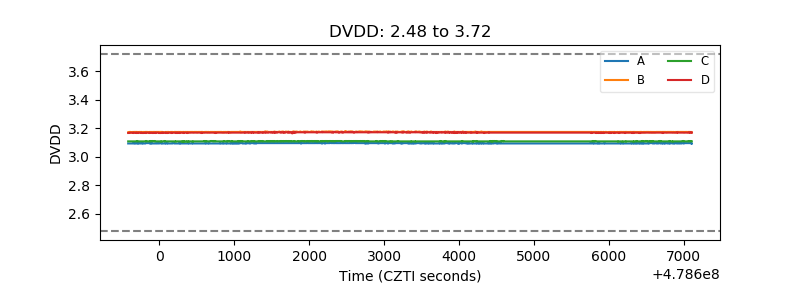 |
| Temperature 1 | 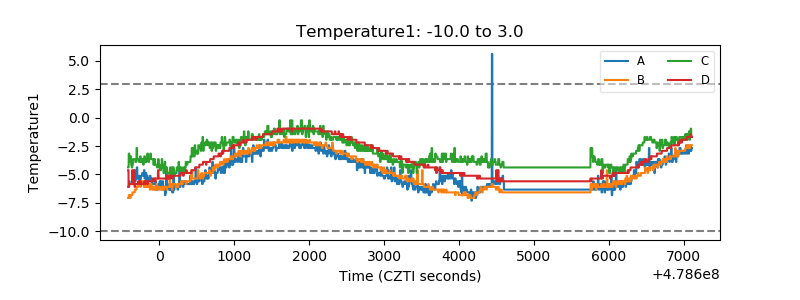 |
| Veto HV Monitor | 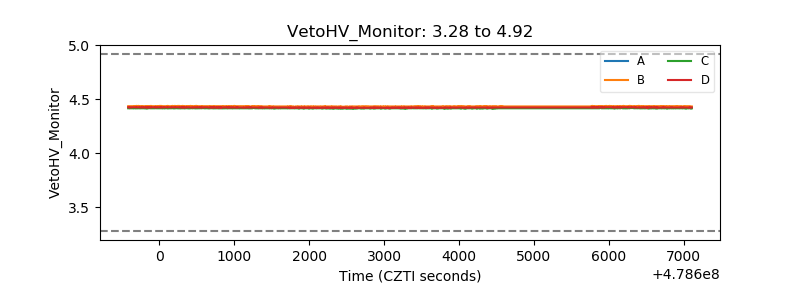 |
| Veto LLD | 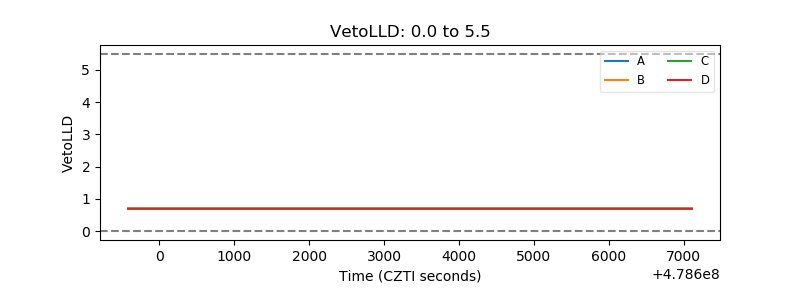 |
| Alpha Counter | 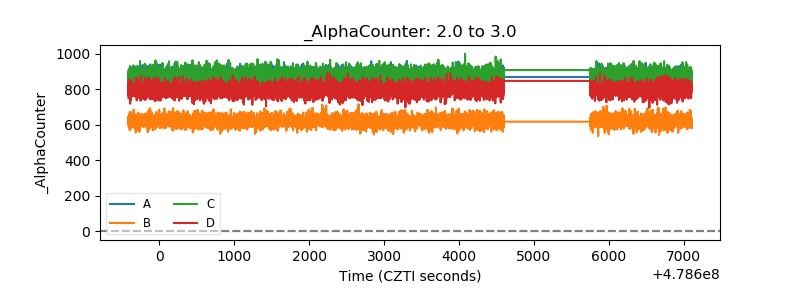 |
| _CPM_Rate | 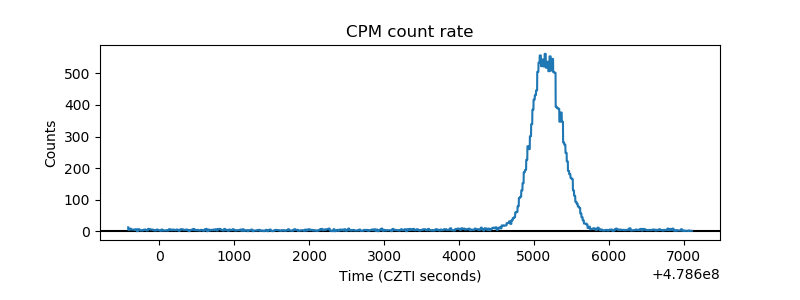 |
| CZT Counter | 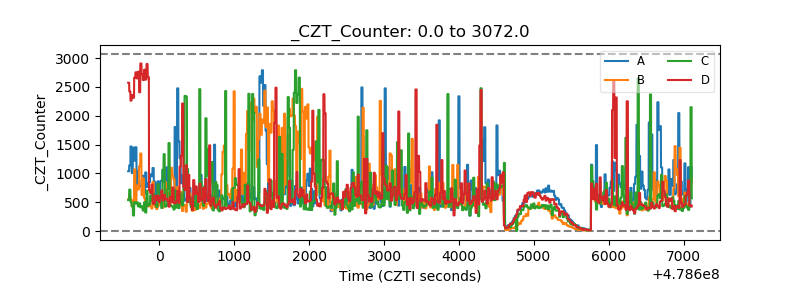 |
| +2.5 Volts monitor | 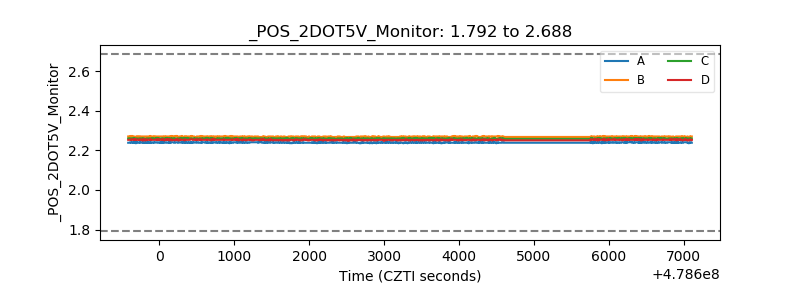 |
| +5 Volts monitor |  |
| _ROLL_ROT | 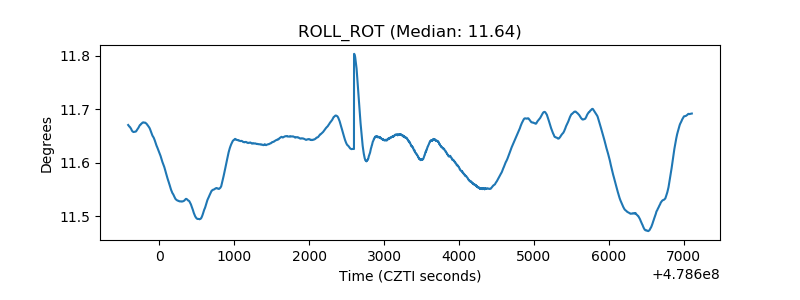 |
| _Roll_DEC | 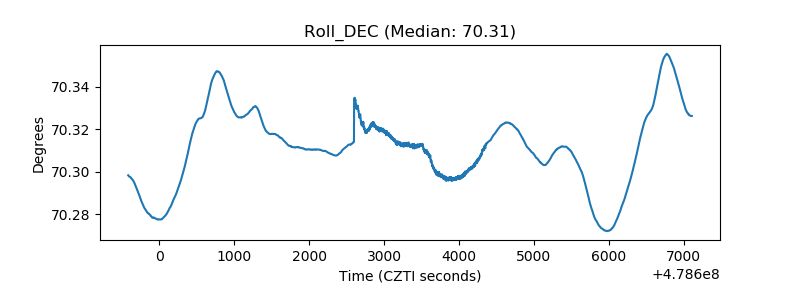 |
| _Roll_RA | 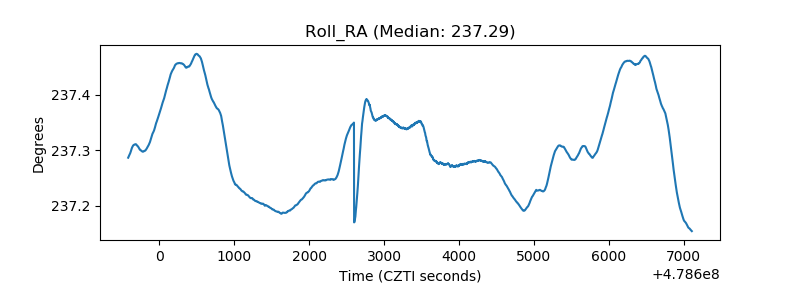 |
| Veto Counter | 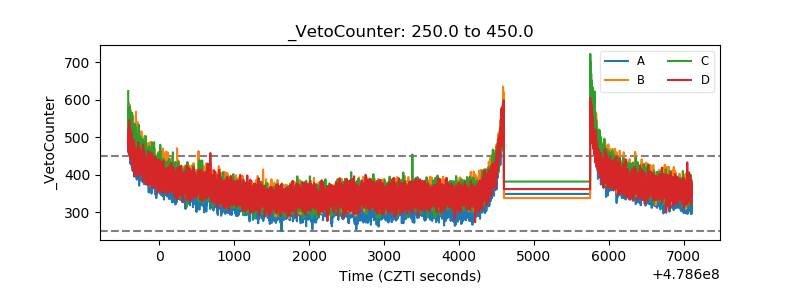 |