| Param | Original file | Final file |
|---|---|---|
| Filename | modeM0/AS1C07_001T02_9000006452_50988cztM0_level2.fits | modeM0/AS1C07_001T02_9000006452_50988cztM0_level2_quad_clean.evt |
| Size (bytes) | 534,191,040 | 94,694,400 |
| Size | 509.4 MB | 90.3 MB |
| Events in quadrant A | 5,228,704 | 624,141 |
| Events in quadrant B | 4,229,329 | 672,403 |
| Events in quadrant C | 4,385,999 | 586,286 |
| Events in quadrant D | 5,424,059 | 529,427 |
| Mode SS | |||
|---|---|---|---|
| Quadrant | BADHDUFLAG | Total packets | Discarded packets |
| A | 0 | 132 | 0 |
| B | 0 | 132 | 0 |
| C | 0 | 132 | 0 |
| D | 0 | 132 | 0 |
| Mode M9 | |||
|---|---|---|---|
| Quadrant | BADHDUFLAG | Total packets | Discarded packets |
| A | 0 | 11 | 0 |
| B | 0 | 11 | 0 |
| C | 0 | 12 | 0 |
| D | 0 | 12 | 0 |
| Mode M0 | |||
|---|---|---|---|
| Quadrant | BADHDUFLAG | Total packets | Discarded packets |
| A | 0 | 19978 | 2 |
| B | 0 | 17104 | 2 |
| C | 0 | 17618 | 2 |
| D | 0 | 20579 | 2 |
| Quadrant | Total seconds | Saturated seconds | Saturation percentage |
|---|---|---|---|
| A | 6526 | 289 | 4.428440% |
| B | 6526 | 277 | 4.244560% |
| C | 6526 | 375 | 5.746246% |
| D | 6526 | 590 | 9.040760% |
Noise dominated data is calculated using 1-second bins in cleaned event files. If a bin has >2000 counts, and if more than 50% of those come from <1% of pixels, then it is considered to be noise-dominated and hence unusable.
| Quadrant | # 1 sec bins | Bins with >0 counts | Bins with >2000 counts | High rate bins dominated by noise | Noise dominated (total time) | Noise dominated (detector-on time) | Marked lightcurve |
|---|---|---|---|---|---|---|---|
| A | 7596 | 6526 | 186 | 186 | 2.45% | 2.85% | 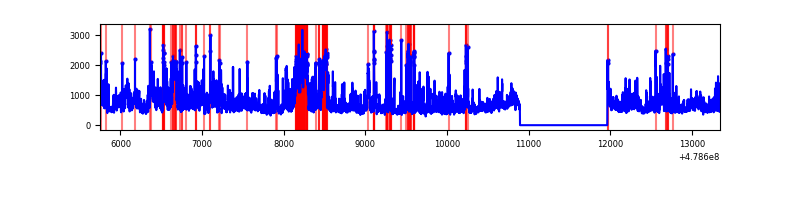 |
| B | 7596 | 6526 | 105 | 105 | 1.38% | 1.61% | 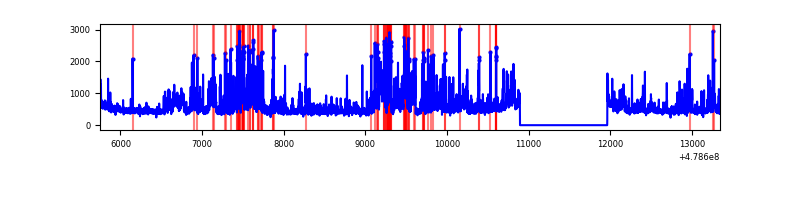 |
| C | 7596 | 6526 | 273 | 273 | 3.59% | 4.18% | 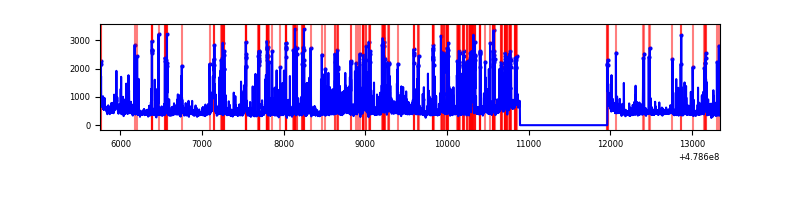 |
| D | 7596 | 6526 | 491 | 491 | 6.46% | 7.52% | 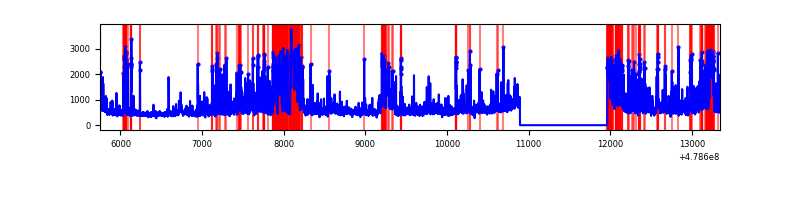 |
Top three noisy pixels from each quadrant. If the there are fewer than three noisy pixels in the level2.evt file, extra rows are filled as -1
| Pixel properties | Quadrant properties | ||||||
|---|---|---|---|---|---|---|---|
| Quadrant | DetID | PixID | Counts | Sigma | Mean | Median | Sigma |
| A | 12 | 3 | 841005 | 4829.25 | 700 | 683 | 174.0 |
| A | 12 | 80 | 608471 | 3492.9 | 700 | 683 | 174.0 |
| A | 3 | 46 | 223884 | 1282.72 | 700 | 683 | 174.0 |
| B | 4 | 81 | 758833 | 5273.37 | 685 | 662 | 143.8 |
| B | 0 | 200 | 178501 | 1236.94 | 685 | 662 | 143.8 |
| B | 7 | 252 | 90534 | 625.09 | 685 | 662 | 143.8 |
| C | 1 | 44 | 934833 | 5143.19 | 662 | 656 | 181.6 |
| C | 13 | 3 | 193404 | 1061.19 | 662 | 656 | 181.6 |
| C | 12 | 252 | 85231 | 465.63 | 662 | 656 | 181.6 |
| D | 10 | 181 | 885808 | 4900.97 | 652 | 630 | 180.6 |
| D | 8 | 176 | 714266 | 3951.19 | 652 | 630 | 180.6 |
| D | 7 | 39 | 266631 | 1472.77 | 652 | 630 | 180.6 |
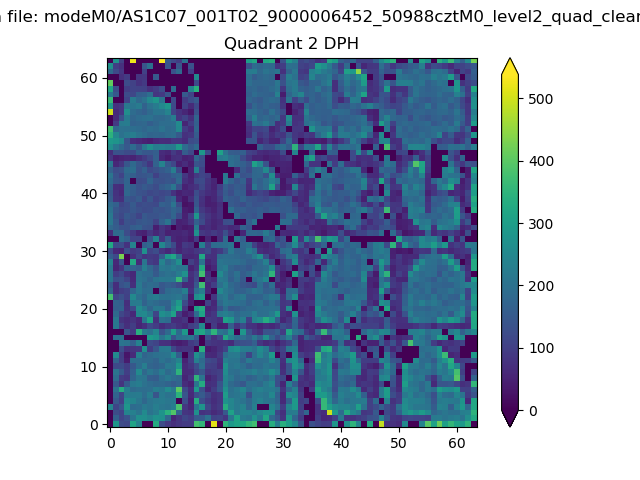
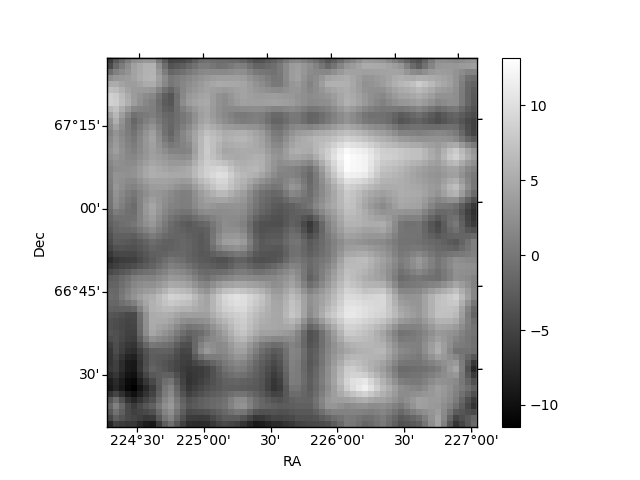
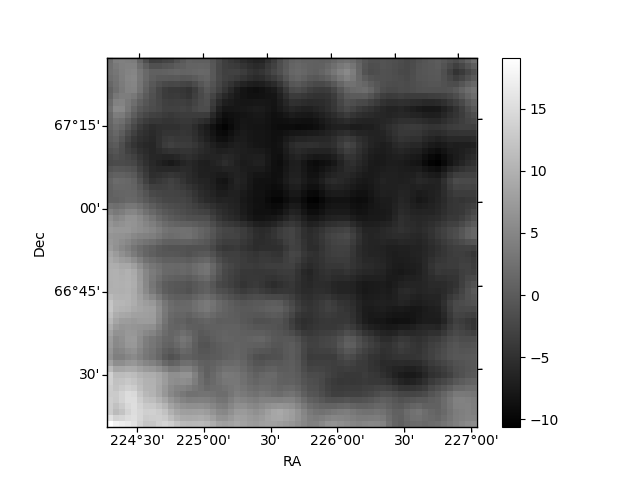
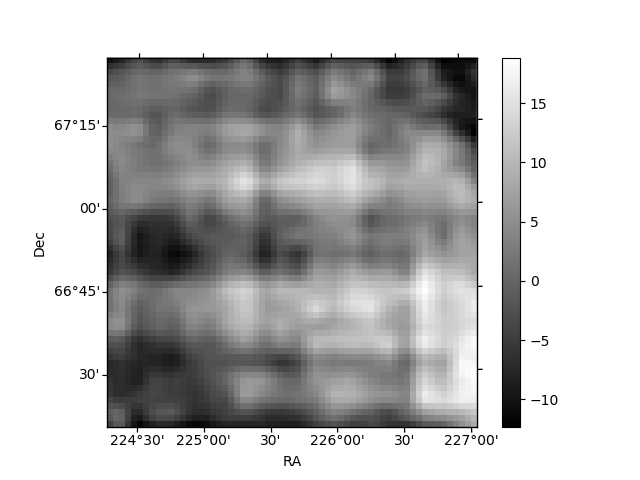
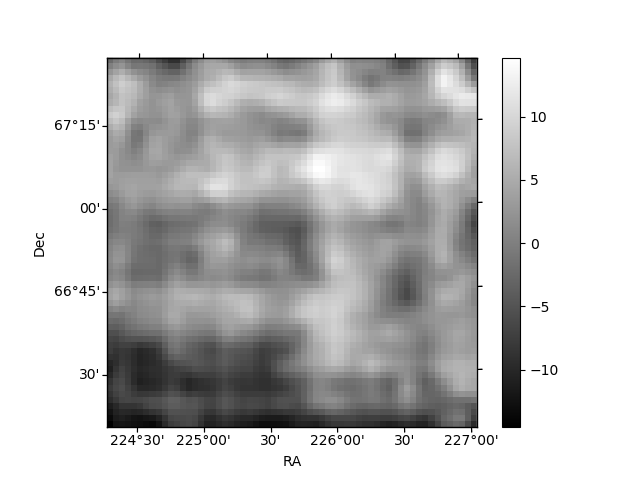
Histogram calculated using DETX and DETY for each event in the final _common_clean file
| Quadrant A | 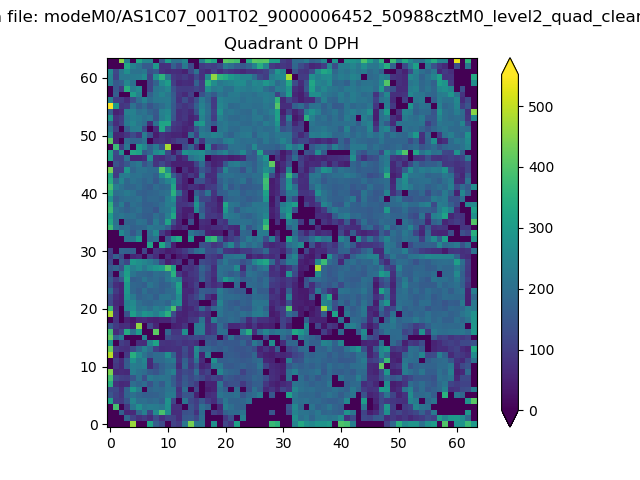 |
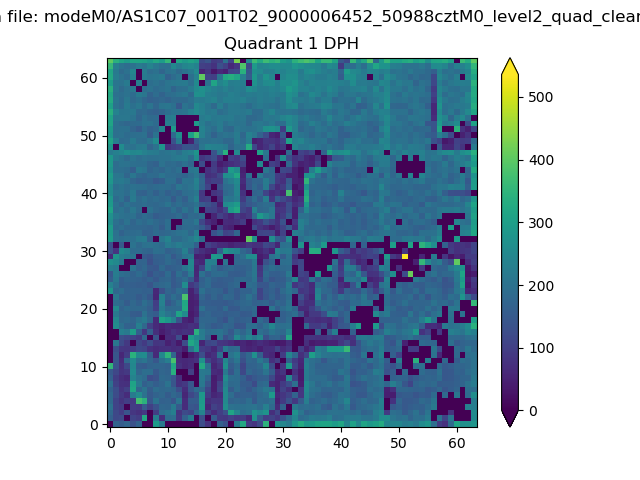 |
Quadrant B |
|---|---|---|---|
| Quadrant D | 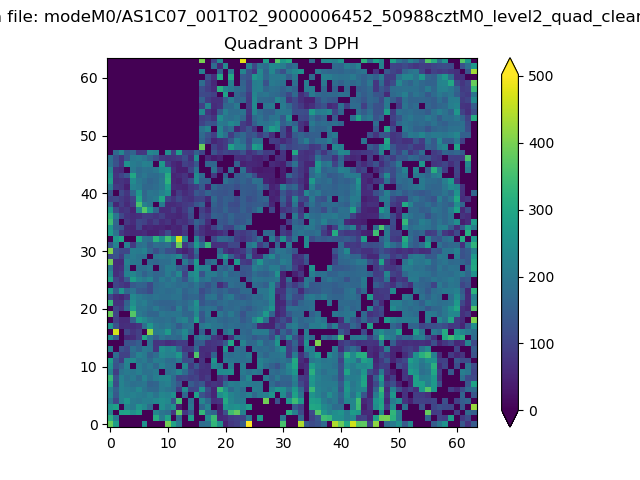 |
 |
Quadrant C |
| Plot type | Count rate plots | Images |
|---|---|---|
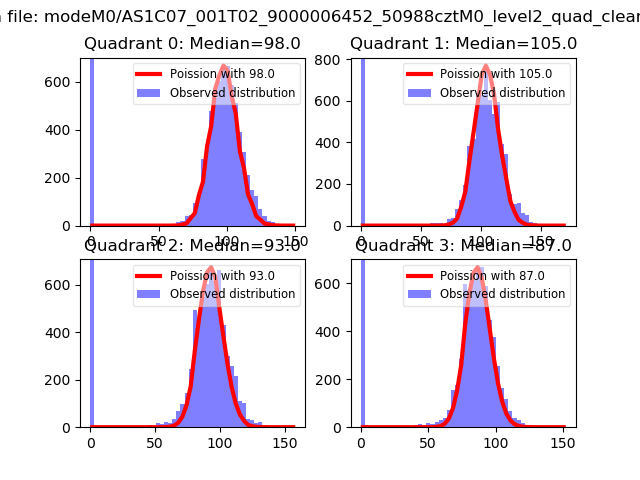
| Comparison with Poisson distribution Blue bars denote a histogram of data divided into 1 sec bins. Red curve is a Poisson curve with rate = median count rate of data. |
 |
 |
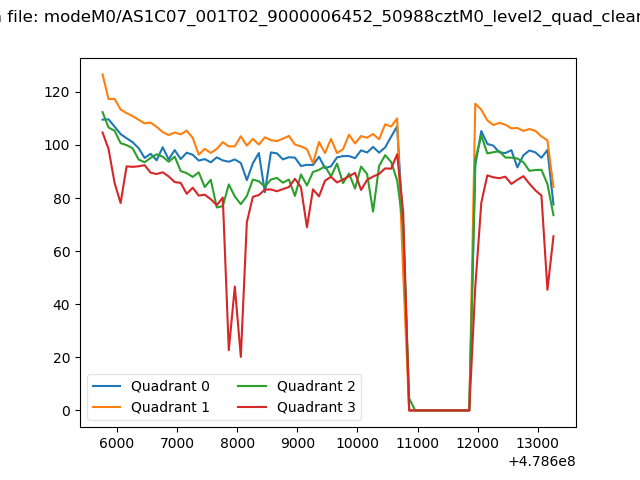
| Quadrant-wise count rates Data is divided into 100 sec bins |
 |
|
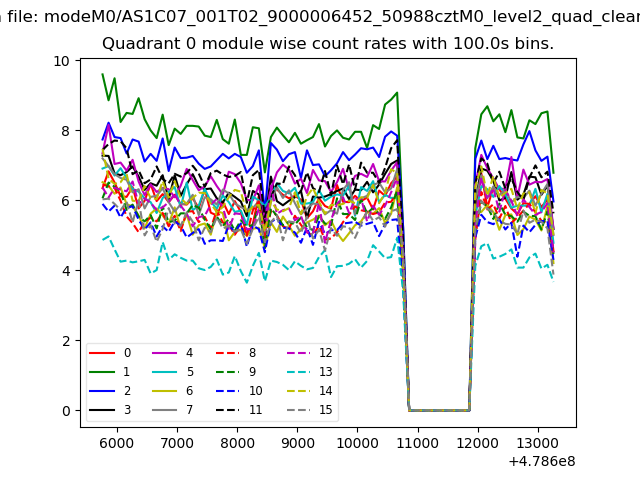
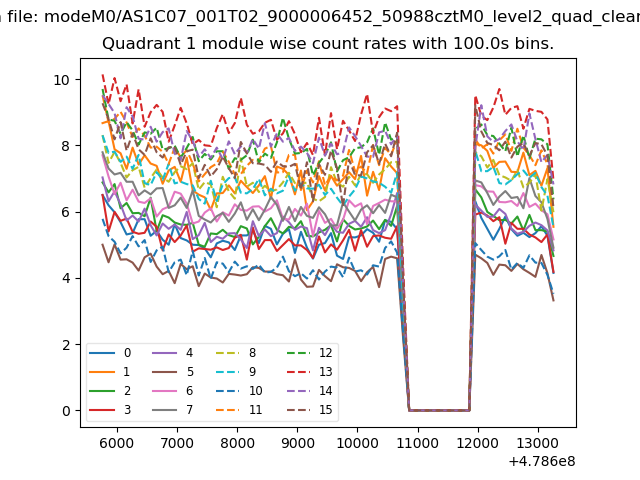
| Module-wise count rates for Quadrant A Data is divided into 100 sec bins |
 |
 |
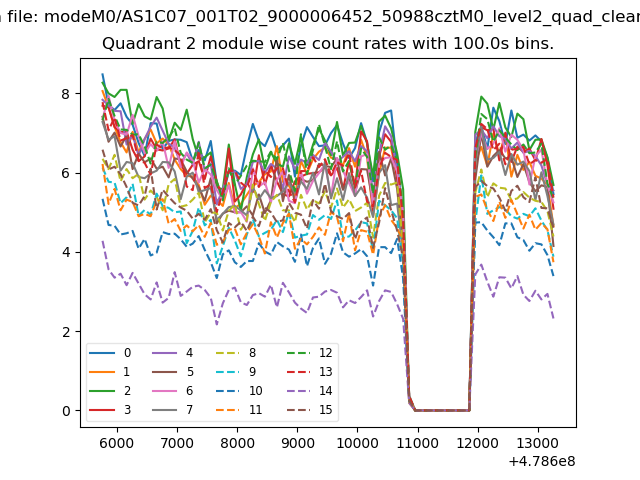
| Module-wise count rates for Quadrant B Data is divided into 100 sec bins |
 |
 |
| Module-wise count rates for Quadrant C Data is divided into 100 sec bins |
 |
 |
| Module-wise count rates for Quadrant D Data is divided into 100 sec bins |
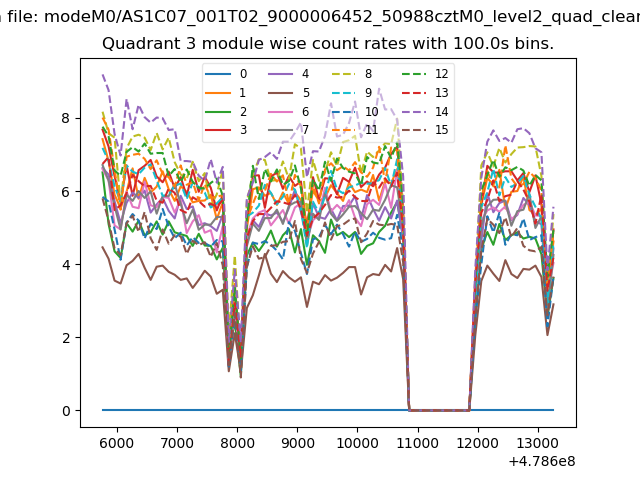 |
 |
| Parameter | Plot |
|---|---|
| CZT HV Monitor | 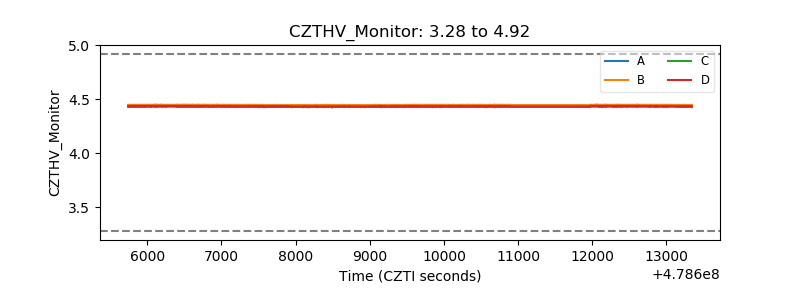 |
| D_VDD | 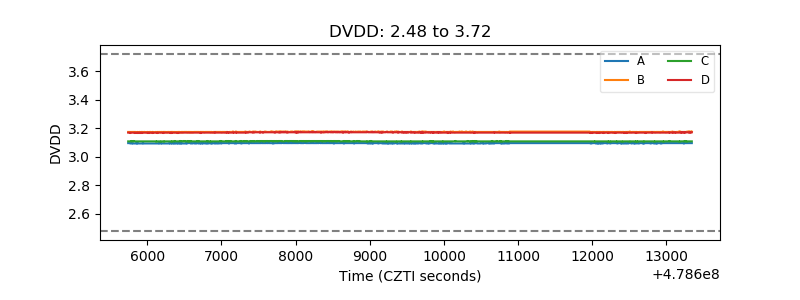 |
| Temperature 1 | 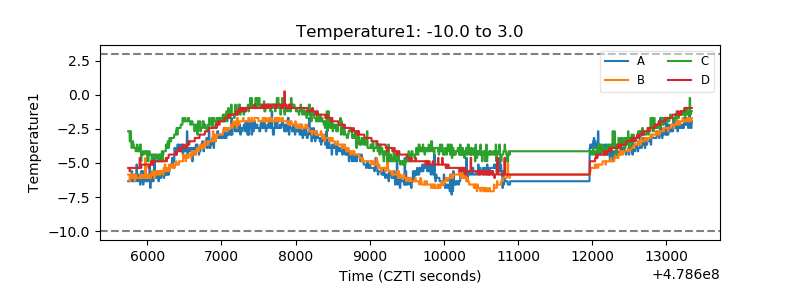 |
| Veto HV Monitor | 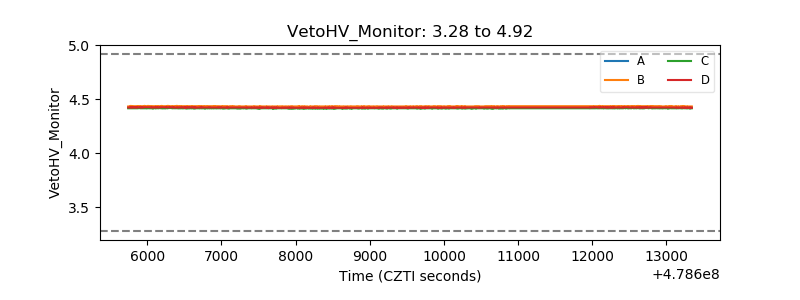 |
| Veto LLD | 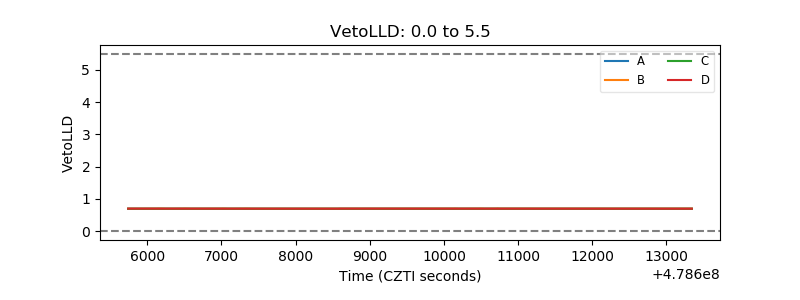 |
| Alpha Counter | 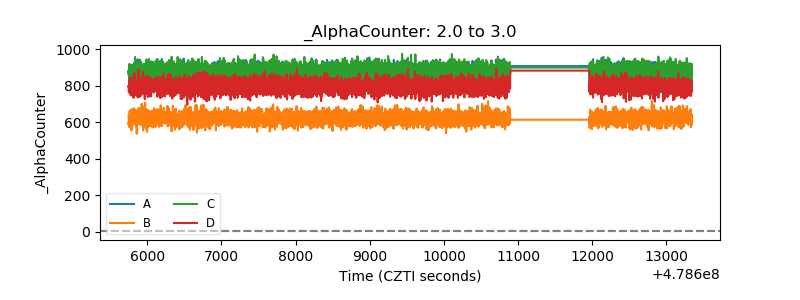 |
| _CPM_Rate | 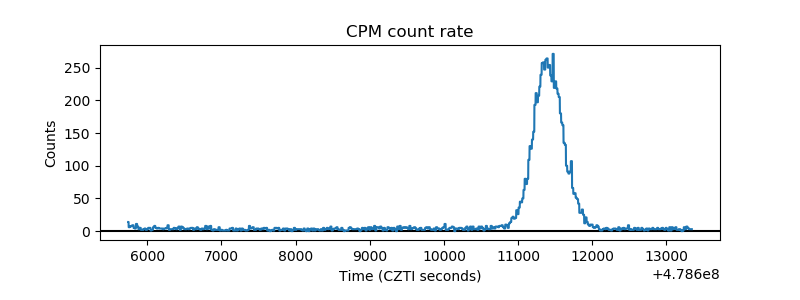 |
| CZT Counter | 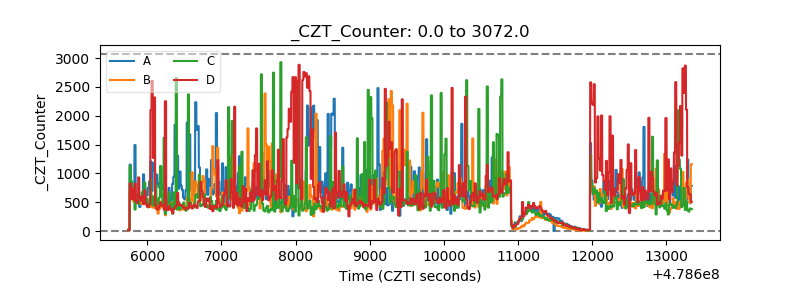 |
| +2.5 Volts monitor |  |
| +5 Volts monitor | 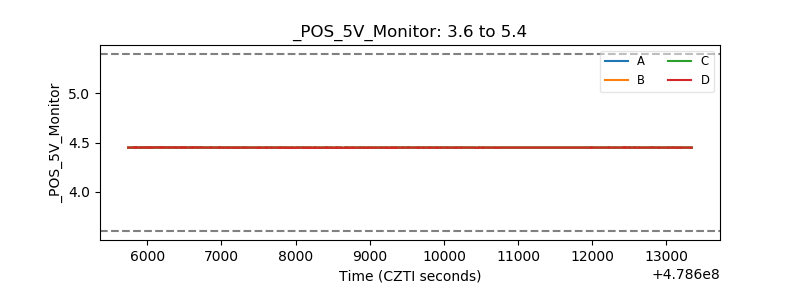 |
| _ROLL_ROT | 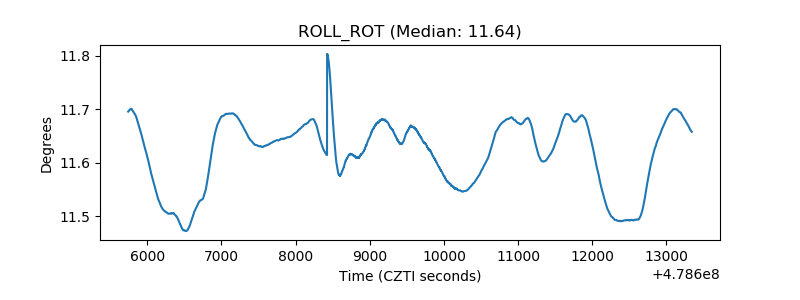 |
| _Roll_DEC | 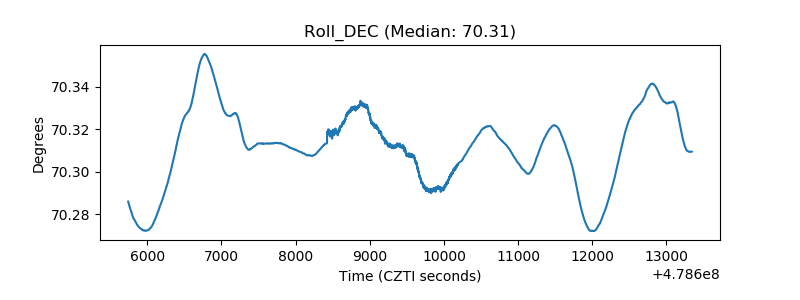 |
| _Roll_RA | 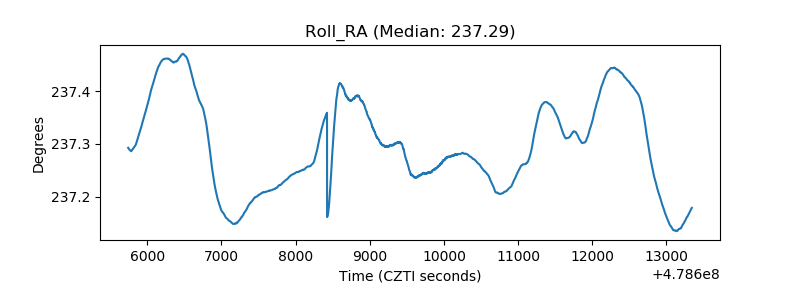 |
| Veto Counter | 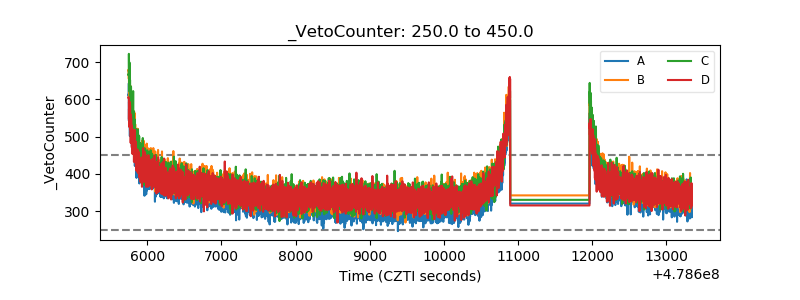 |