| Param | Original file | Final file |
|---|---|---|
| Filename | modeM0/AS1C07_001T02_9000006452_50989cztM0_level2.fits | modeM0/AS1C07_001T02_9000006452_50989cztM0_level2_quad_clean.evt |
| Size (bytes) | 555,678,720 | 100,860,480 |
| Size | 529.9 MB | 96.2 MB |
| Events in quadrant A | 4,837,625 | 653,259 |
| Events in quadrant B | 4,042,716 | 708,596 |
| Events in quadrant C | 4,281,420 | 626,566 |
| Events in quadrant D | 6,857,970 | 571,907 |
| Mode SS | |||
|---|---|---|---|
| Quadrant | BADHDUFLAG | Total packets | Discarded packets |
| A | 0 | 144 | 0 |
| B | 0 | 144 | 0 |
| C | 0 | 144 | 0 |
| D | 0 | 144 | 0 |
| Mode M9 | |||
|---|---|---|---|
| Quadrant | BADHDUFLAG | Total packets | Discarded packets |
| A | 0 | 8 | 0 |
| B | 0 | 9 | 0 |
| C | 0 | 9 | 0 |
| D | 0 | 9 | 0 |
| Mode M0 | |||
|---|---|---|---|
| Quadrant | BADHDUFLAG | Total packets | Discarded packets |
| A | 0 | 19095 | 2 |
| B | 0 | 17015 | 2 |
| C | 0 | 17831 | 2 |
| D | 0 | 25351 | 2 |
| Quadrant | Total seconds | Saturated seconds | Saturation percentage |
|---|---|---|---|
| A | 7086 | 310 | 4.374824% |
| B | 7086 | 309 | 4.360711% |
| C | 7086 | 322 | 4.544172% |
| D | 7086 | 515 | 7.267852% |
Noise dominated data is calculated using 1-second bins in cleaned event files. If a bin has >2000 counts, and if more than 50% of those come from <1% of pixels, then it is considered to be noise-dominated and hence unusable.
| Quadrant | # 1 sec bins | Bins with >0 counts | Bins with >2000 counts | High rate bins dominated by noise | Noise dominated (total time) | Noise dominated (detector-on time) | Marked lightcurve |
|---|---|---|---|---|---|---|---|
| A | 7936 | 7086 | 153 | 153 | 1.93% | 2.16% | 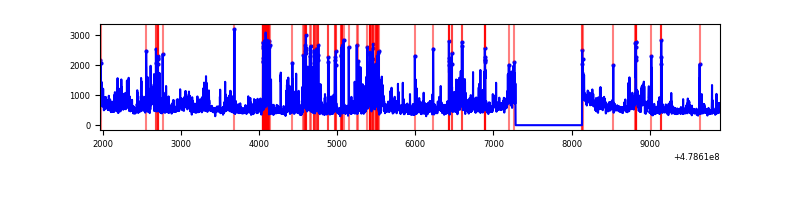 |
| B | 7936 | 7086 | 140 | 140 | 1.76% | 1.98% | 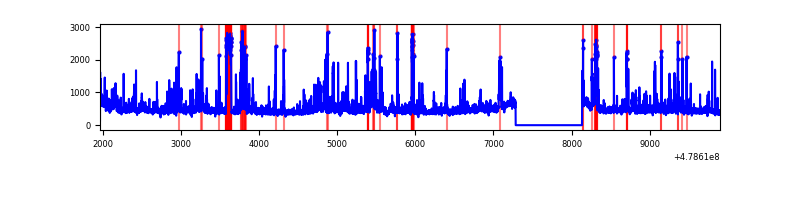 |
| C | 7936 | 7086 | 193 | 193 | 2.43% | 2.72% | 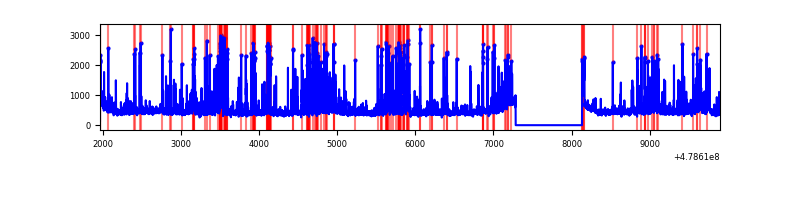 |
| D | 7936 | 7086 | 452 | 452 | 5.70% | 6.38% | 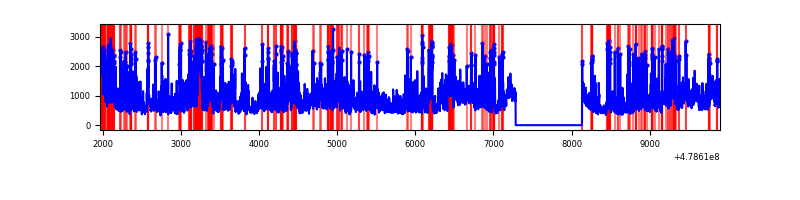 |
Top three noisy pixels from each quadrant. If the there are fewer than three noisy pixels in the level2.evt file, extra rows are filled as -1
| Pixel properties | Quadrant properties | ||||||
|---|---|---|---|---|---|---|---|
| Quadrant | DetID | PixID | Counts | Sigma | Mean | Median | Sigma |
| A | 12 | 3 | 667709 | 3626.92 | 746 | 728 | 183.9 |
| A | 3 | 130 | 189547 | 1026.76 | 746 | 728 | 183.9 |
| A | 4 | 3 | 151667 | 820.78 | 746 | 728 | 183.9 |
| B | 12 | 32 | 242736 | 1537.7 | 741 | 716 | 157.4 |
| B | 4 | 81 | 191632 | 1213.0 | 741 | 716 | 157.4 |
| B | 7 | 252 | 114987 | 726.03 | 741 | 716 | 157.4 |
| C | 1 | 44 | 840425 | 4311.11 | 719 | 715 | 194.8 |
| C | 13 | 3 | 71831 | 365.11 | 719 | 715 | 194.8 |
| C | 15 | 193 | 69970 | 355.56 | 719 | 715 | 194.8 |
| D | 8 | 176 | 1209087 | 6137.67 | 710 | 685 | 196.9 |
| D | 10 | 181 | 800980 | 4064.83 | 710 | 685 | 196.9 |
| D | 7 | 39 | 587183 | 2978.92 | 710 | 685 | 196.9 |
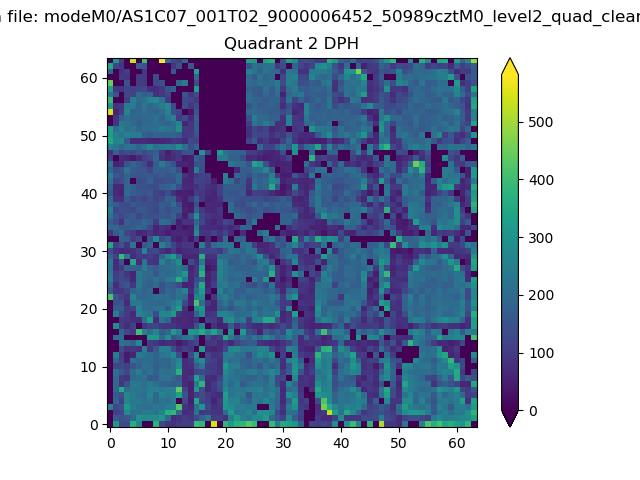
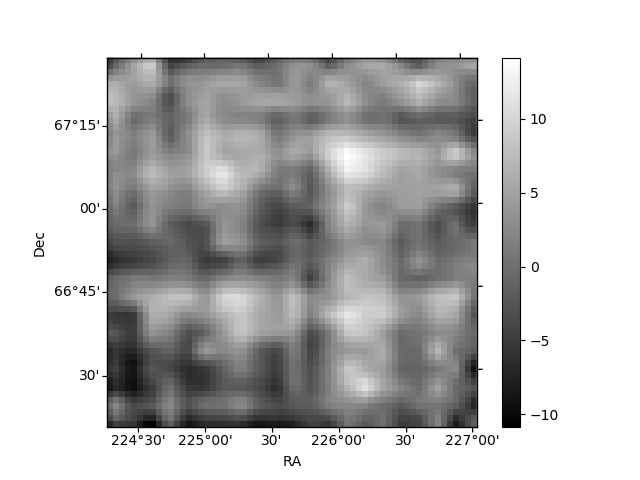
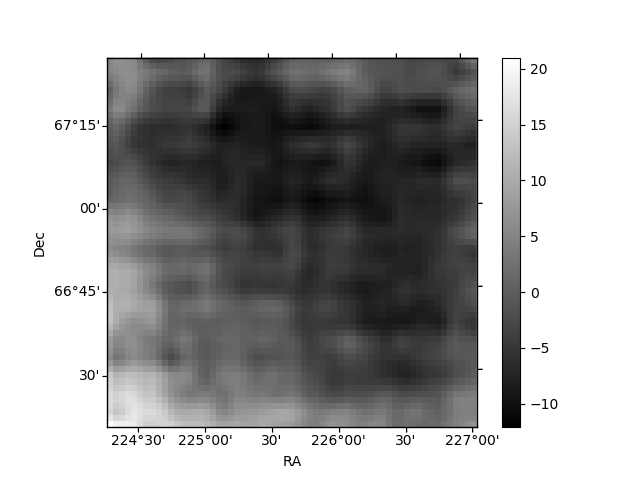
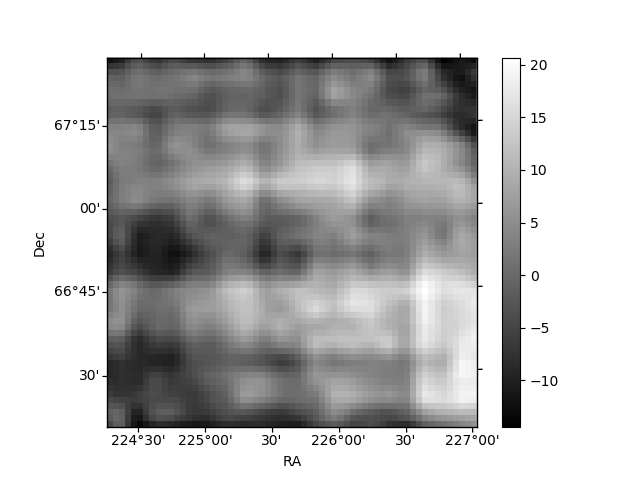
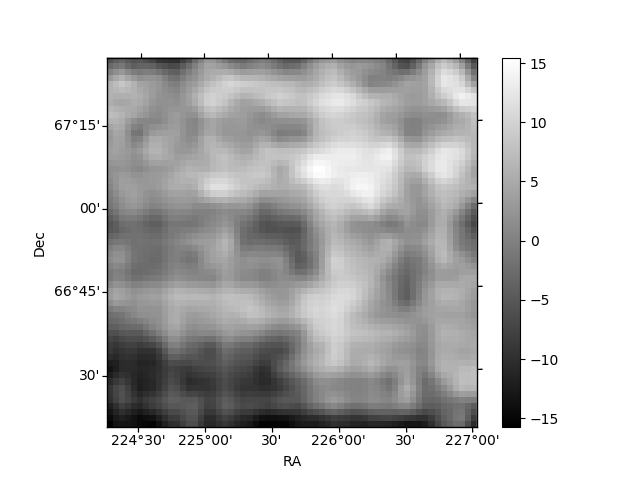
Histogram calculated using DETX and DETY for each event in the final _common_clean file
| Quadrant A | 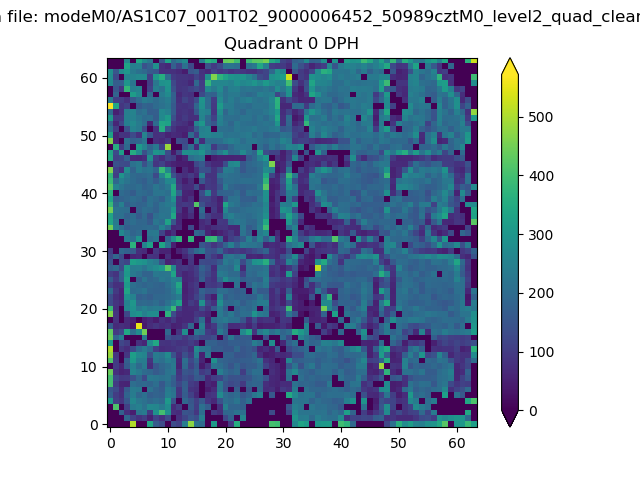 |
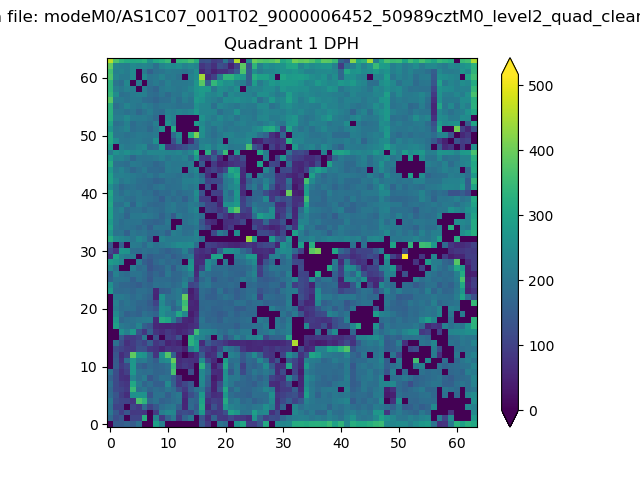 |
Quadrant B |
|---|---|---|---|
| Quadrant D | 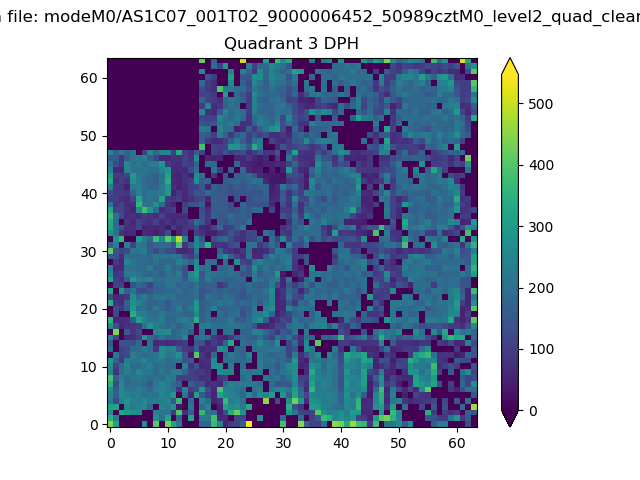 |
 |
Quadrant C |
| Plot type | Count rate plots | Images |
|---|---|---|
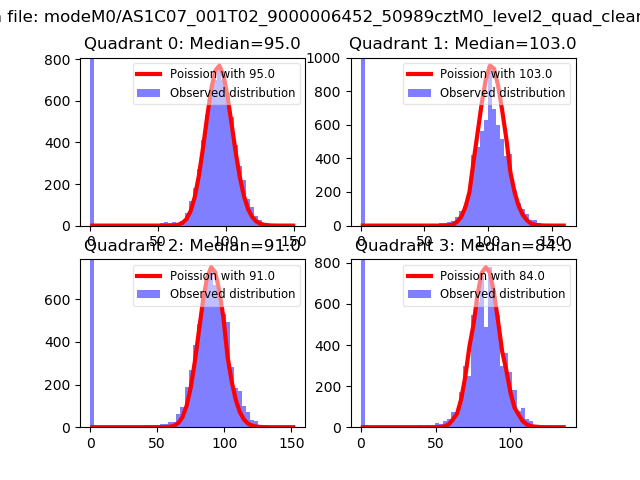
| Comparison with Poisson distribution Blue bars denote a histogram of data divided into 1 sec bins. Red curve is a Poisson curve with rate = median count rate of data. |
 |
 |
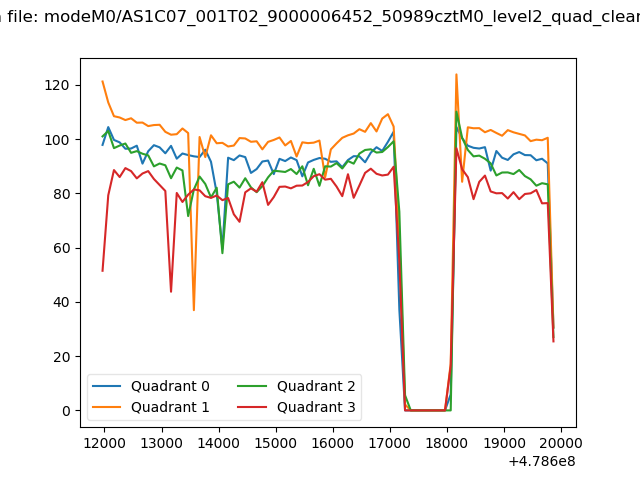
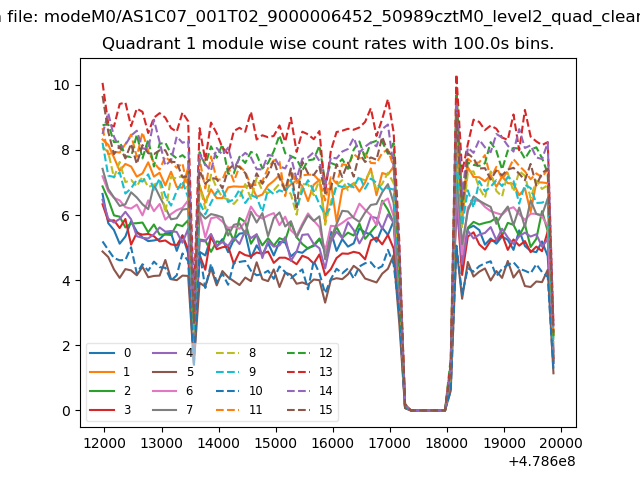
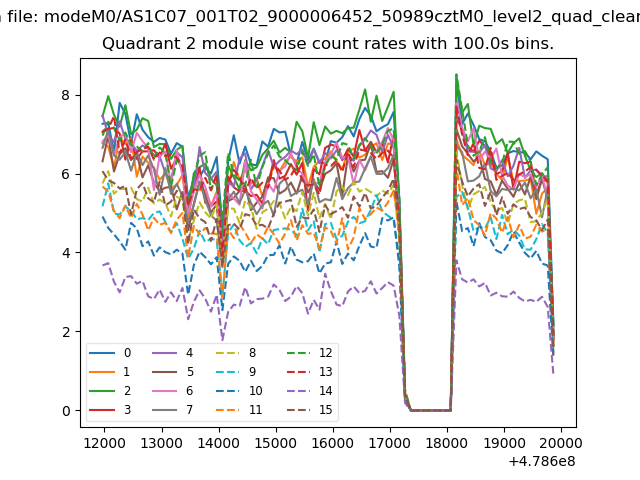
| Quadrant-wise count rates Data is divided into 100 sec bins |
 |
|
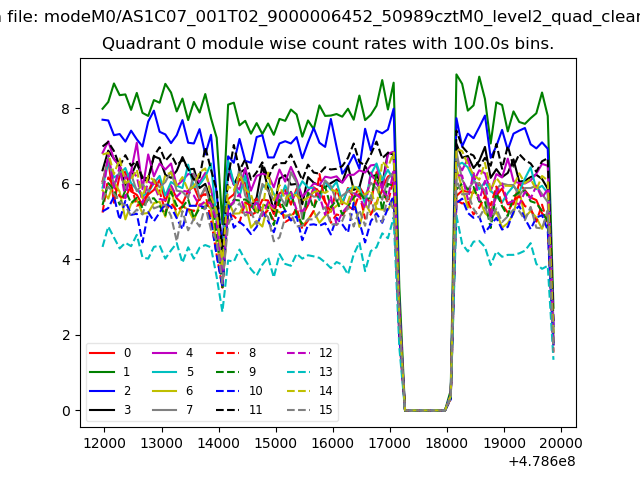
| Module-wise count rates for Quadrant A Data is divided into 100 sec bins |
 |
 |
| Module-wise count rates for Quadrant B Data is divided into 100 sec bins |
 |
 |
| Module-wise count rates for Quadrant C Data is divided into 100 sec bins |
 |
 |
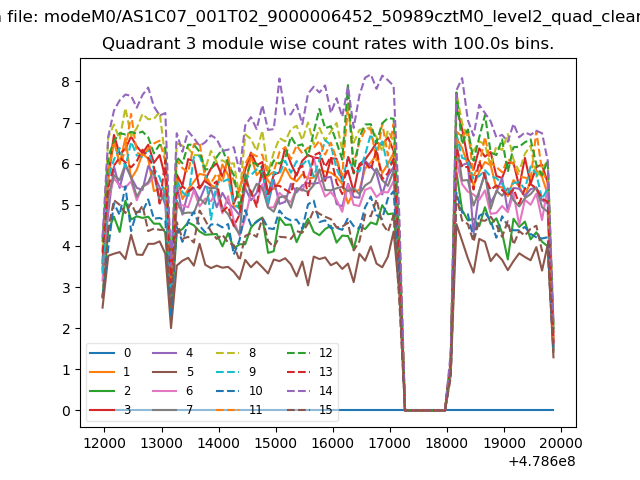
| Module-wise count rates for Quadrant D Data is divided into 100 sec bins |
 |
 |
| Parameter | Plot |
|---|---|
| CZT HV Monitor | 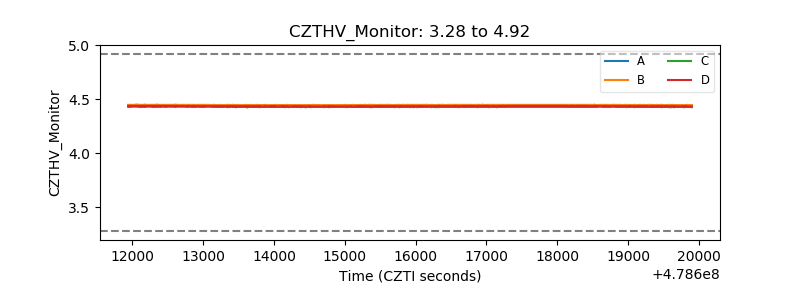 |
| D_VDD | 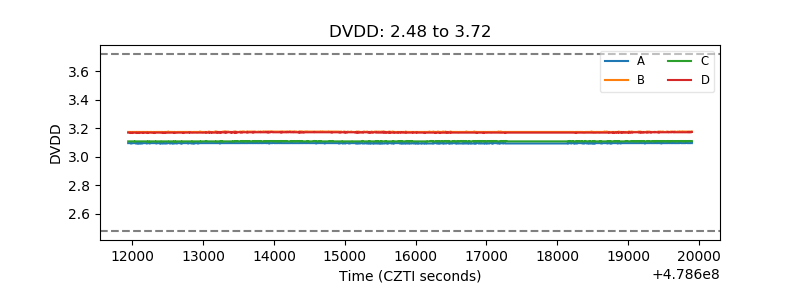 |
| Temperature 1 | 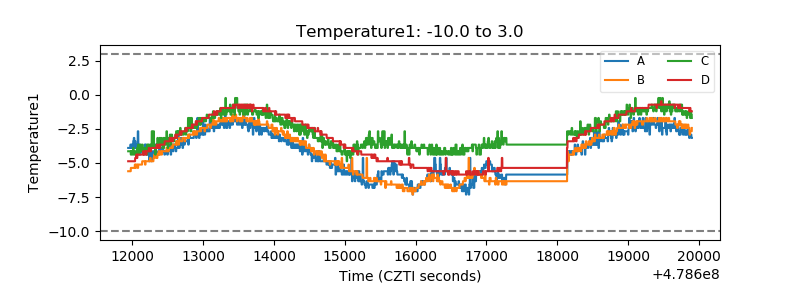 |
| Veto HV Monitor | 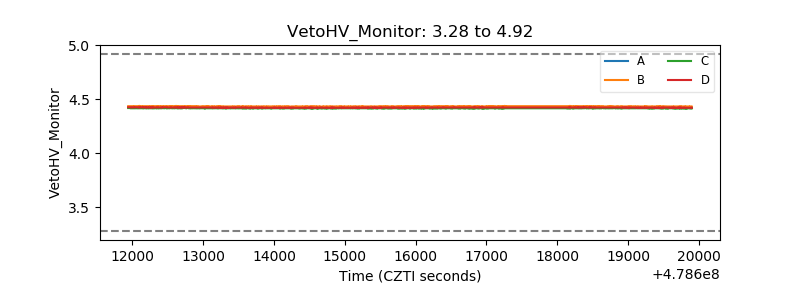 |
| Veto LLD | 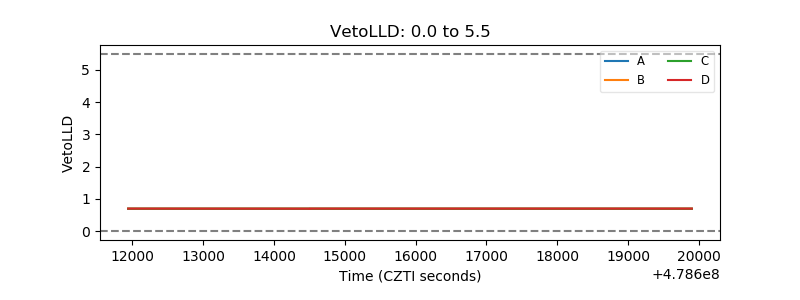 |
| Alpha Counter | 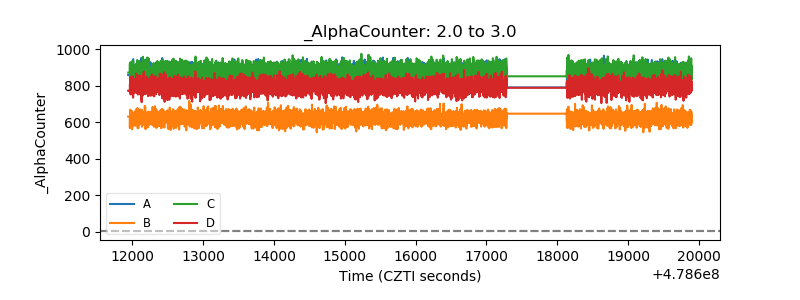 |
| _CPM_Rate | 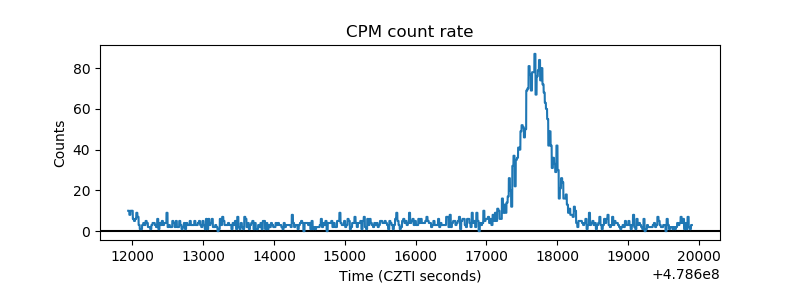 |
| CZT Counter | 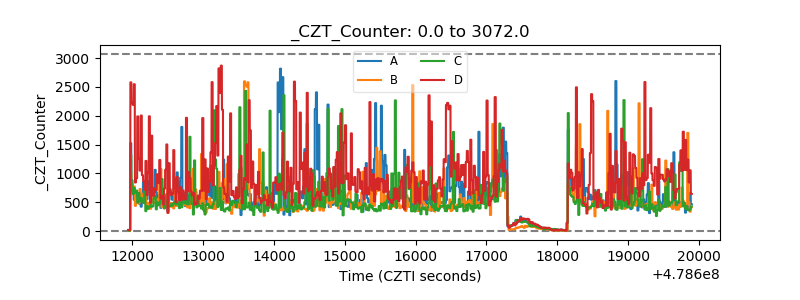 |
| +2.5 Volts monitor | 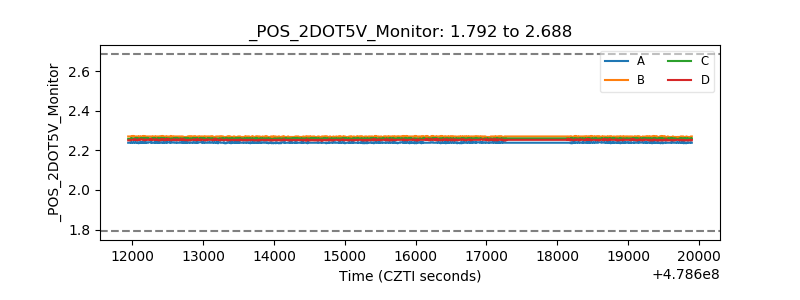 |
| +5 Volts monitor | 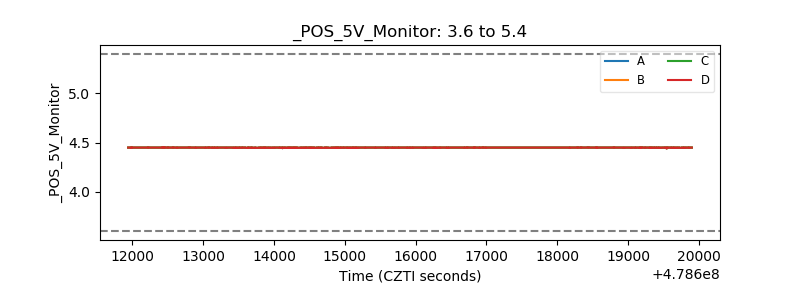 |
| _ROLL_ROT | 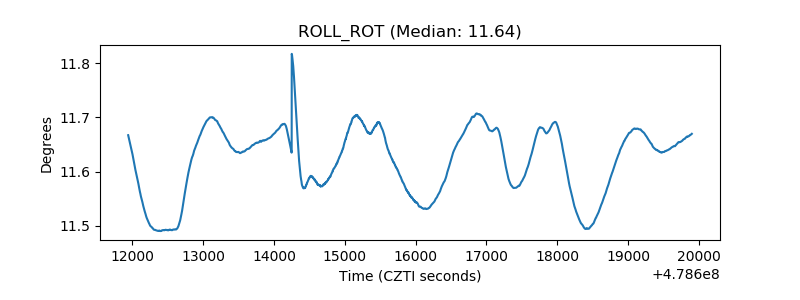 |
| _Roll_DEC | 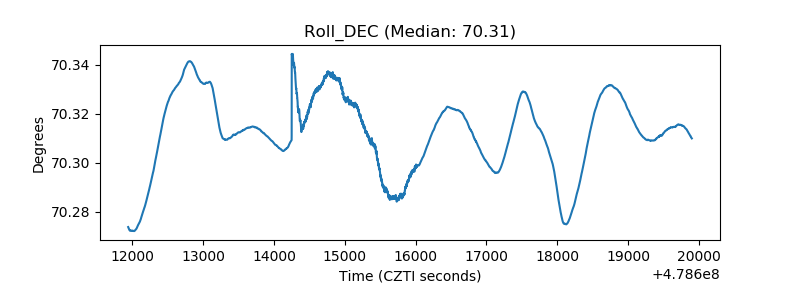 |
| _Roll_RA | 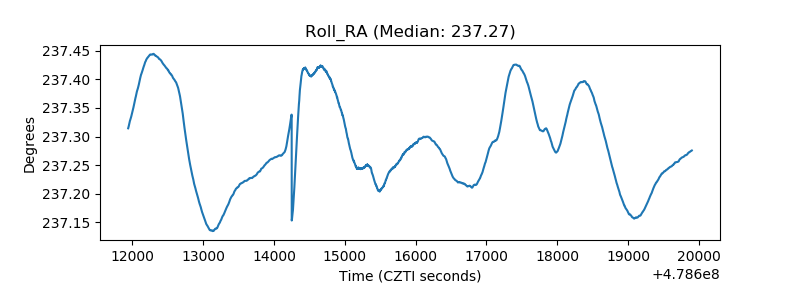 |
| Veto Counter | 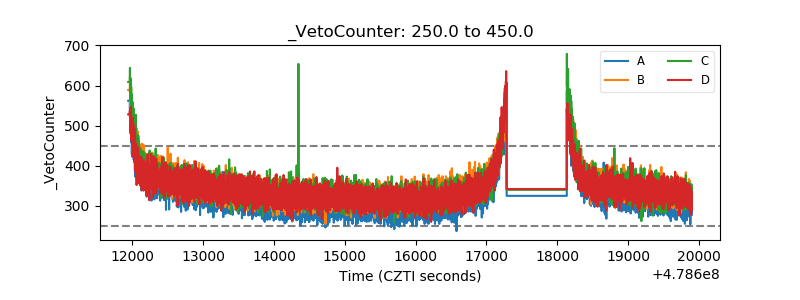 |