| Param | Original file | Final file |
|---|---|---|
| Filename | modeM0/AS1C07_001T02_9000006452_50990cztM0_level2.fits | modeM0/AS1C07_001T02_9000006452_50990cztM0_level2_quad_clean.evt |
| Size (bytes) | 511,608,960 | 94,654,080 |
| Size | 487.9 MB | 90.3 MB |
| Events in quadrant A | 4,135,825 | 616,711 |
| Events in quadrant B | 3,817,778 | 661,862 |
| Events in quadrant C | 4,199,934 | 580,532 |
| Events in quadrant D | 6,263,673 | 538,536 |
| Mode SS | |||
|---|---|---|---|
| Quadrant | BADHDUFLAG | Total packets | Discarded packets |
| A | 0 | 138 | 0 |
| B | 0 | 138 | 0 |
| C | 0 | 138 | 0 |
| D | 0 | 138 | 0 |
| Mode M9 | |||
|---|---|---|---|
| Quadrant | BADHDUFLAG | Total packets | Discarded packets |
| A | 0 | 4 | 0 |
| B | 0 | 4 | 0 |
| C | 0 | 4 | 0 |
| D | 0 | 4 | 0 |
| Mode M0 | |||
|---|---|---|---|
| Quadrant | BADHDUFLAG | Total packets | Discarded packets |
| A | 0 | 16781 | 1 |
| B | 0 | 16180 | 3 |
| C | 0 | 17422 | 1 |
| D | 0 | 23382 | 1 |
| Quadrant | Total seconds | Saturated seconds | Saturation percentage |
|---|---|---|---|
| A | 6714 | 218 | 3.246947% |
| B | 6714 | 273 | 4.066130% |
| C | 6714 | 295 | 4.393804% |
| D | 6714 | 411 | 6.121537% |
Noise dominated data is calculated using 1-second bins in cleaned event files. If a bin has >2000 counts, and if more than 50% of those come from <1% of pixels, then it is considered to be noise-dominated and hence unusable.
| Quadrant | # 1 sec bins | Bins with >0 counts | Bins with >2000 counts | High rate bins dominated by noise | Noise dominated (total time) | Noise dominated (detector-on time) | Marked lightcurve |
|---|---|---|---|---|---|---|---|
| A | 7119 | 6714 | 91 | 91 | 1.28% | 1.36% | 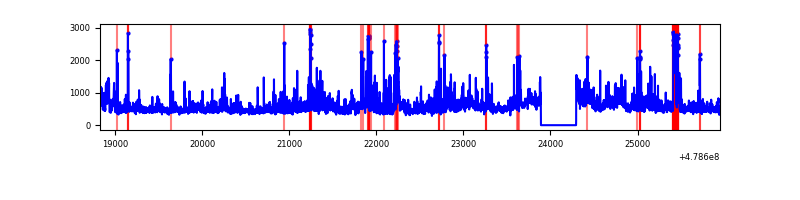 |
| B | 7118 | 6713 | 87 | 87 | 1.22% | 1.30% | 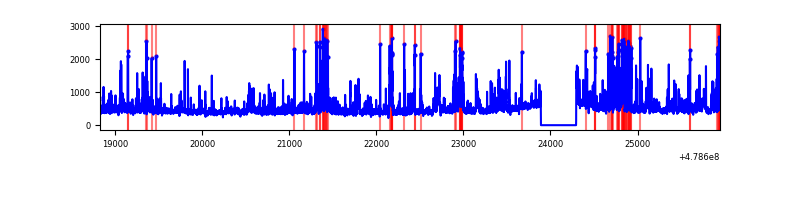 |
| C | 7119 | 6714 | 206 | 206 | 2.89% | 3.07% | 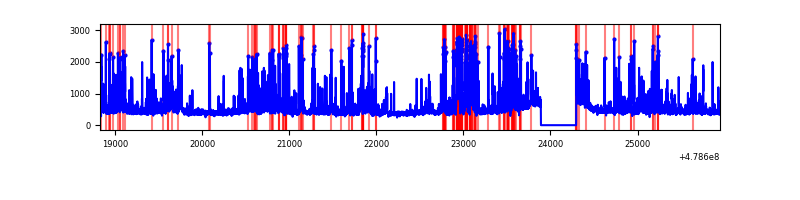 |
| D | 7119 | 6714 | 309 | 309 | 4.34% | 4.60% | 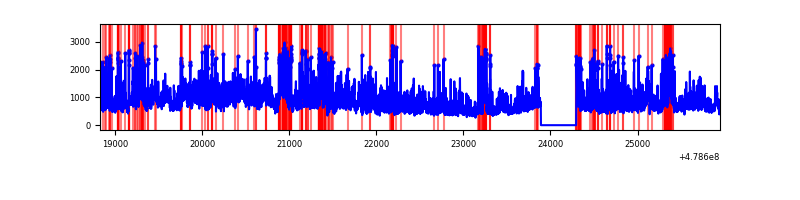 |
Top three noisy pixels from each quadrant. If the there are fewer than three noisy pixels in the level2.evt file, extra rows are filled as -1
| Pixel properties | Quadrant properties | ||||||
|---|---|---|---|---|---|---|---|
| Quadrant | DetID | PixID | Counts | Sigma | Mean | Median | Sigma |
| A | 12 | 3 | 487870 | 2811.0 | 701 | 686 | 173.3 |
| A | 4 | 3 | 151760 | 871.68 | 701 | 686 | 173.3 |
| A | 3 | 130 | 139585 | 801.43 | 701 | 686 | 173.3 |
| B | 12 | 32 | 314187 | 2129.08 | 695 | 671 | 147.3 |
| B | 4 | 81 | 211746 | 1433.4 | 695 | 671 | 147.3 |
| B | 7 | 252 | 101408 | 684.1 | 695 | 671 | 147.3 |
| C | 1 | 44 | 637758 | 3488.32 | 674 | 670 | 182.6 |
| C | 15 | 147 | 253391 | 1383.75 | 674 | 670 | 182.6 |
| C | 13 | 3 | 116197 | 632.56 | 674 | 670 | 182.6 |
| D | 7 | 39 | 1140658 | 6119.64 | 666 | 640 | 186.3 |
| D | 10 | 181 | 738670 | 3961.76 | 666 | 640 | 186.3 |
| D | 2 | 216 | 733425 | 3933.6 | 666 | 640 | 186.3 |
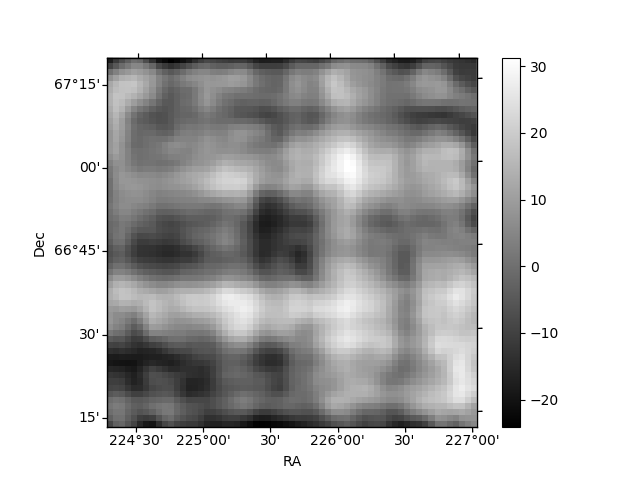
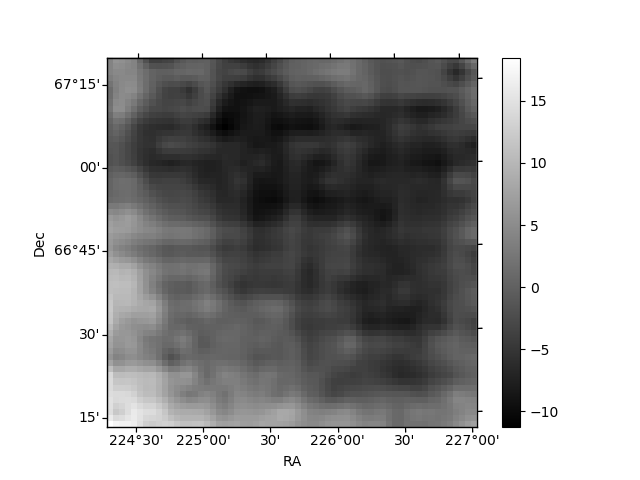
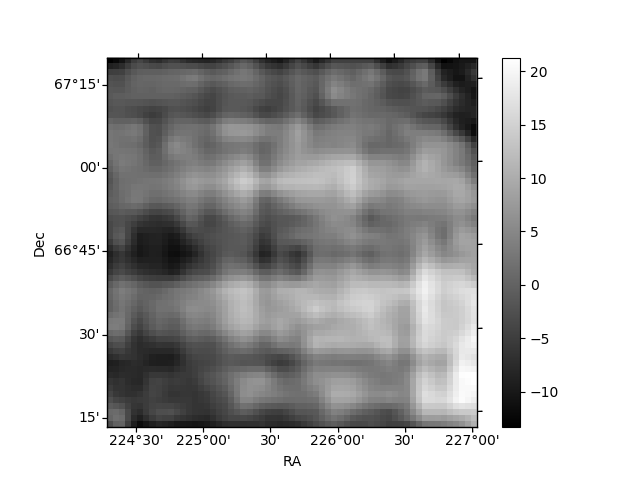
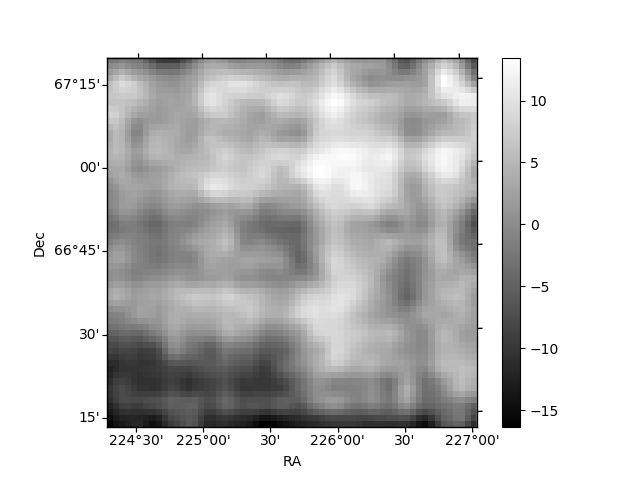
Histogram calculated using DETX and DETY for each event in the final _common_clean file
| Quadrant A | 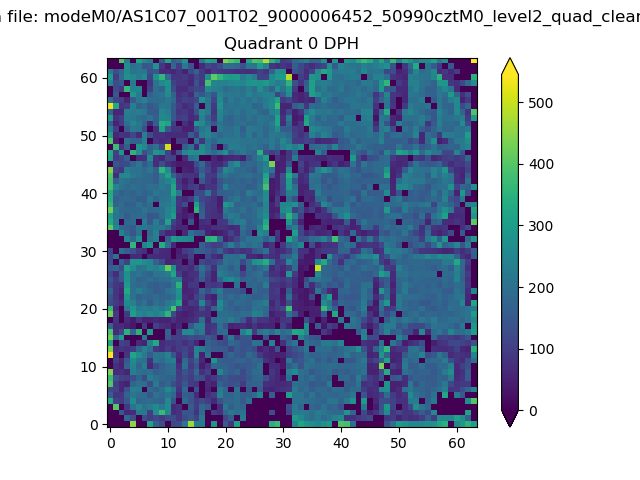 |
 |
Quadrant B |
|---|---|---|---|
| Quadrant D | 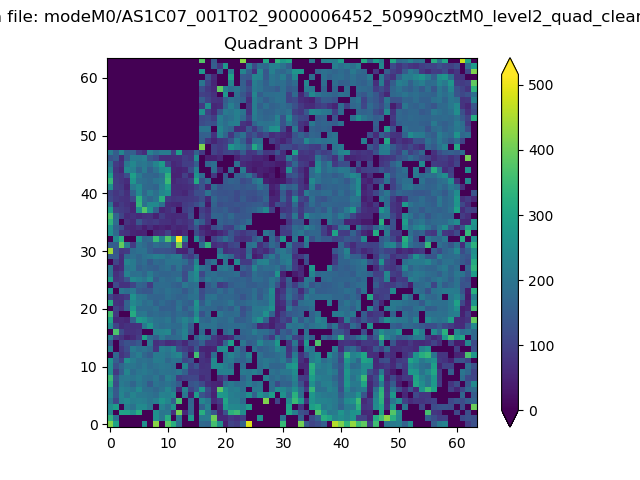 |
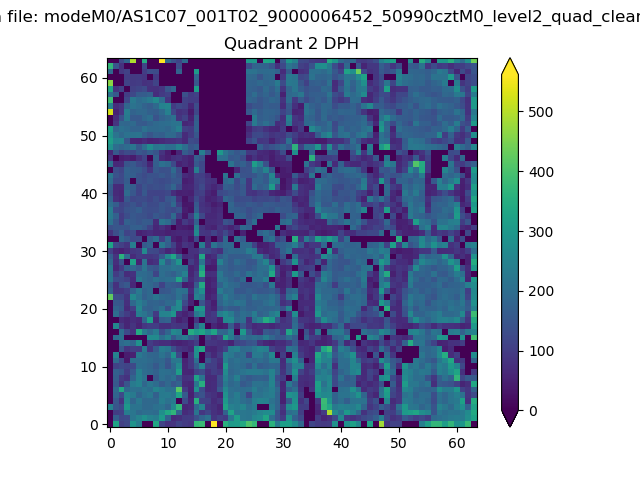 |
Quadrant C |
| Plot type | Count rate plots | Images |
|---|---|---|
| Comparison with Poisson distribution Blue bars denote a histogram of data divided into 1 sec bins. Red curve is a Poisson curve with rate = median count rate of data. |
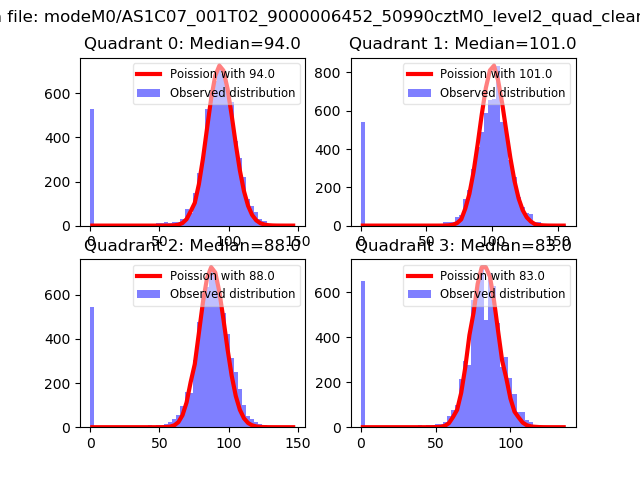 |
 |
| Quadrant-wise count rates Data is divided into 100 sec bins |
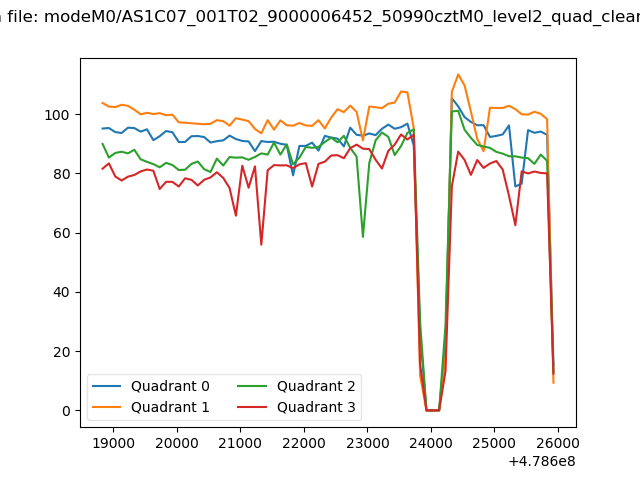 |
|
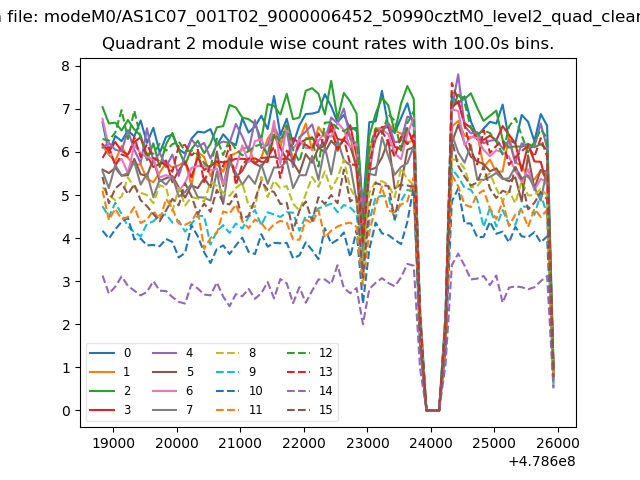
| Module-wise count rates for Quadrant A Data is divided into 100 sec bins |
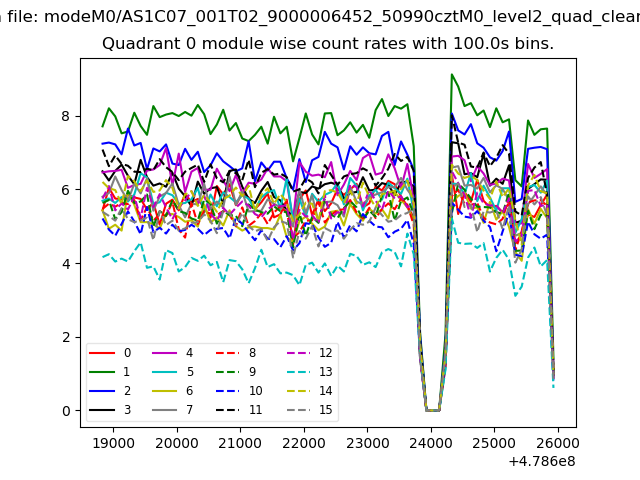 |
 |
| Module-wise count rates for Quadrant B Data is divided into 100 sec bins |
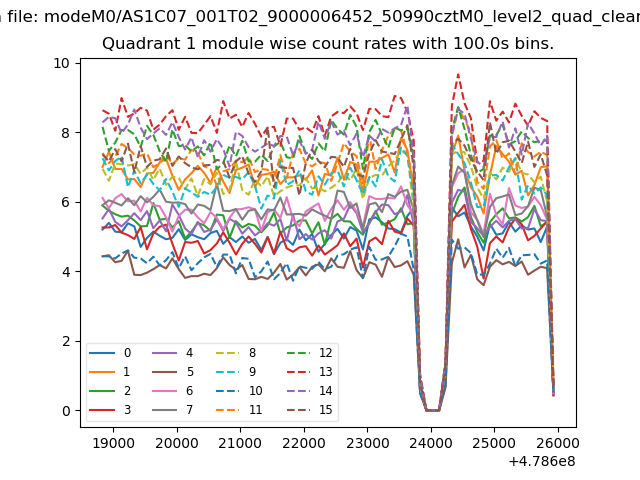 |
 |
| Module-wise count rates for Quadrant C Data is divided into 100 sec bins |
 |
 |
| Module-wise count rates for Quadrant D Data is divided into 100 sec bins |
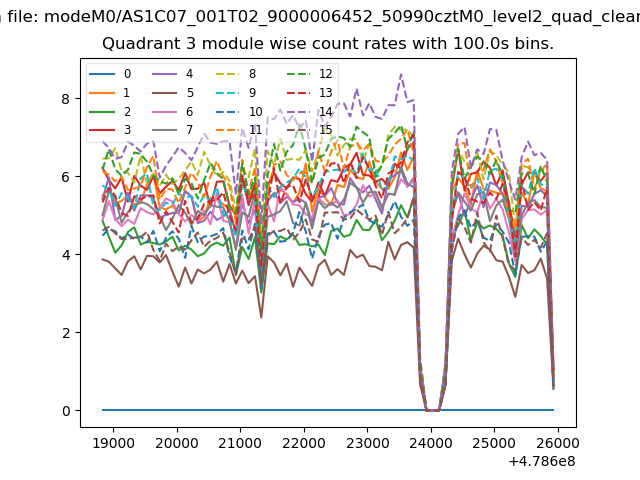 |
 |
| Parameter | Plot |
|---|---|
| CZT HV Monitor | 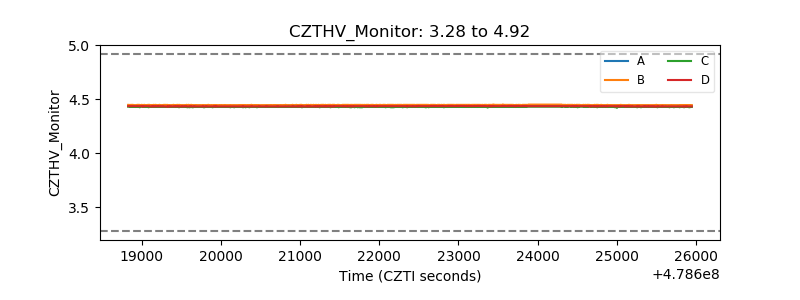 |
| D_VDD | 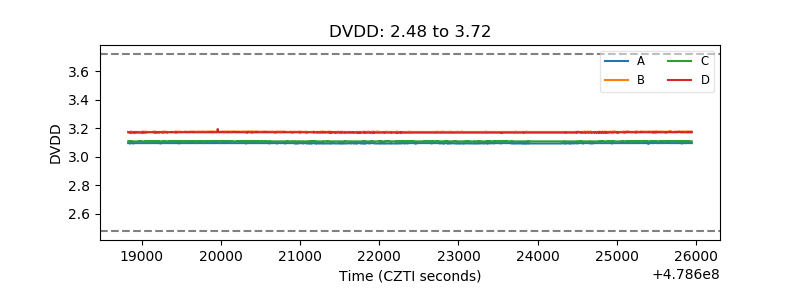 |
| Temperature 1 | 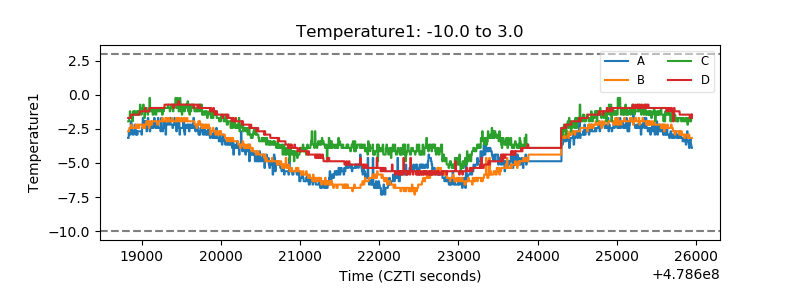 |
| Veto HV Monitor | 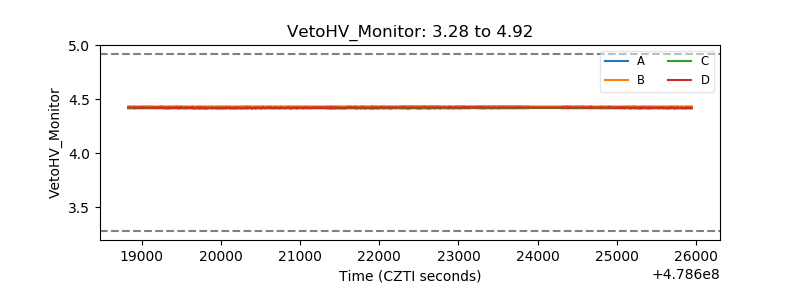 |
| Veto LLD | 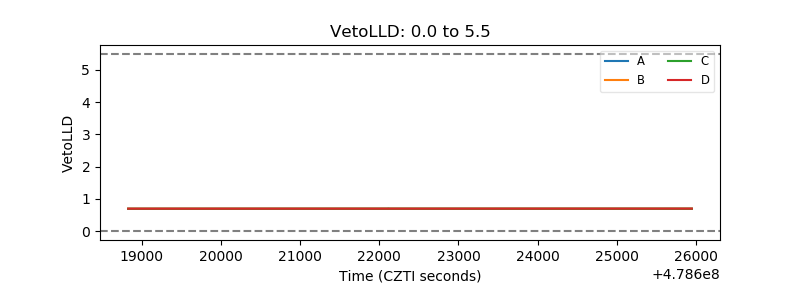 |
| Alpha Counter | 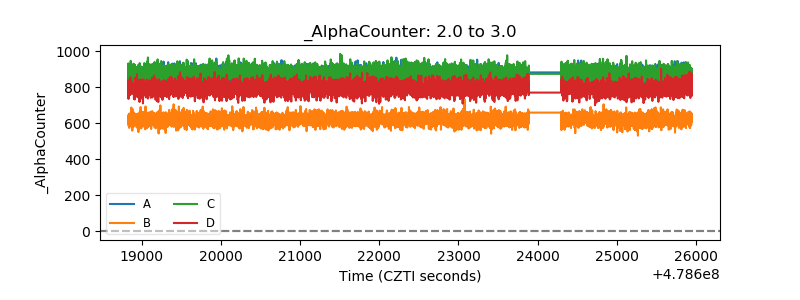 |
| _CPM_Rate | 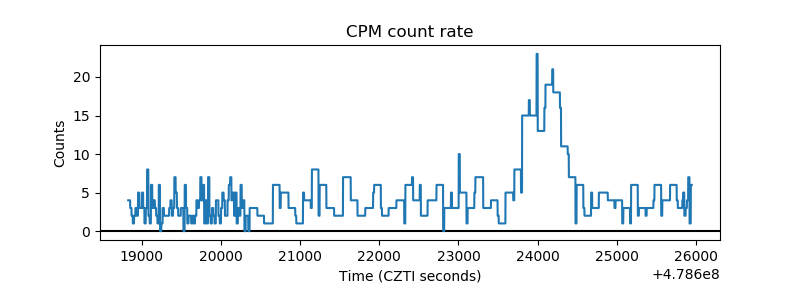 |
| CZT Counter | 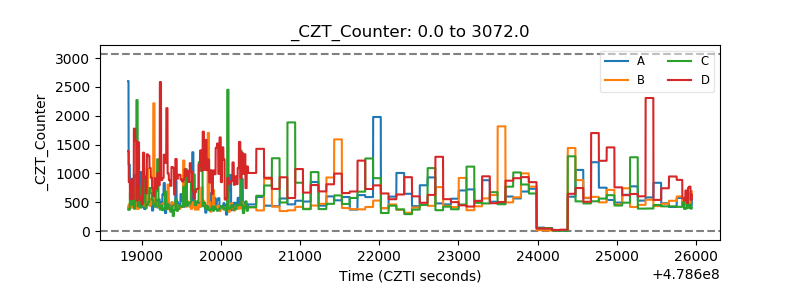 |
| +2.5 Volts monitor | 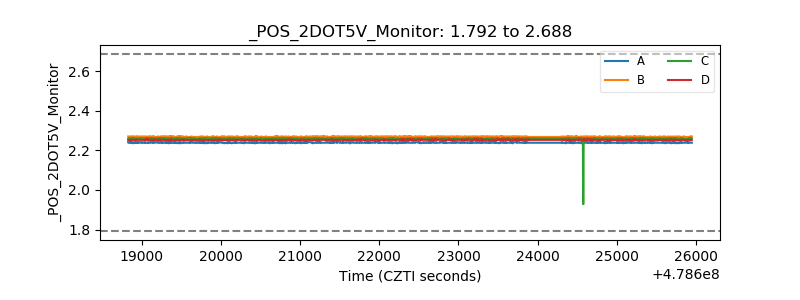 |
| +5 Volts monitor | 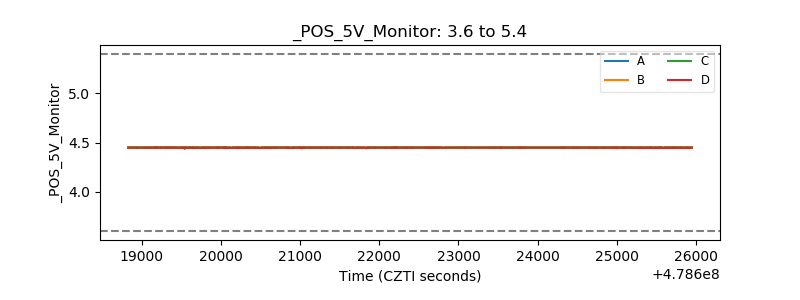 |
| _ROLL_ROT | 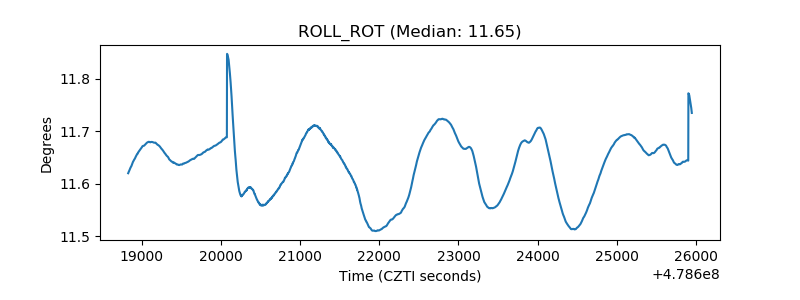 |
| _Roll_DEC | 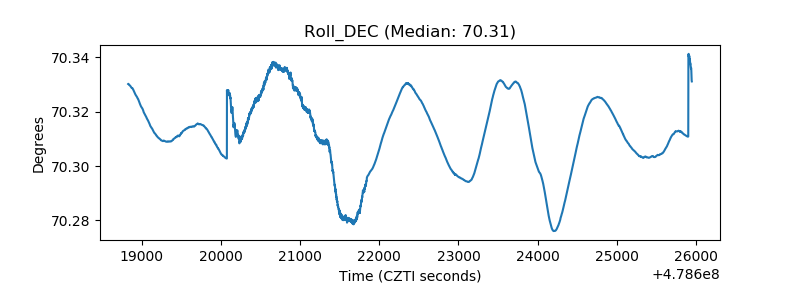 |
| _Roll_RA | 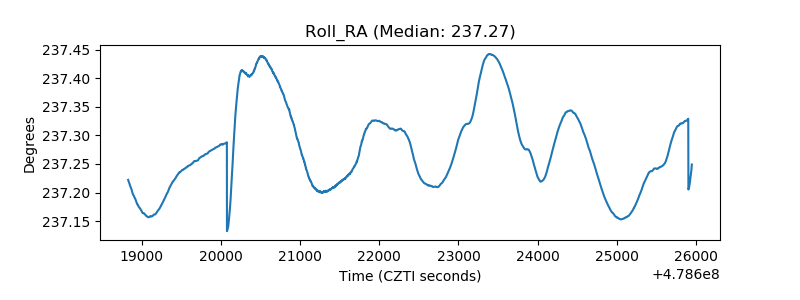 |
| Veto Counter | 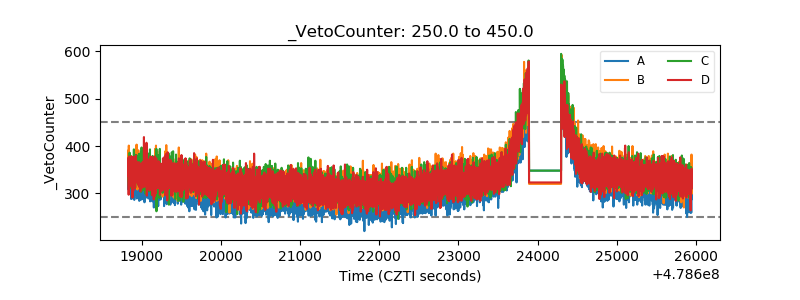 |