| Param | Original file | Final file |
|---|---|---|
| Filename | modeM0/AS1C07_001T02_9000006452_50991cztM0_level2.fits | modeM0/AS1C07_001T02_9000006452_50991cztM0_level2_quad_clean.evt |
| Size (bytes) | 639,037,440 | 99,812,160 |
| Size | 609.4 MB | 95.2 MB |
| Events in quadrant A | 5,305,464 | 650,408 |
| Events in quadrant B | 5,324,024 | 692,992 |
| Events in quadrant C | 5,255,839 | 606,540 |
| Events in quadrant D | 7,211,224 | 569,635 |
| Mode SS | |||
|---|---|---|---|
| Quadrant | BADHDUFLAG | Total packets | Discarded packets |
| A | 0 | 144 | 0 |
| B | 0 | 144 | 0 |
| C | 0 | 144 | 0 |
| D | 0 | 144 | 0 |
| Mode M0 | |||
|---|---|---|---|
| Quadrant | BADHDUFLAG | Total packets | Discarded packets |
| A | 0 | 20649 | 0 |
| B | 0 | 20823 | 1 |
| C | 0 | 20777 | 0 |
| D | 0 | 26553 | 0 |
| Quadrant | Total seconds | Saturated seconds | Saturation percentage |
|---|---|---|---|
| A | 7216 | 398 | 5.515521% |
| B | 7215 | 450 | 6.237006% |
| C | 7215 | 503 | 6.971587% |
| D | 7216 | 568 | 7.871397% |
Noise dominated data is calculated using 1-second bins in cleaned event files. If a bin has >2000 counts, and if more than 50% of those come from <1% of pixels, then it is considered to be noise-dominated and hence unusable.
| Quadrant | # 1 sec bins | Bins with >0 counts | Bins with >2000 counts | High rate bins dominated by noise | Noise dominated (total time) | Noise dominated (detector-on time) | Marked lightcurve |
|---|---|---|---|---|---|---|---|
| A | 7216 | 7216 | 292 | 292 | 4.05% | 4.05% | 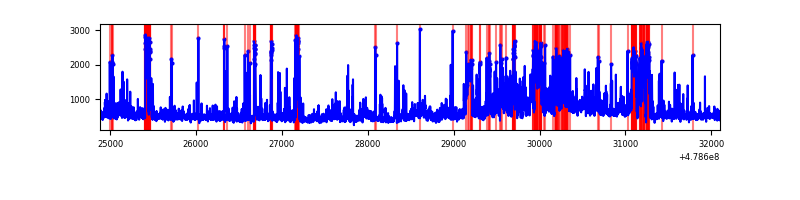 |
| B | 7215 | 7215 | 266 | 266 | 3.69% | 3.69% | 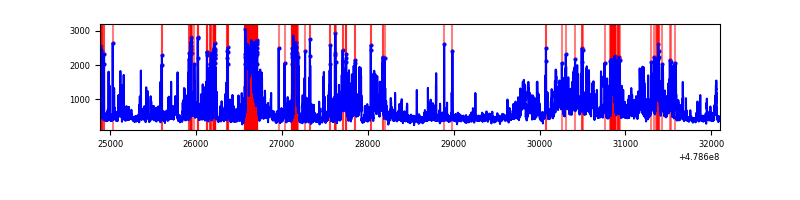 |
| C | 7215 | 7215 | 441 | 441 | 6.11% | 6.11% | 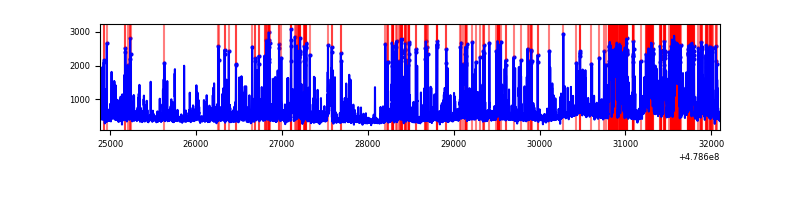 |
| D | 7215 | 7215 | 486 | 486 | 6.74% | 6.74% | 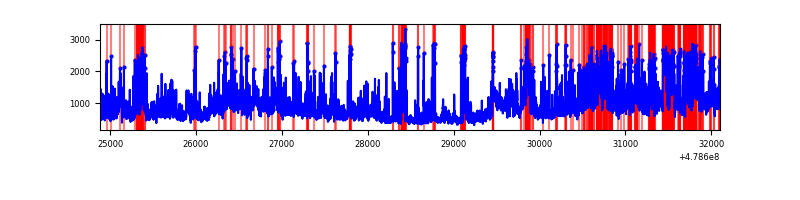 |
Top three noisy pixels from each quadrant. If the there are fewer than three noisy pixels in the level2.evt file, extra rows are filled as -1
| Pixel properties | Quadrant properties | ||||||
|---|---|---|---|---|---|---|---|
| Quadrant | DetID | PixID | Counts | Sigma | Mean | Median | Sigma |
| A | 12 | 80 | 561360 | 3057.86 | 740 | 722 | 183.3 |
| A | 12 | 3 | 380602 | 2071.96 | 740 | 722 | 183.3 |
| A | 8 | 43 | 343915 | 1871.86 | 740 | 722 | 183.3 |
| B | 4 | 81 | 1290352 | 8318.58 | 732 | 707 | 155.0 |
| B | 12 | 32 | 367126 | 2363.51 | 732 | 707 | 155.0 |
| B | 12 | 3 | 187142 | 1202.56 | 732 | 707 | 155.0 |
| C | 1 | 44 | 657301 | 3347.91 | 710 | 704 | 196.1 |
| C | 15 | 224 | 309822 | 1576.16 | 710 | 704 | 196.1 |
| C | 13 | 3 | 253278 | 1287.85 | 710 | 704 | 196.1 |
| D | 7 | 39 | 1512320 | 7637.14 | 708 | 684 | 197.9 |
| D | 10 | 181 | 830581 | 4192.83 | 708 | 684 | 197.9 |
| D | 12 | 191 | 679805 | 3431.08 | 708 | 684 | 197.9 |
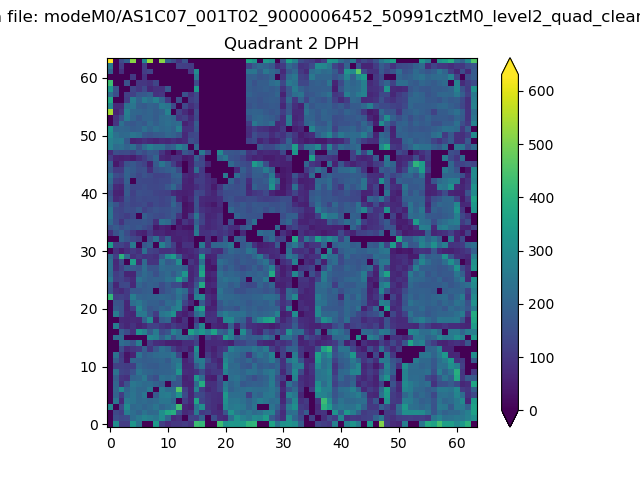
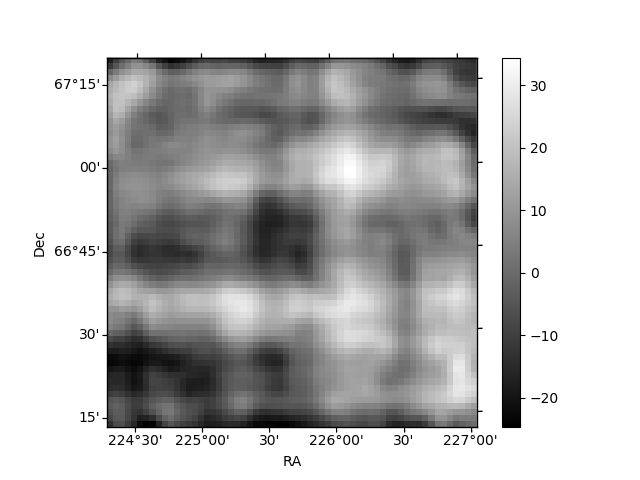
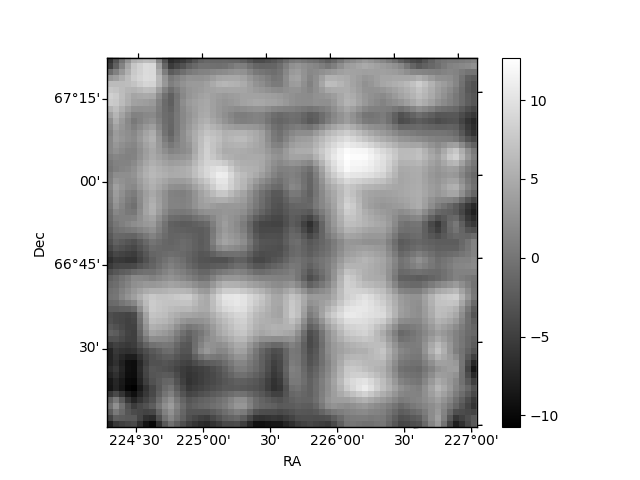
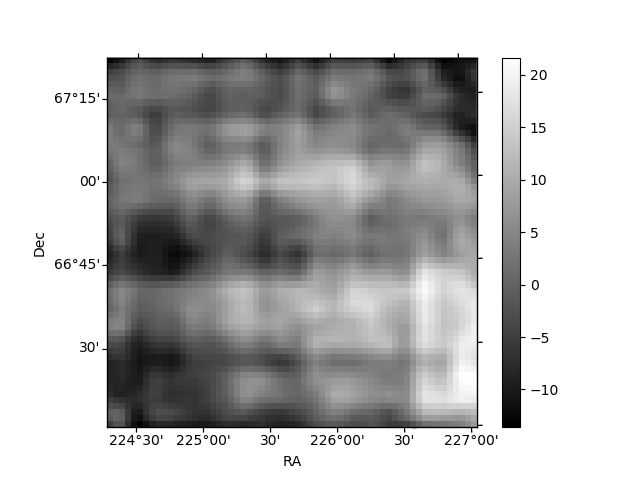
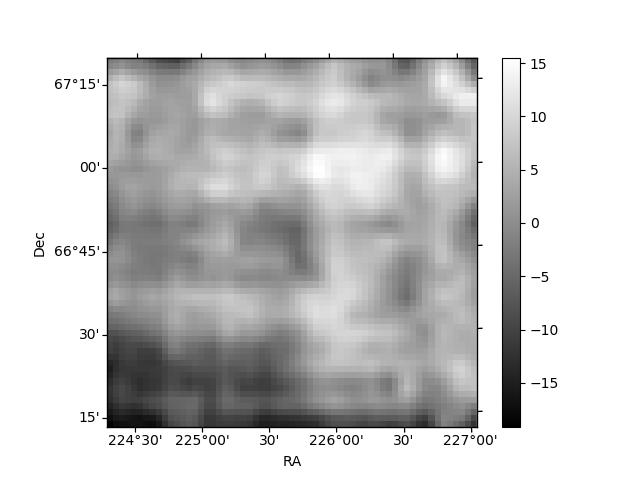
Histogram calculated using DETX and DETY for each event in the final _common_clean file
| Quadrant A | 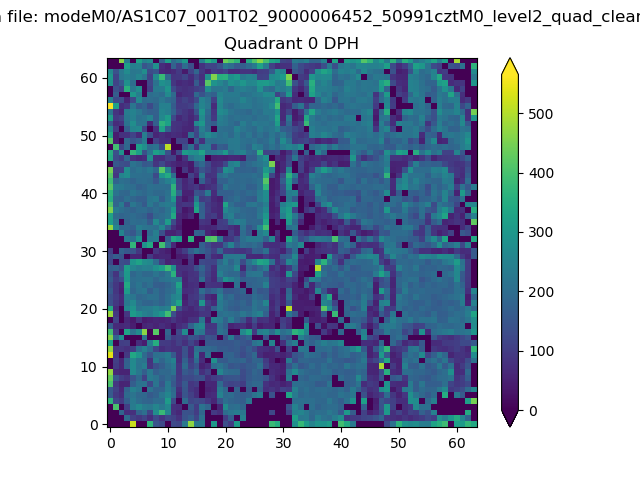 |
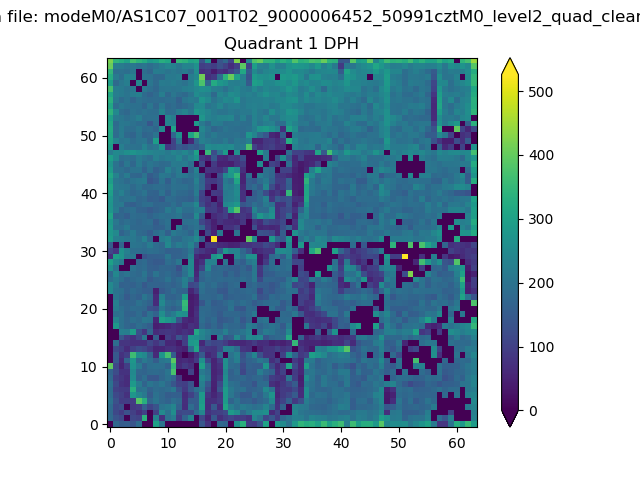 |
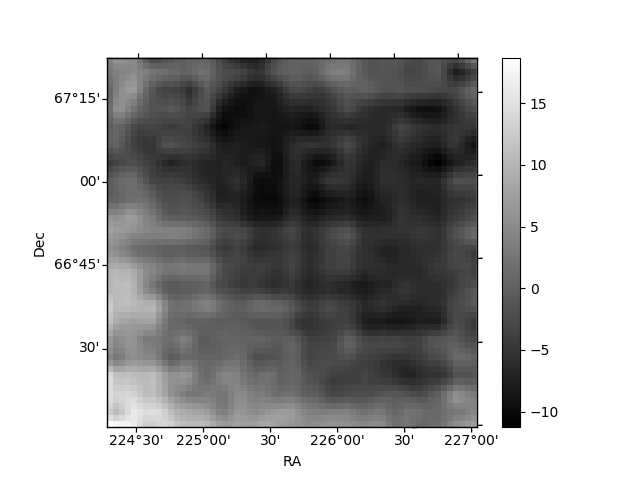
Quadrant B |
|---|---|---|---|
| Quadrant D | 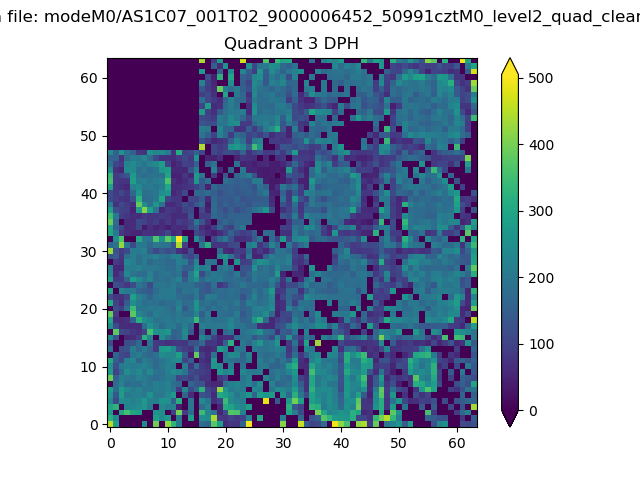 |
 |
Quadrant C |
| Plot type | Count rate plots | Images |
|---|---|---|
| Comparison with Poisson distribution Blue bars denote a histogram of data divided into 1 sec bins. Red curve is a Poisson curve with rate = median count rate of data. |
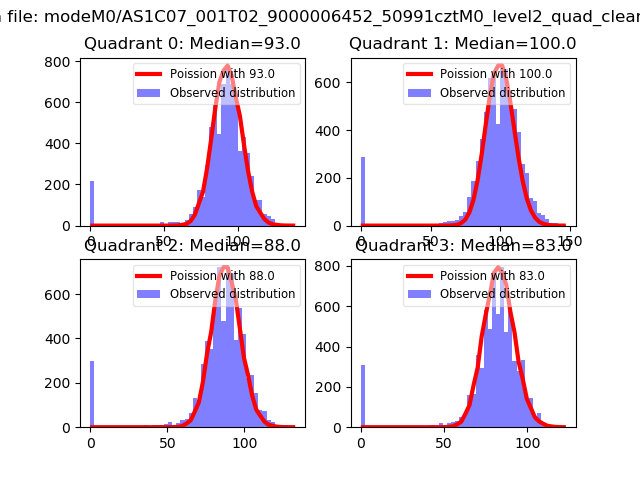 |
 |
| Quadrant-wise count rates Data is divided into 100 sec bins |
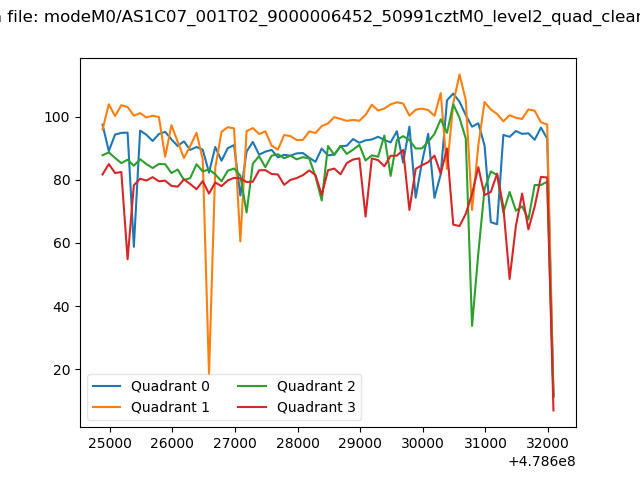 |
|
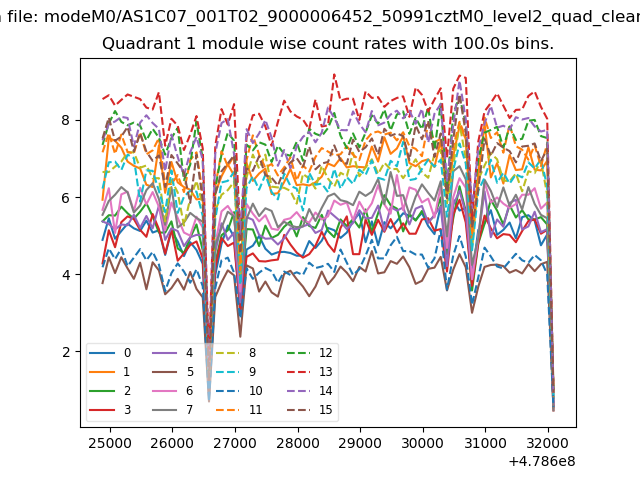
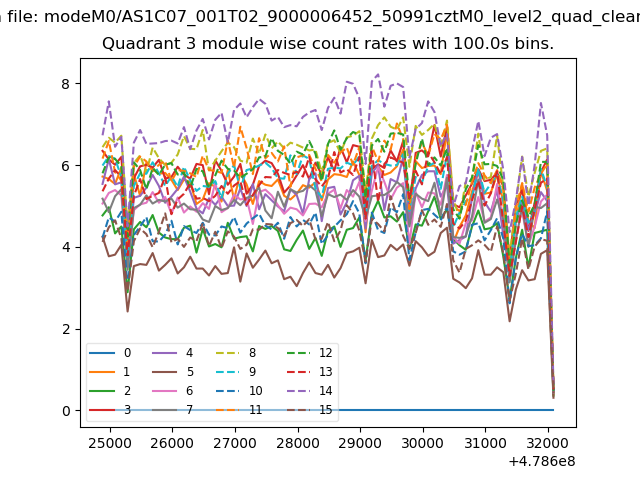
| Module-wise count rates for Quadrant A Data is divided into 100 sec bins |
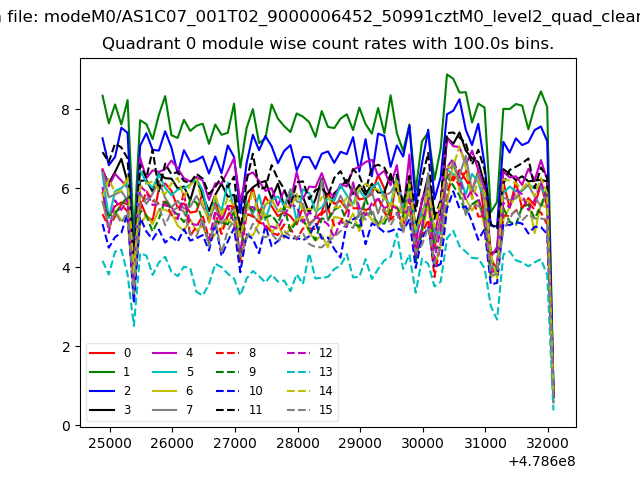 |
 |
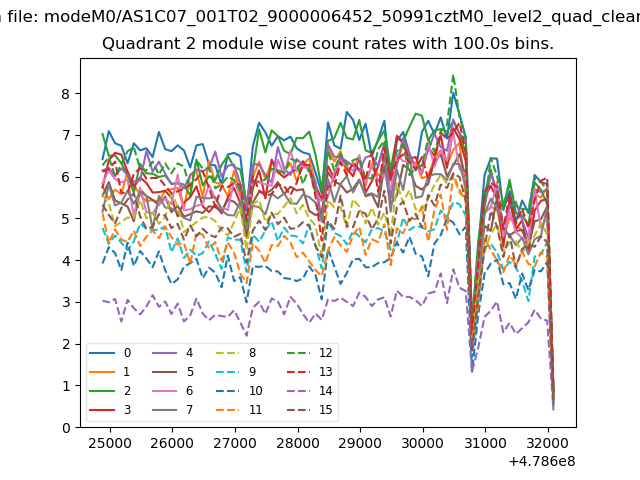
| Module-wise count rates for Quadrant B Data is divided into 100 sec bins |
 |
 |
| Module-wise count rates for Quadrant C Data is divided into 100 sec bins |
 |
 |
| Module-wise count rates for Quadrant D Data is divided into 100 sec bins |
 |
 |
| Parameter | Plot |
|---|---|
| CZT HV Monitor | 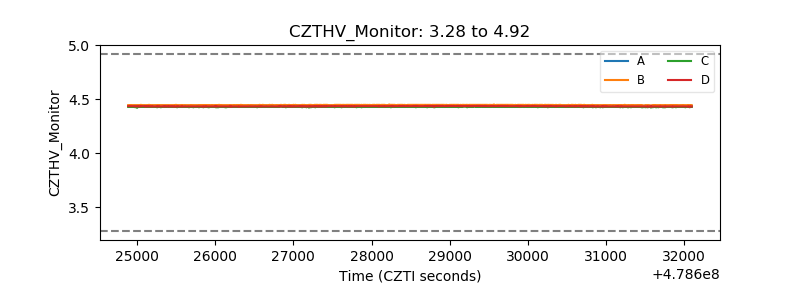 |
| D_VDD | 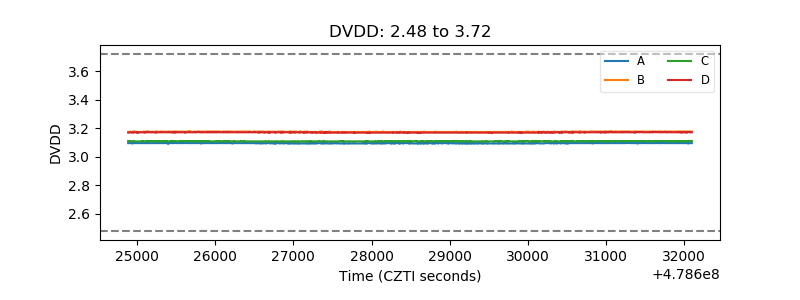 |
| Temperature 1 | 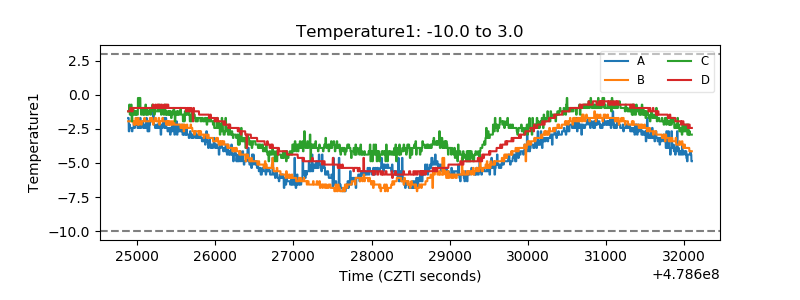 |
| Veto HV Monitor | 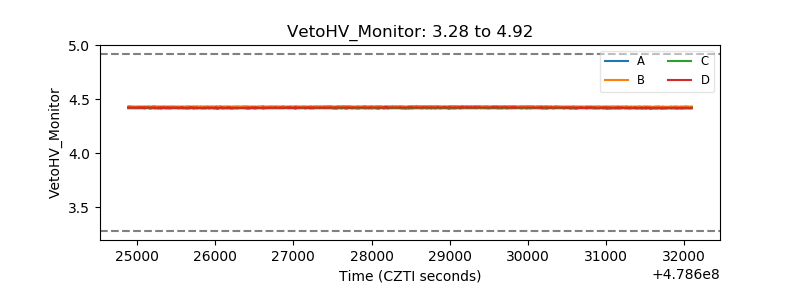 |
| Veto LLD | 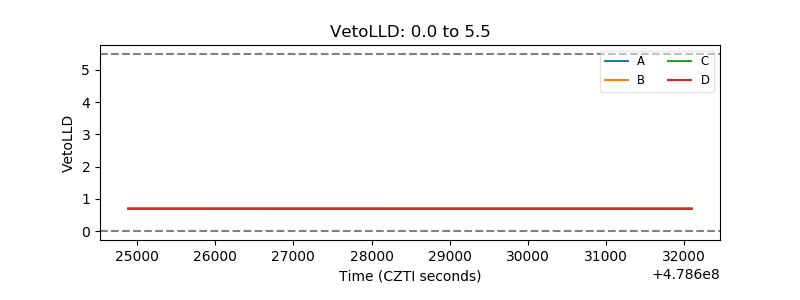 |
| Alpha Counter | 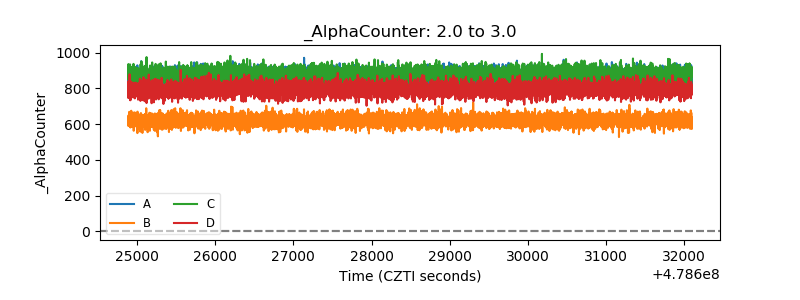 |
| _CPM_Rate | 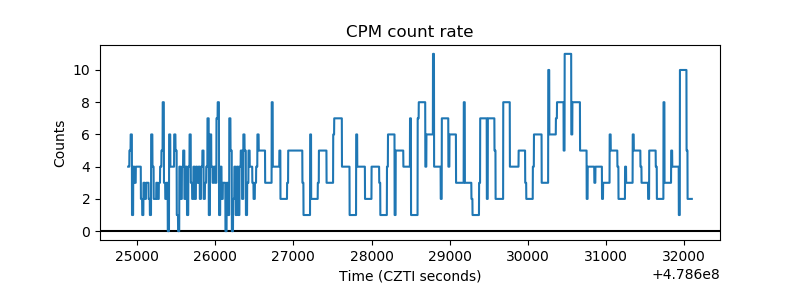 |
| CZT Counter | 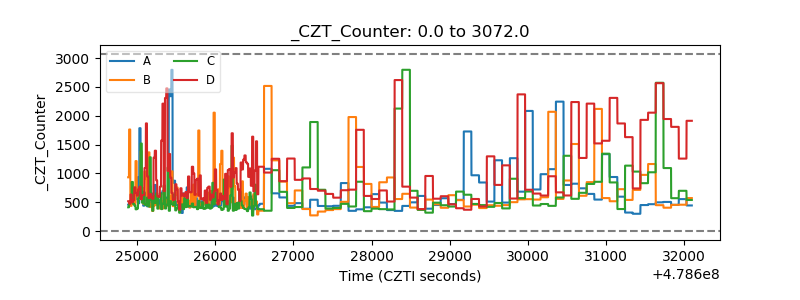 |
| +2.5 Volts monitor | 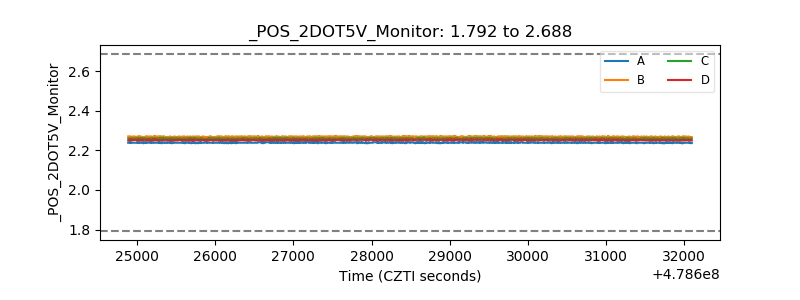 |
| +5 Volts monitor | 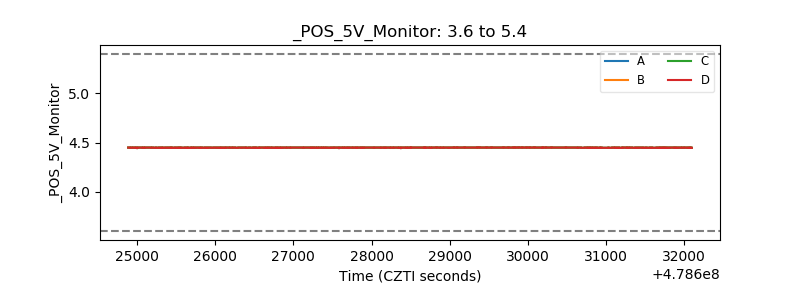 |
| _ROLL_ROT | 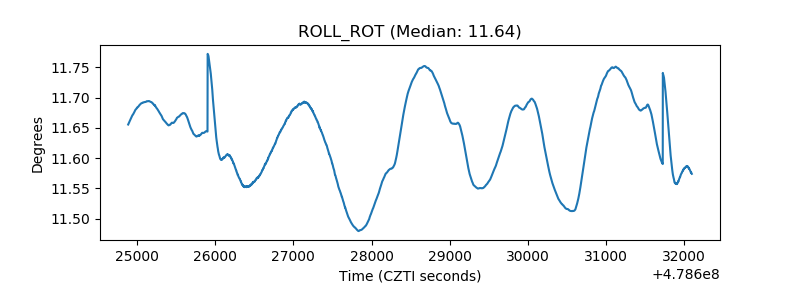 |
| _Roll_DEC | 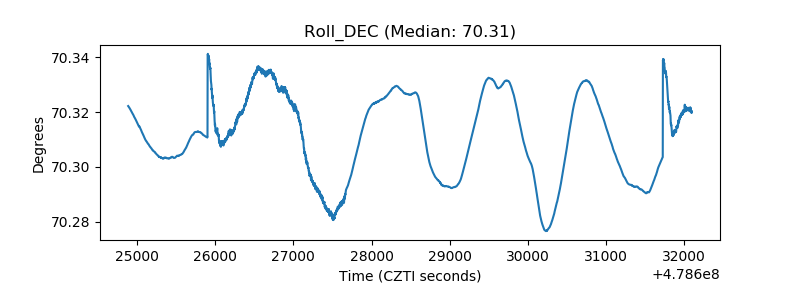 |
| _Roll_RA | 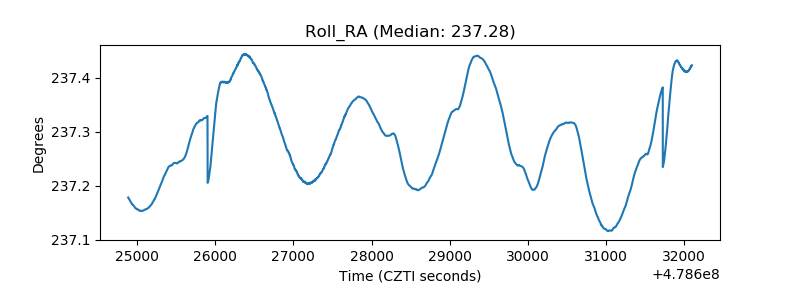 |
| Veto Counter | 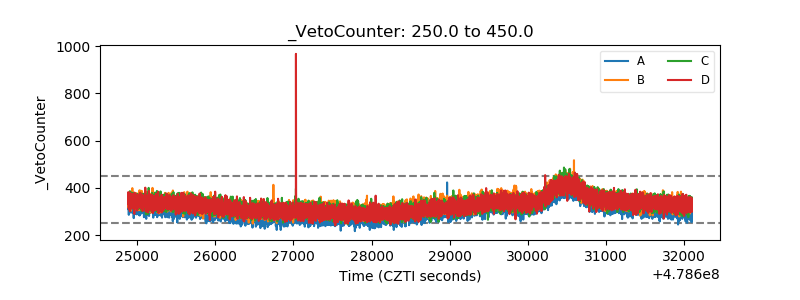 |