| Param | Original file | Final file |
|---|---|---|
| Filename | modeM0/AS1C07_001T02_9000006452_50992cztM0_level2.fits | modeM0/AS1C07_001T02_9000006452_50992cztM0_level2_quad_clean.evt |
| Size (bytes) | 725,941,440 | 106,911,360 |
| Size | 692.3 MB | 102.0 MB |
| Events in quadrant A | 5,603,869 | 706,665 |
| Events in quadrant B | 5,853,397 | 741,768 |
| Events in quadrant C | 6,558,306 | 643,023 |
| Events in quadrant D | 8,254,595 | 604,004 |
| Mode SS | |||
|---|---|---|---|
| Quadrant | BADHDUFLAG | Total packets | Discarded packets |
| A | 0 | 156 | 0 |
| B | 0 | 156 | 0 |
| C | 0 | 156 | 0 |
| D | 0 | 156 | 0 |
| Mode M0 | |||
|---|---|---|---|
| Quadrant | BADHDUFLAG | Total packets | Discarded packets |
| A | 0 | 21966 | 0 |
| B | 0 | 23022 | 2 |
| C | 0 | 24799 | 0 |
| D | 0 | 29957 | 0 |
| Quadrant | Total seconds | Saturated seconds | Saturation percentage |
|---|---|---|---|
| A | 7784 | 278 | 3.571429% |
| B | 7784 | 553 | 7.104317% |
| C | 7784 | 712 | 9.146968% |
| D | 7784 | 764 | 9.815005% |
Noise dominated data is calculated using 1-second bins in cleaned event files. If a bin has >2000 counts, and if more than 50% of those come from <1% of pixels, then it is considered to be noise-dominated and hence unusable.
| Quadrant | # 1 sec bins | Bins with >0 counts | Bins with >2000 counts | High rate bins dominated by noise | Noise dominated (total time) | Noise dominated (detector-on time) | Marked lightcurve |
|---|---|---|---|---|---|---|---|
| A | 7783 | 7783 | 211 | 211 | 2.71% | 2.71% | 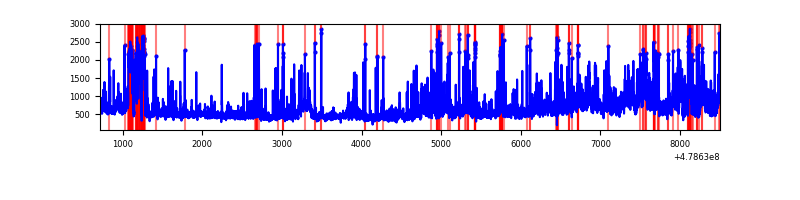 |
| B | 7784 | 7784 | 369 | 369 | 4.74% | 4.74% | 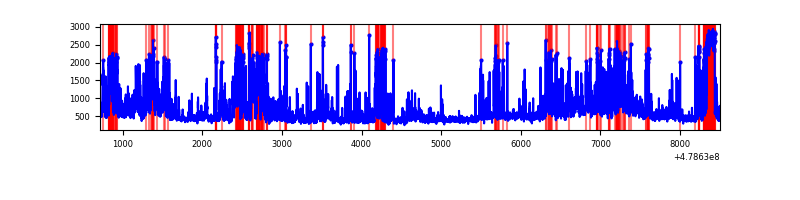 |
| C | 7783 | 7783 | 629 | 629 | 8.08% | 8.08% | 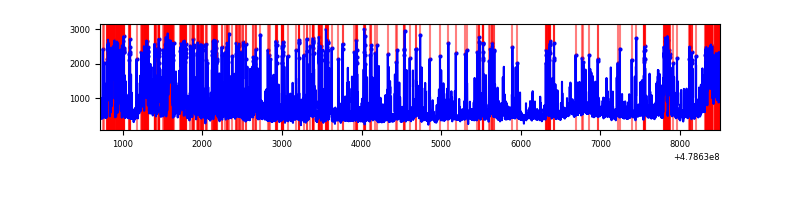 |
| D | 7784 | 7784 | 716 | 716 | 9.20% | 9.20% | 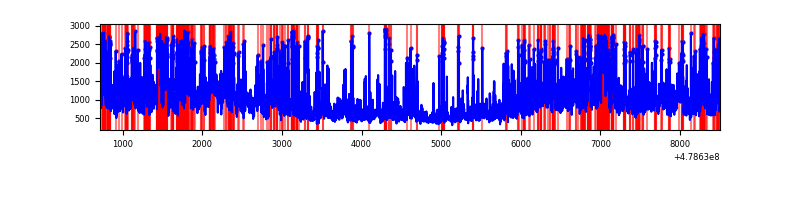 |
Top three noisy pixels from each quadrant. If the there are fewer than three noisy pixels in the level2.evt file, extra rows are filled as -1
| Pixel properties | Quadrant properties | ||||||
|---|---|---|---|---|---|---|---|
| Quadrant | DetID | PixID | Counts | Sigma | Mean | Median | Sigma |
| A | 4 | 249 | 547010 | 2742.89 | 806 | 787 | 199.1 |
| A | 12 | 3 | 241344 | 1207.97 | 806 | 787 | 199.1 |
| A | 4 | 3 | 241061 | 1206.55 | 806 | 787 | 199.1 |
| B | 4 | 81 | 1249875 | 7358.29 | 790 | 762 | 169.8 |
| B | 12 | 32 | 605313 | 3561.29 | 790 | 762 | 169.8 |
| B | 0 | 171 | 353193 | 2076.1 | 790 | 762 | 169.8 |
| C | 1 | 44 | 781677 | 3695.72 | 766 | 760 | 211.3 |
| C | 13 | 3 | 556722 | 2631.11 | 766 | 760 | 211.3 |
| C | 4 | 12 | 434452 | 2052.46 | 766 | 760 | 211.3 |
| D | 7 | 39 | 1624037 | 7588.23 | 760 | 733 | 213.9 |
| D | 10 | 181 | 1037348 | 4845.72 | 760 | 733 | 213.9 |
| D | 12 | 191 | 539655 | 2519.22 | 760 | 733 | 213.9 |
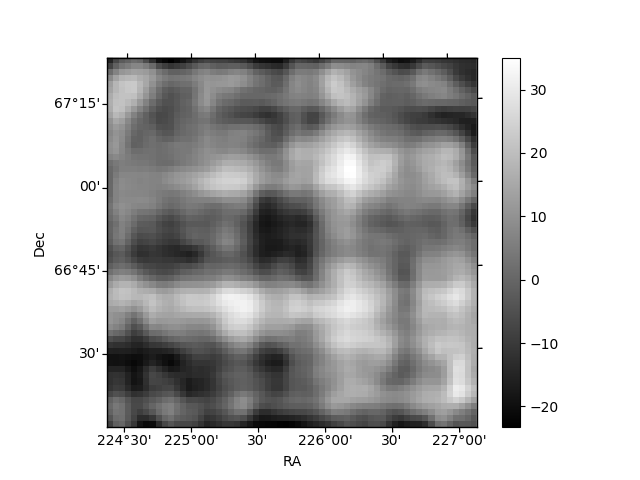
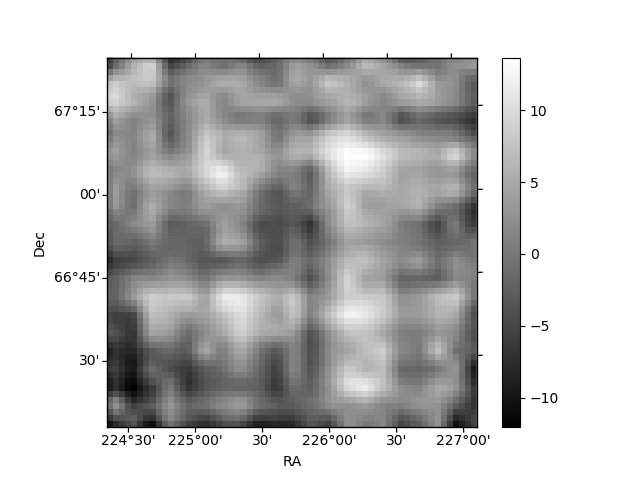
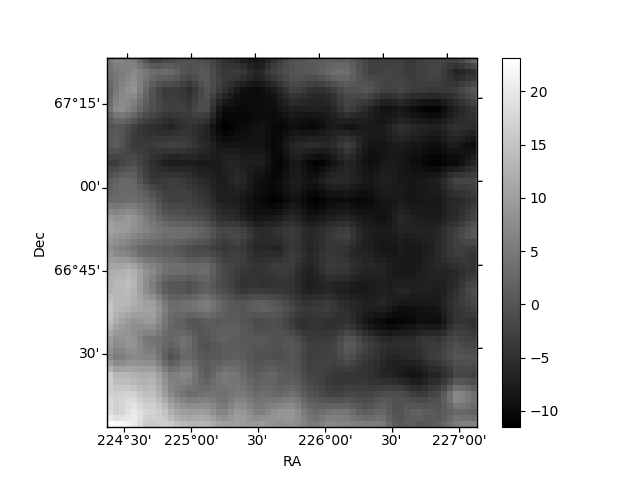
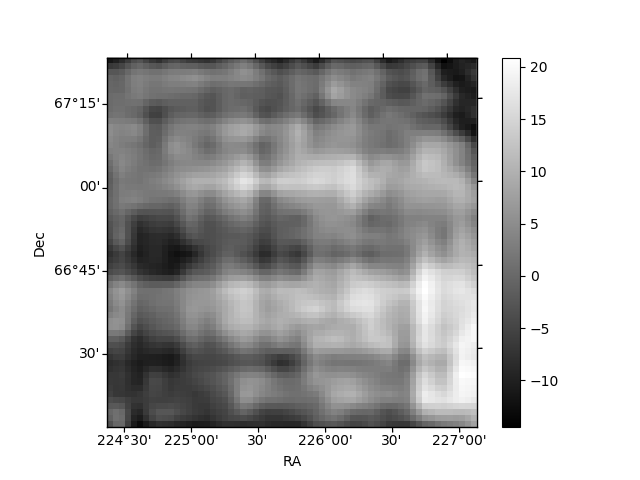
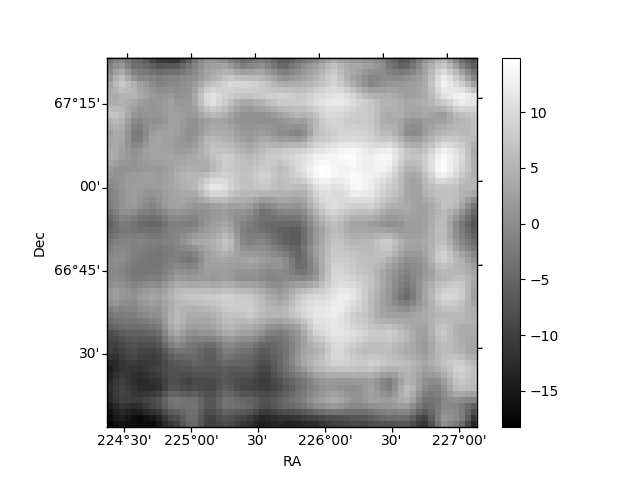
Histogram calculated using DETX and DETY for each event in the final _common_clean file
| Quadrant A | 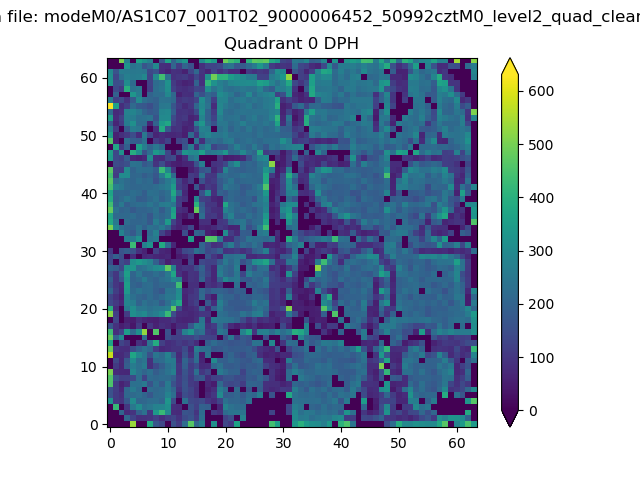 |
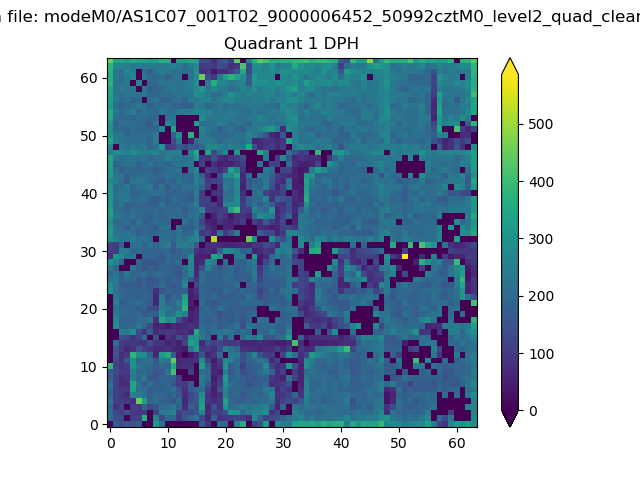 |
Quadrant B |
|---|---|---|---|
| Quadrant D | 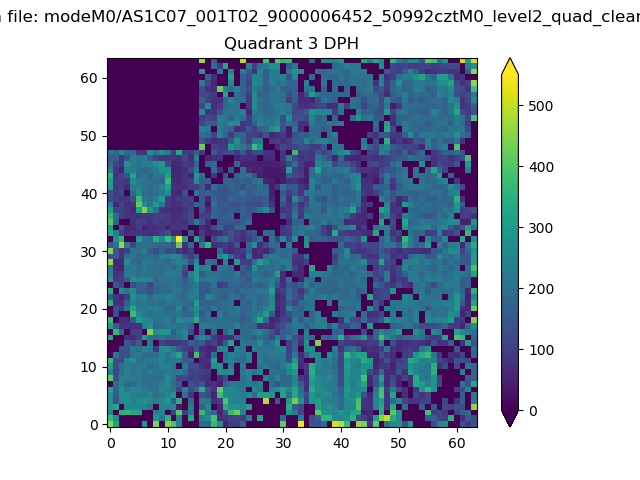 |
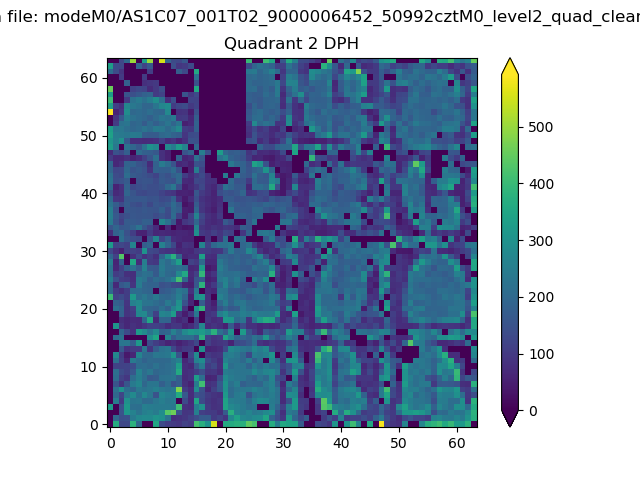 |
Quadrant C |
| Plot type | Count rate plots | Images |
|---|---|---|
| Comparison with Poisson distribution Blue bars denote a histogram of data divided into 1 sec bins. Red curve is a Poisson curve with rate = median count rate of data. |
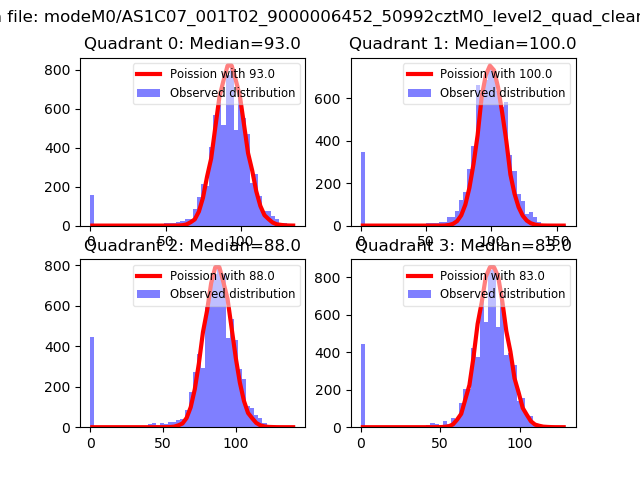 |
 |
| Quadrant-wise count rates Data is divided into 100 sec bins |
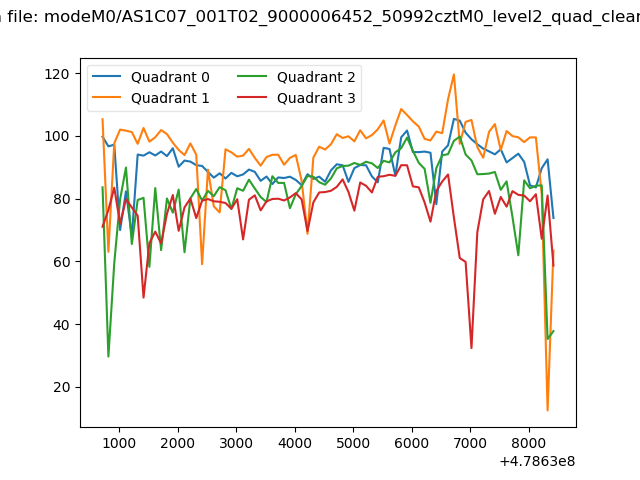 |
|
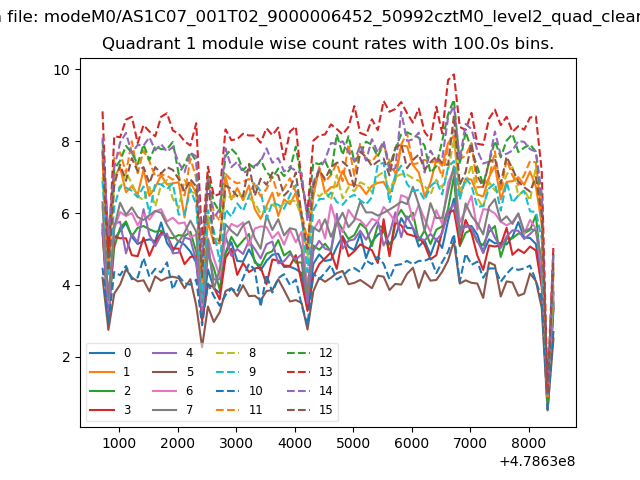
| Module-wise count rates for Quadrant A Data is divided into 100 sec bins |
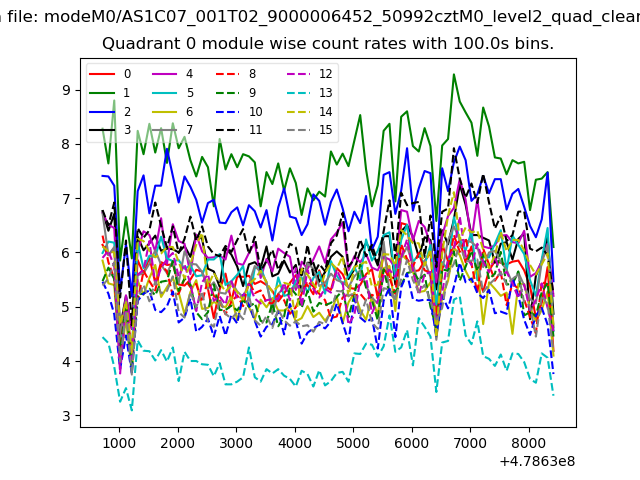 |
 |
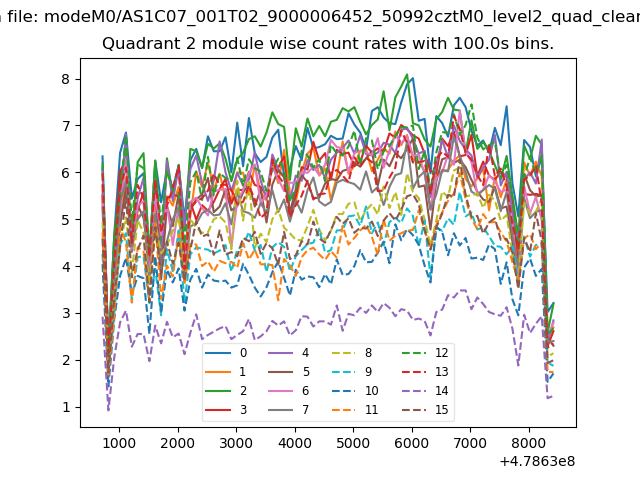
| Module-wise count rates for Quadrant B Data is divided into 100 sec bins |
 |
 |
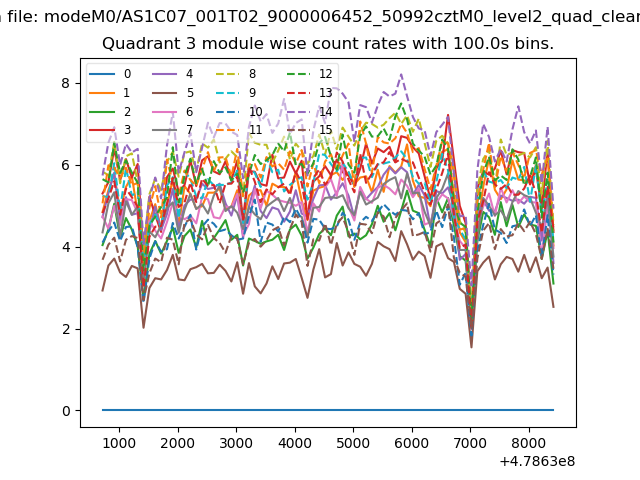
| Module-wise count rates for Quadrant C Data is divided into 100 sec bins |
 |
 |
| Module-wise count rates for Quadrant D Data is divided into 100 sec bins |
 |
 |
| Parameter | Plot |
|---|---|
| CZT HV Monitor | 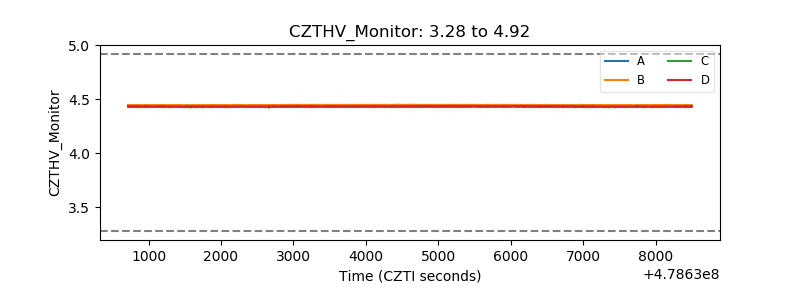 |
| D_VDD | 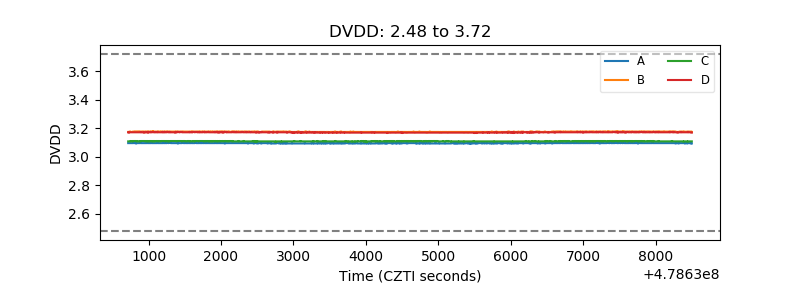 |
| Temperature 1 | 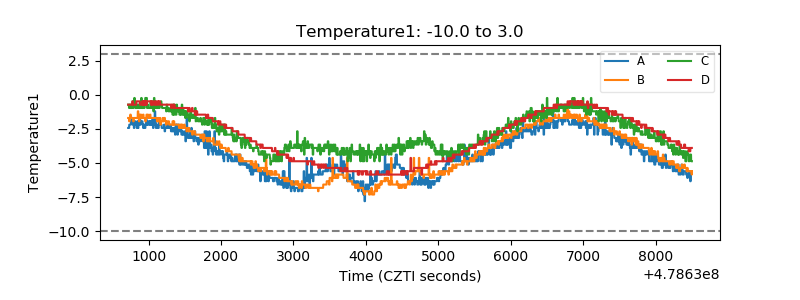 |
| Veto HV Monitor | 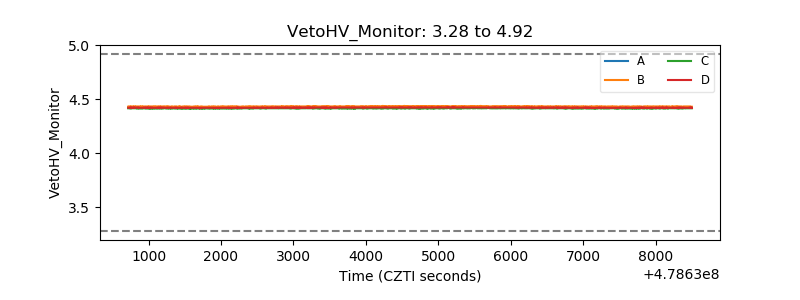 |
| Veto LLD | 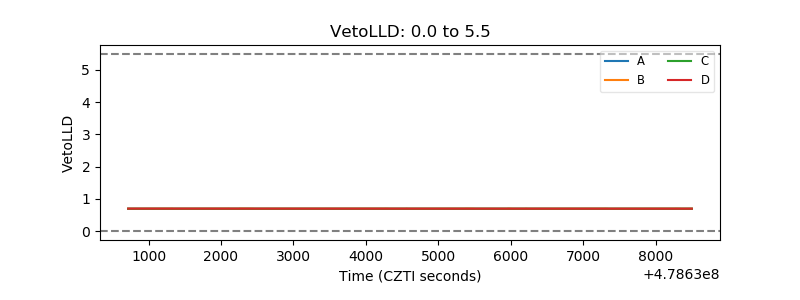 |
| Alpha Counter | 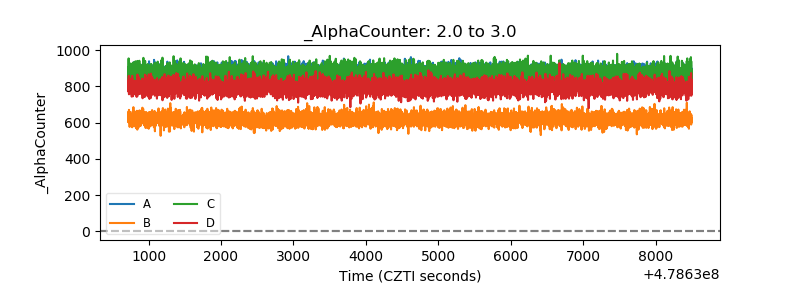 |
| _CPM_Rate | 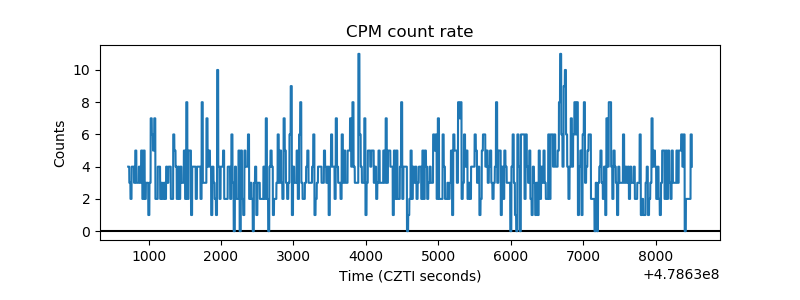 |
| CZT Counter | 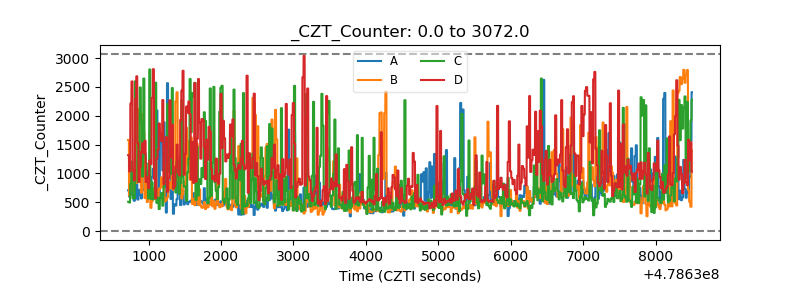 |
| +2.5 Volts monitor | 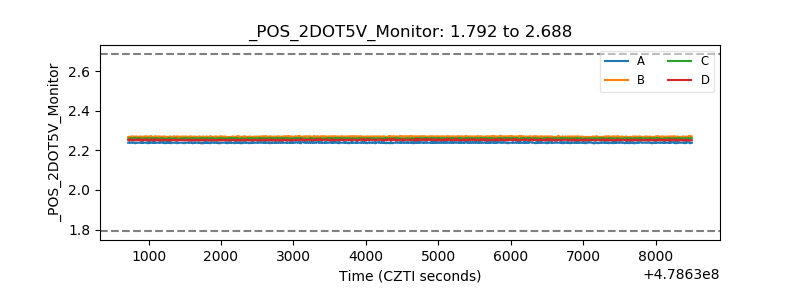 |
| +5 Volts monitor | 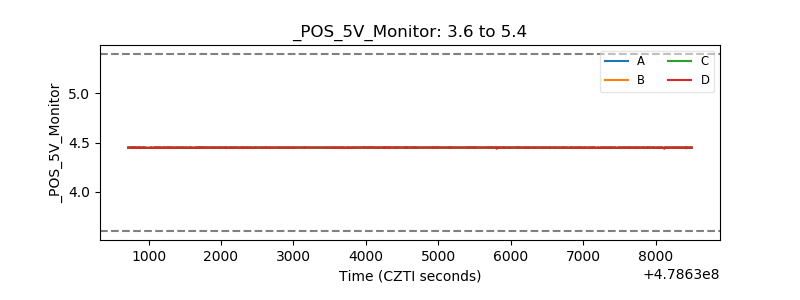 |
| _ROLL_ROT | 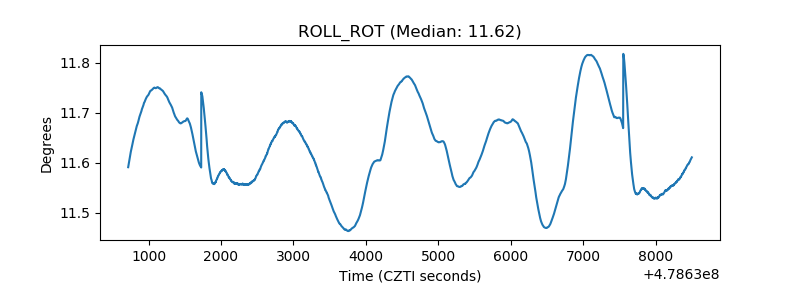 |
| _Roll_DEC | 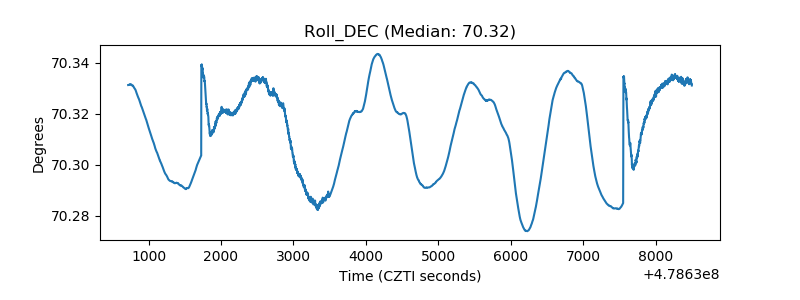 |
| _Roll_RA | 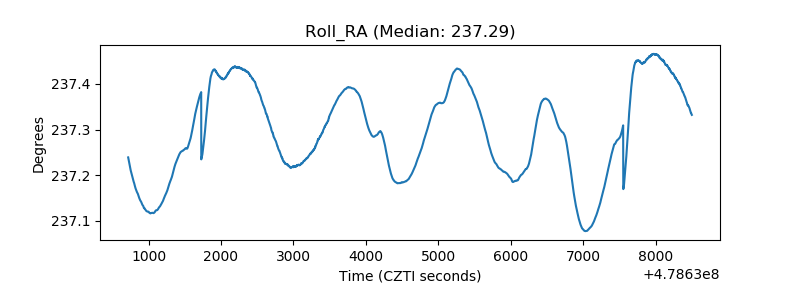 |
| Veto Counter | 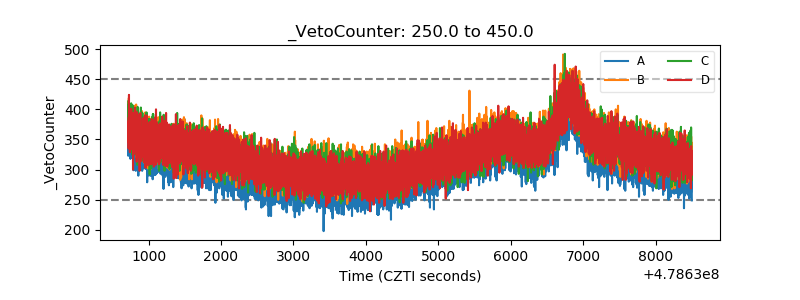 |