| Param | Original file | Final file |
|---|---|---|
| Filename | modeM0/AS1C07_001T02_9000006452_50996cztM0_level2.fits | modeM0/AS1C07_001T02_9000006452_50996cztM0_level2_quad_clean.evt |
| Size (bytes) | 914,826,240 | 145,471,680 |
| Size | 872.4 MB | 138.7 MB |
| Events in quadrant A | 7,593,333 | 923,997 |
| Events in quadrant B | 8,203,509 | 996,424 |
| Events in quadrant C | 9,131,333 | 906,722 |
| Events in quadrant D | 8,114,287 | 839,979 |
| Mode SS | |||
|---|---|---|---|
| Quadrant | BADHDUFLAG | Total packets | Discarded packets |
| A | 0 | 220 | 0 |
| B | 0 | 220 | 0 |
| C | 0 | 220 | 0 |
| D | 0 | 220 | 0 |
| Mode M9 | |||
|---|---|---|---|
| Quadrant | BADHDUFLAG | Total packets | Discarded packets |
| A | 0 | 13 | 0 |
| B | 0 | 13 | 0 |
| C | 0 | 13 | 0 |
| D | 0 | 13 | 0 |
| Mode M0 | |||
|---|---|---|---|
| Quadrant | BADHDUFLAG | Total packets | Discarded packets |
| A | 0 | 29885 | 2 |
| B | 0 | 31800 | 2 |
| C | 0 | 34735 | 2 |
| D | 0 | 31810 | 2 |
| Quadrant | Total seconds | Saturated seconds | Saturation percentage |
|---|---|---|---|
| A | 10633 | 540 | 5.078529% |
| B | 10633 | 708 | 6.658516% |
| C | 10634 | 492 | 4.626669% |
| D | 10634 | 615 | 5.783336% |
Noise dominated data is calculated using 1-second bins in cleaned event files. If a bin has >2000 counts, and if more than 50% of those come from <1% of pixels, then it is considered to be noise-dominated and hence unusable.
| Quadrant | # 1 sec bins | Bins with >0 counts | Bins with >2000 counts | High rate bins dominated by noise | Noise dominated (total time) | Noise dominated (detector-on time) | Marked lightcurve |
|---|---|---|---|---|---|---|---|
| A | 12033 | 10635 | 487 | 487 | 4.05% | 4.58% | 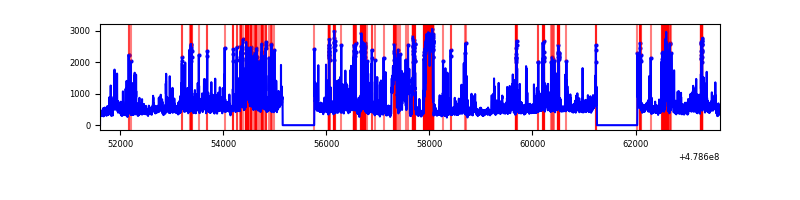 |
| B | 12033 | 10635 | 518 | 518 | 4.30% | 4.87% | 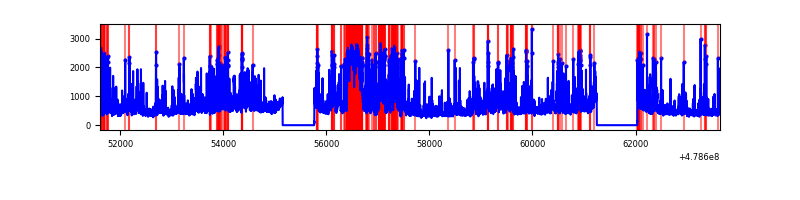 |
| C | 12034 | 10636 | 401 | 401 | 3.33% | 3.77% | 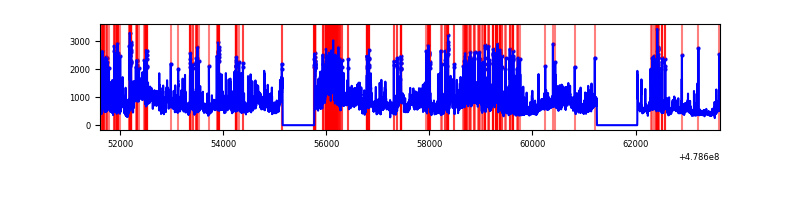 |
| D | 12034 | 10636 | 614 | 614 | 5.10% | 5.77% | 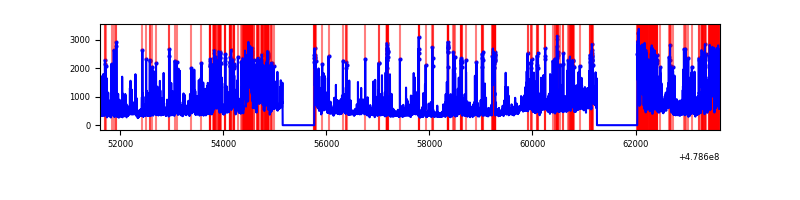 |
Top three noisy pixels from each quadrant. If the there are fewer than three noisy pixels in the level2.evt file, extra rows are filled as -1
| Pixel properties | Quadrant properties | ||||||
|---|---|---|---|---|---|---|---|
| Quadrant | DetID | PixID | Counts | Sigma | Mean | Median | Sigma |
| A | 8 | 43 | 558903 | 2033.15 | 1080 | 1051 | 274.4 |
| A | 4 | 249 | 526775 | 1916.05 | 1080 | 1051 | 274.4 |
| A | 12 | 80 | 484457 | 1761.82 | 1080 | 1051 | 274.4 |
| B | 12 | 32 | 1277799 | 5574.09 | 1063 | 1024 | 229.1 |
| B | 0 | 172 | 796445 | 3472.62 | 1063 | 1024 | 229.1 |
| B | 4 | 81 | 526514 | 2294.16 | 1063 | 1024 | 229.1 |
| C | 12 | 247 | 2646657 | 9031.45 | 1052 | 1043 | 292.9 |
| C | 1 | 44 | 666635 | 2272.16 | 1052 | 1043 | 292.9 |
| C | 15 | 147 | 384806 | 1310.07 | 1052 | 1043 | 292.9 |
| D | 8 | 176 | 1102399 | 3827.61 | 1035 | 1001 | 287.8 |
| D | 2 | 153 | 574540 | 1993.18 | 1035 | 1001 | 287.8 |
| D | 15 | 108 | 489319 | 1697.02 | 1035 | 1001 | 287.8 |
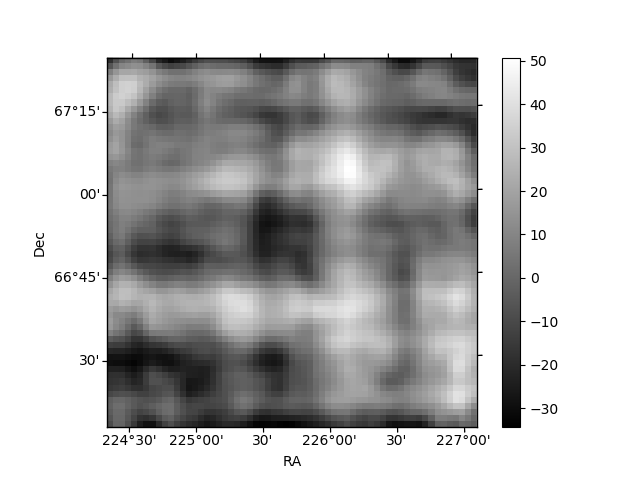
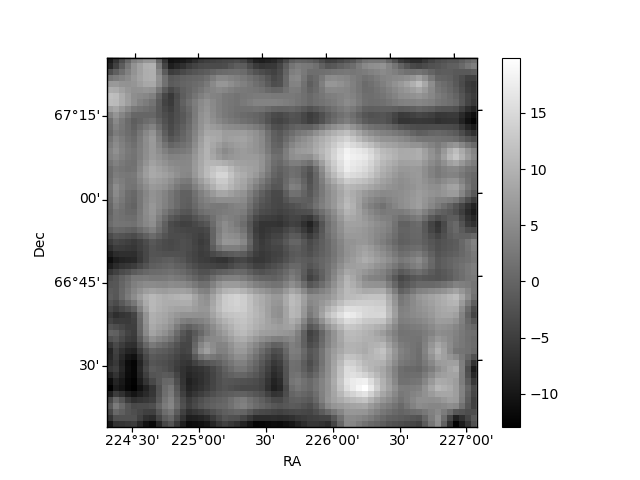
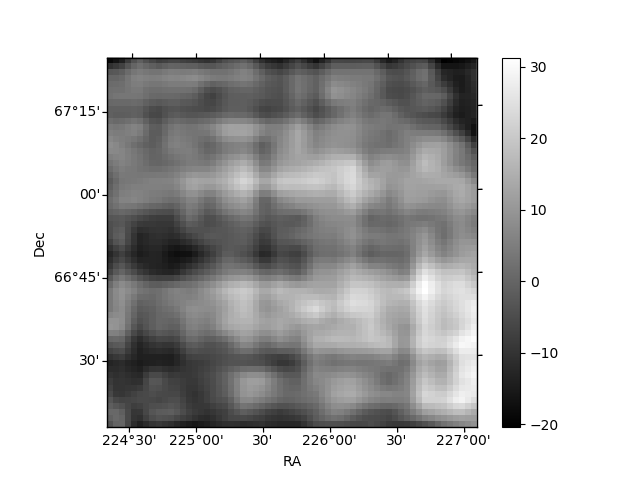
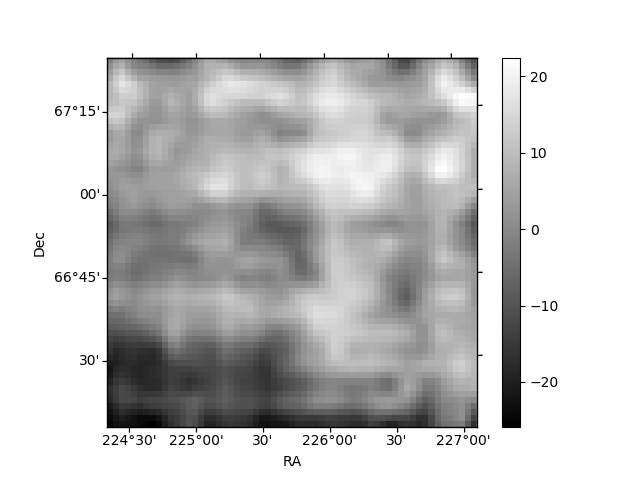
Histogram calculated using DETX and DETY for each event in the final _common_clean file
| Quadrant A | 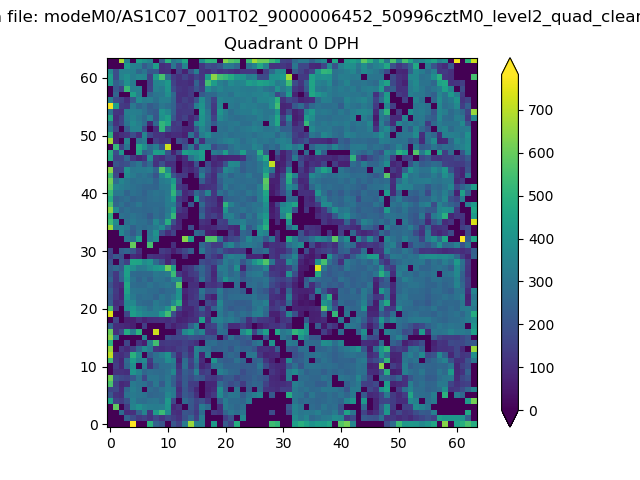 |
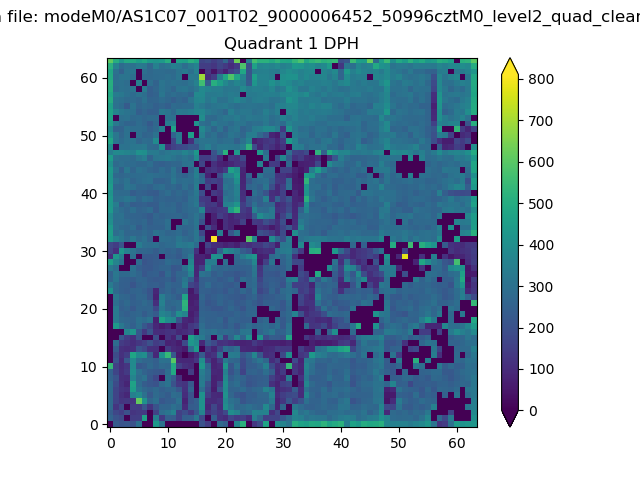 |
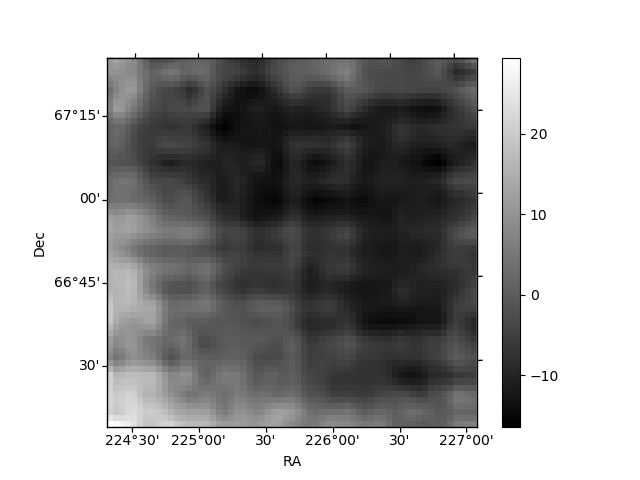
Quadrant B |
|---|---|---|---|
| Quadrant D | 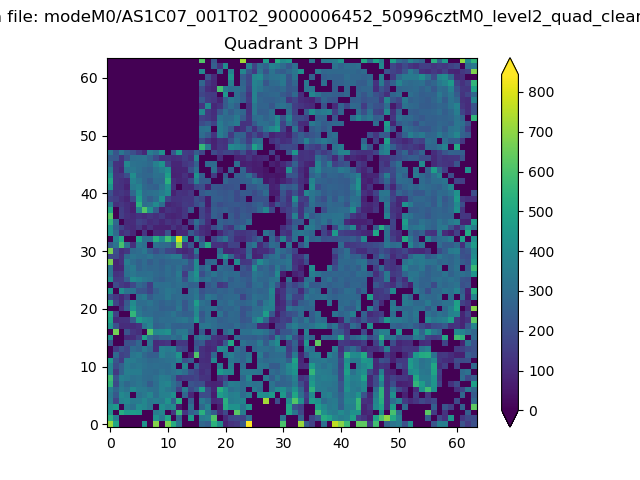 |
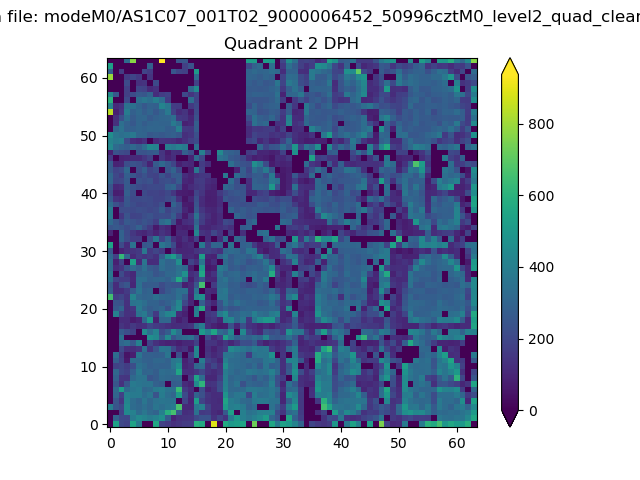 |
Quadrant C |
| Plot type | Count rate plots | Images |
|---|---|---|
| Comparison with Poisson distribution Blue bars denote a histogram of data divided into 1 sec bins. Red curve is a Poisson curve with rate = median count rate of data. |
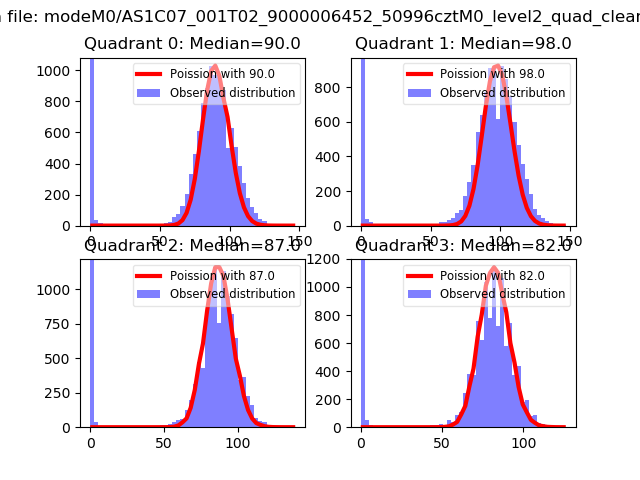 |
 |
| Quadrant-wise count rates Data is divided into 100 sec bins |
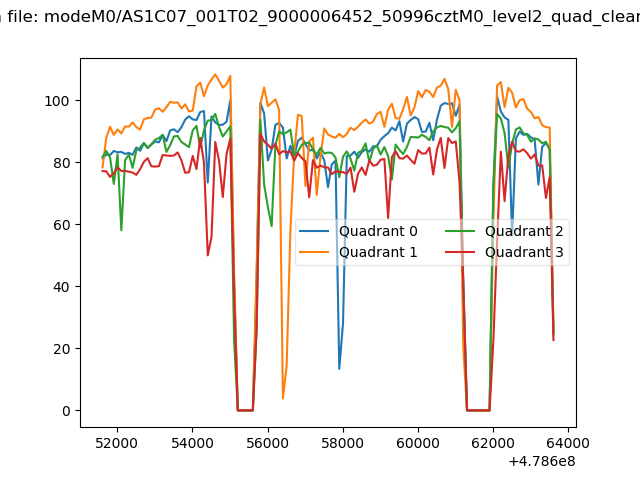 |
|
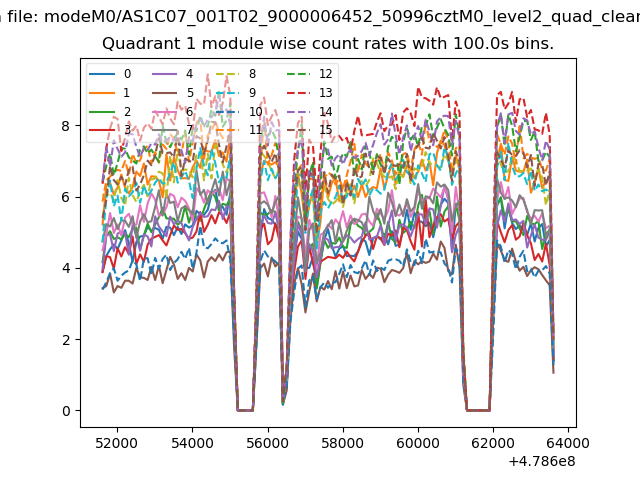
| Module-wise count rates for Quadrant A Data is divided into 100 sec bins |
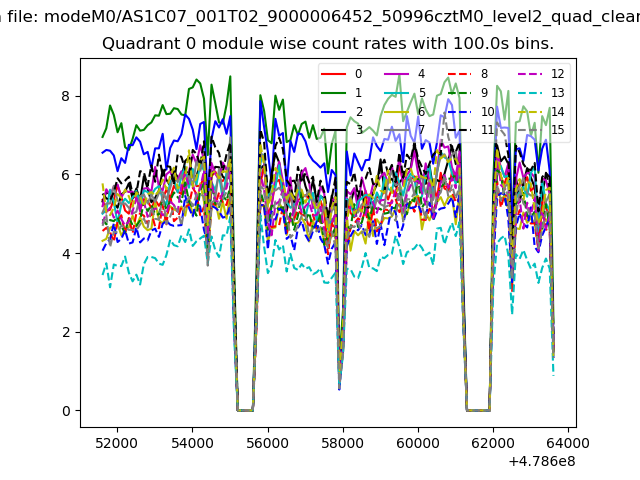 |
 |
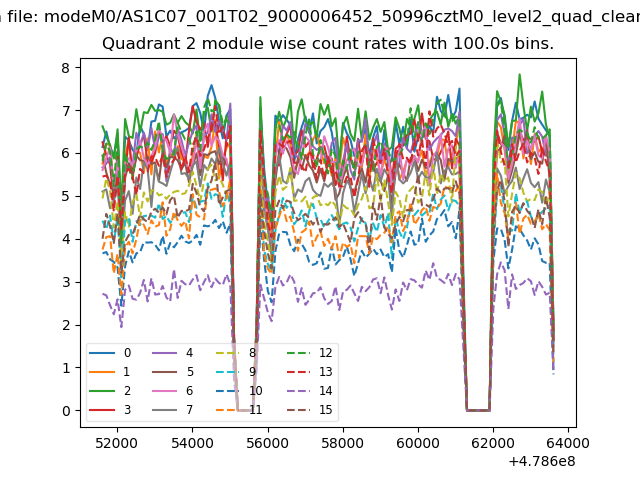
| Module-wise count rates for Quadrant B Data is divided into 100 sec bins |
 |
 |
| Module-wise count rates for Quadrant C Data is divided into 100 sec bins |
 |
 |
| Module-wise count rates for Quadrant D Data is divided into 100 sec bins |
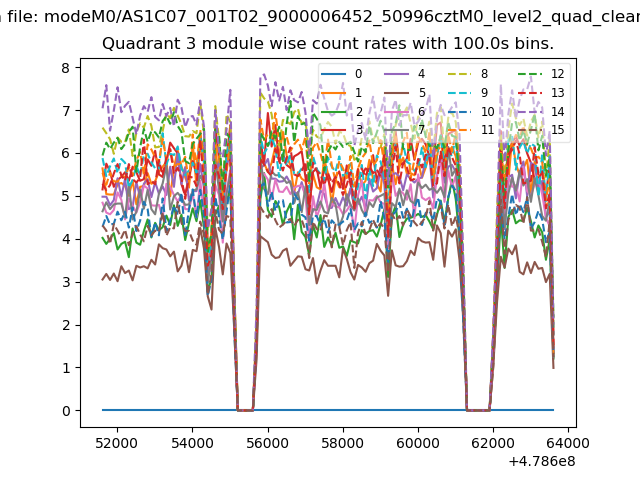 |
 |
| Parameter | Plot |
|---|---|
| CZT HV Monitor | 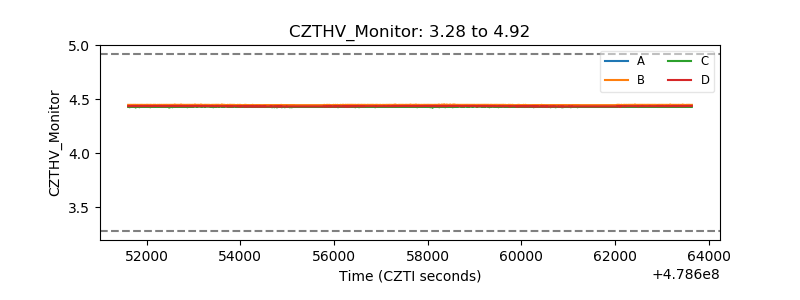 |
| D_VDD | 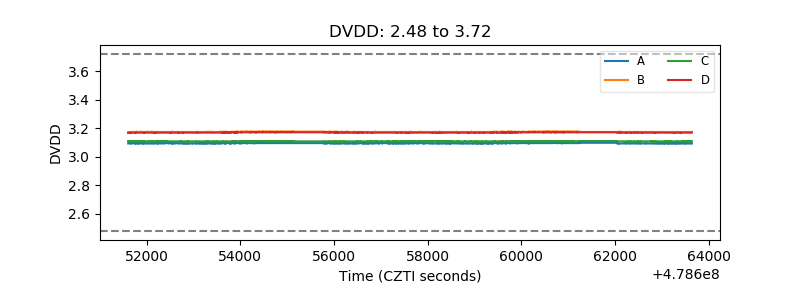 |
| Temperature 1 | 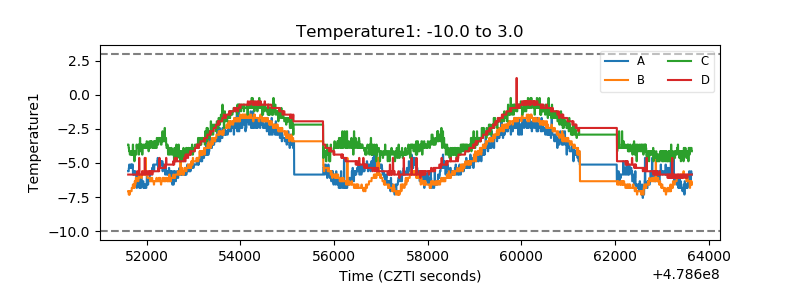 |
| Veto HV Monitor | 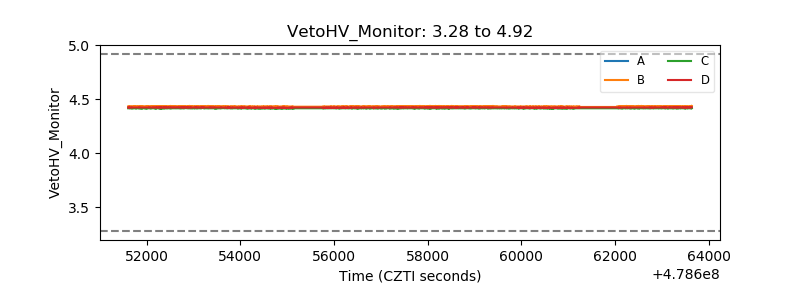 |
| Veto LLD | 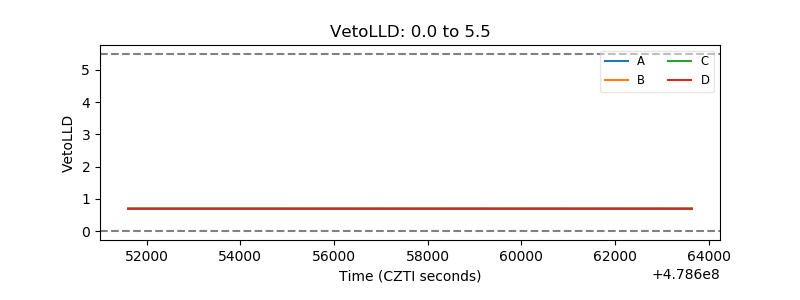 |
| Alpha Counter | 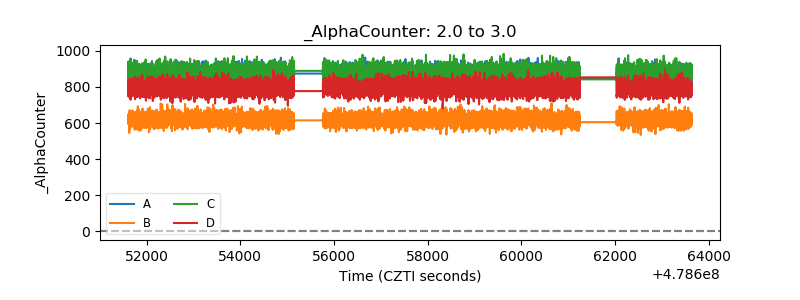 |
| _CPM_Rate | 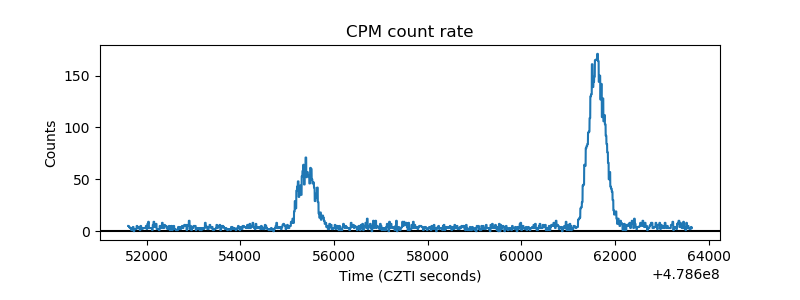 |
| CZT Counter | 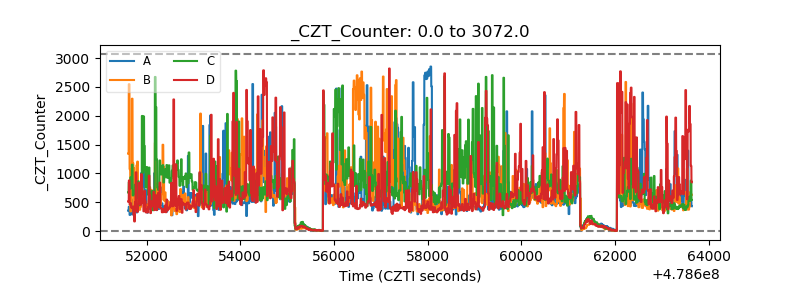 |
| +2.5 Volts monitor | 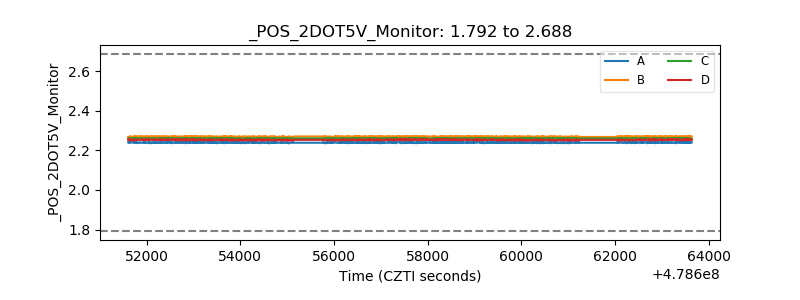 |
| +5 Volts monitor | 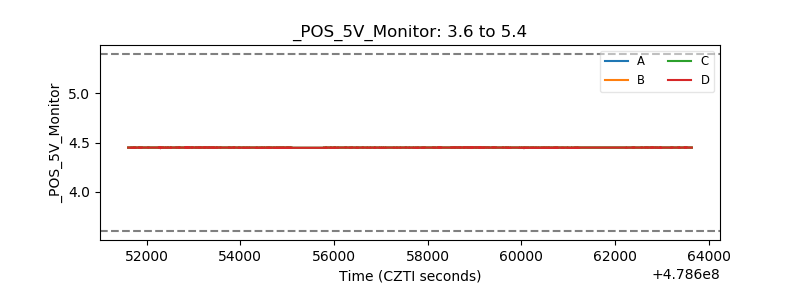 |
| _ROLL_ROT | 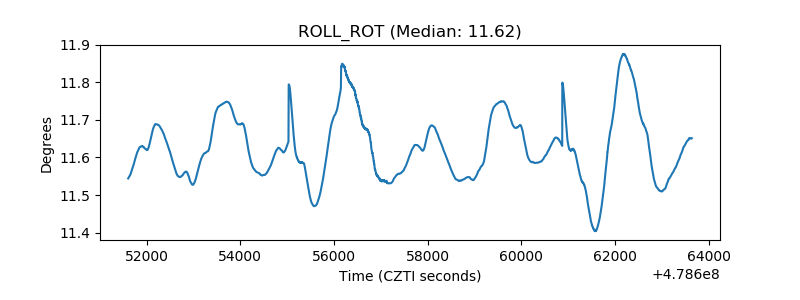 |
| _Roll_DEC | 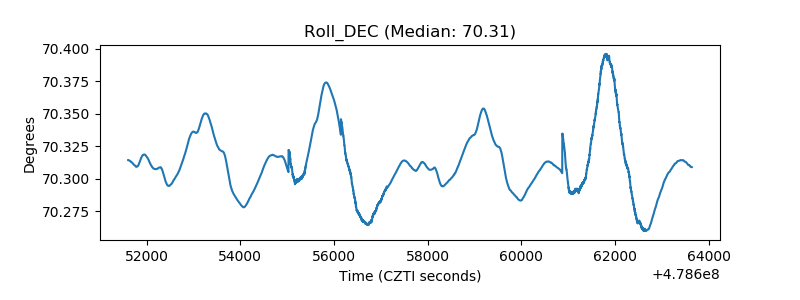 |
| _Roll_RA | 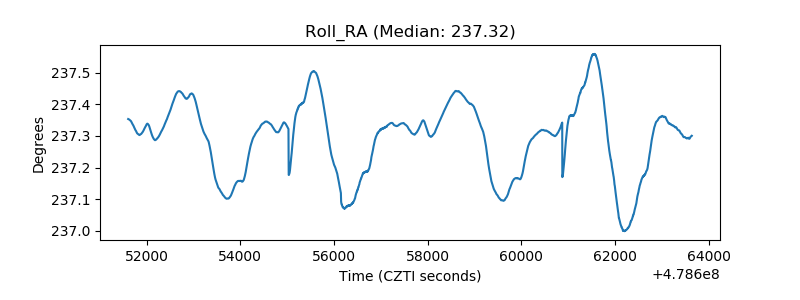 |
| Veto Counter | 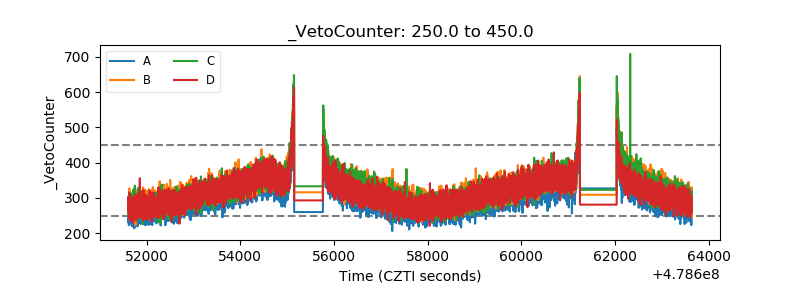 |