| Param | Original file | Final file |
|---|---|---|
| Filename | modeM0/AS1C07_001T02_9000006452_50997cztM0_level2.fits | modeM0/AS1C07_001T02_9000006452_50997cztM0_level2_quad_clean.evt |
| Size (bytes) | 381,620,160 | 64,235,520 |
| Size | 363.9 MB | 61.3 MB |
| Events in quadrant A | 3,174,013 | 419,514 |
| Events in quadrant B | 3,375,805 | 439,378 |
| Events in quadrant C | 3,984,496 | 389,788 |
| Events in quadrant D | 3,238,951 | 377,211 |
| Mode SS | |||
|---|---|---|---|
| Quadrant | BADHDUFLAG | Total packets | Discarded packets |
| A | 0 | 92 | 0 |
| B | 0 | 92 | 0 |
| C | 0 | 92 | 0 |
| D | 0 | 92 | 0 |
| Mode M9 | |||
|---|---|---|---|
| Quadrant | BADHDUFLAG | Total packets | Discarded packets |
| A | 0 | 9 | 0 |
| B | 0 | 9 | 0 |
| C | 0 | 9 | 0 |
| D | 0 | 9 | 0 |
| Mode M0 | |||
|---|---|---|---|
| Quadrant | BADHDUFLAG | Total packets | Discarded packets |
| A | 0 | 12534 | 1 |
| B | 0 | 13355 | 1 |
| C | 0 | 15084 | 1 |
| D | 0 | 12867 | 1 |
| Quadrant | Total seconds | Saturated seconds | Saturation percentage |
|---|---|---|---|
| A | 4540 | 147 | 3.237885% |
| B | 4540 | 311 | 6.850220% |
| C | 4540 | 348 | 7.665198% |
| D | 4540 | 155 | 3.414097% |
Noise dominated data is calculated using 1-second bins in cleaned event files. If a bin has >2000 counts, and if more than 50% of those come from <1% of pixels, then it is considered to be noise-dominated and hence unusable.
| Quadrant | # 1 sec bins | Bins with >0 counts | Bins with >2000 counts | High rate bins dominated by noise | Noise dominated (total time) | Noise dominated (detector-on time) | Marked lightcurve |
|---|---|---|---|---|---|---|---|
| A | 5455 | 4541 | 91 | 91 | 1.67% | 2.00% | 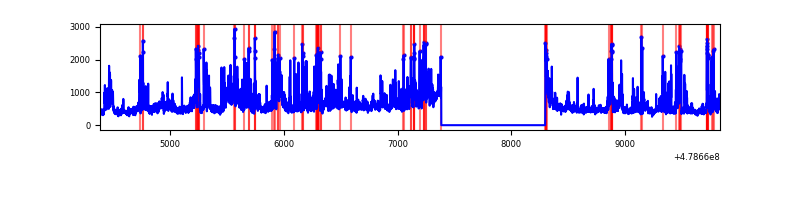 |
| B | 5455 | 4541 | 132 | 132 | 2.42% | 2.91% | 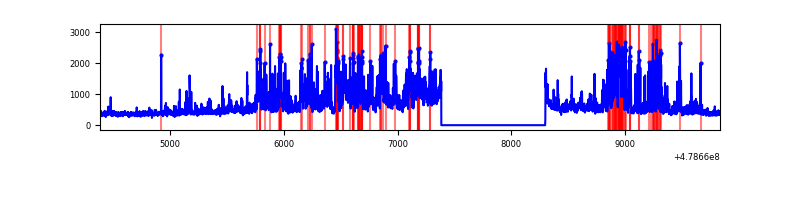 |
| C | 5455 | 4541 | 298 | 298 | 5.46% | 6.56% | 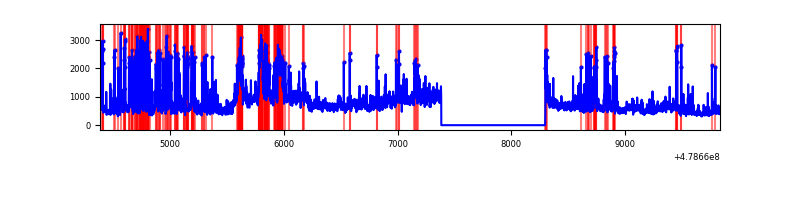 |
| D | 5455 | 4541 | 137 | 137 | 2.51% | 3.02% | 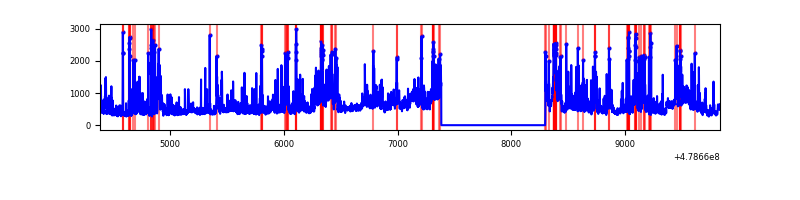 |
Top three noisy pixels from each quadrant. If the there are fewer than three noisy pixels in the level2.evt file, extra rows are filled as -1
| Pixel properties | Quadrant properties | ||||||
|---|---|---|---|---|---|---|---|
| Quadrant | DetID | PixID | Counts | Sigma | Mean | Median | Sigma |
| A | 4 | 249 | 258667 | 2178.99 | 476 | 464 | 118.5 |
| A | 4 | 4 | 153995 | 1295.66 | 476 | 464 | 118.5 |
| A | 3 | 130 | 145205 | 1221.48 | 476 | 464 | 118.5 |
| B | 12 | 32 | 550347 | 5499.83 | 468 | 452 | 100.0 |
| B | 4 | 81 | 367126 | 3667.33 | 468 | 452 | 100.0 |
| B | 1 | 223 | 170851 | 1704.26 | 468 | 452 | 100.0 |
| C | 12 | 247 | 855840 | 6730.9 | 454 | 448 | 127.1 |
| C | 1 | 44 | 501652 | 3943.87 | 454 | 448 | 127.1 |
| C | 15 | 147 | 223144 | 1752.35 | 454 | 448 | 127.1 |
| D | 8 | 176 | 280683 | 2198.14 | 457 | 440 | 127.5 |
| D | 2 | 216 | 243805 | 1908.88 | 457 | 440 | 127.5 |
| D | 2 | 153 | 187135 | 1464.38 | 457 | 440 | 127.5 |
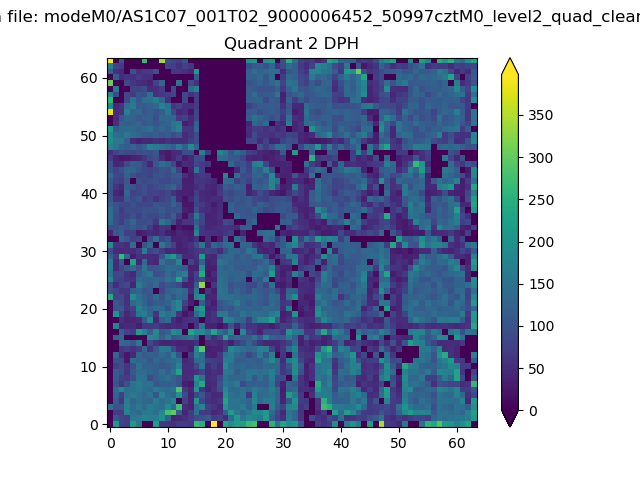
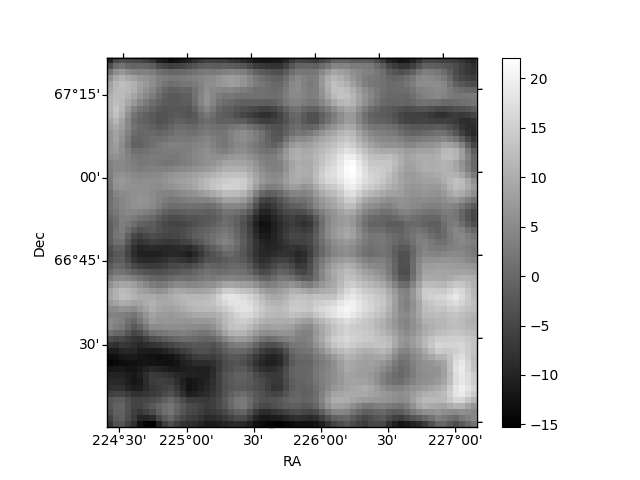
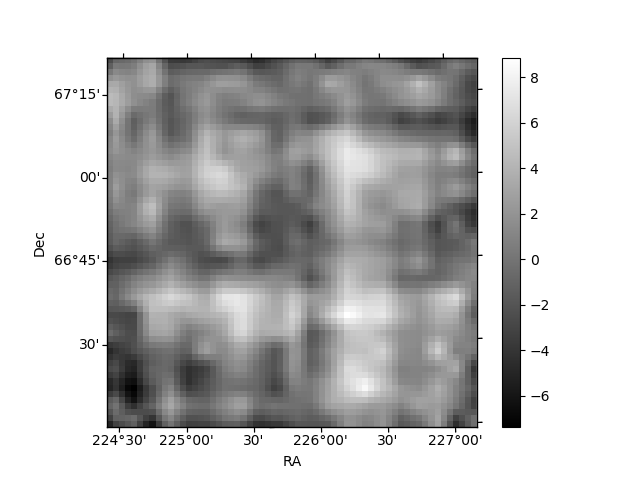
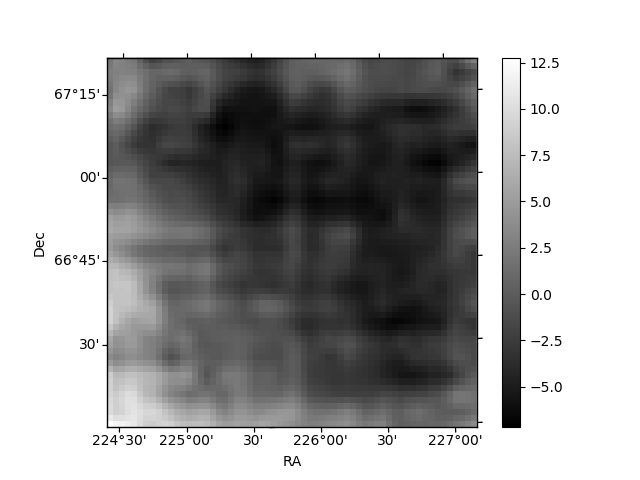
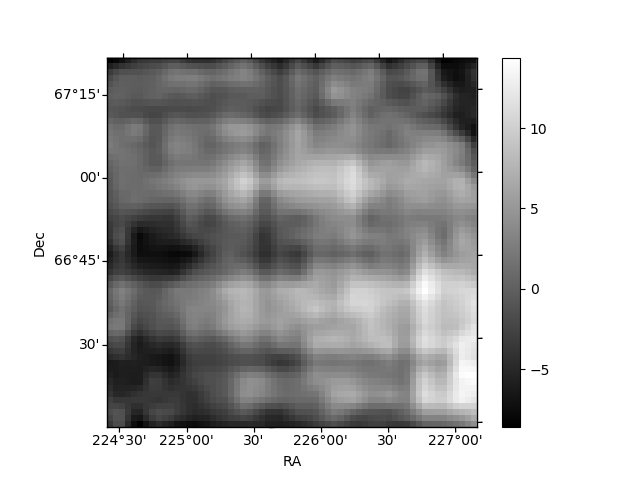
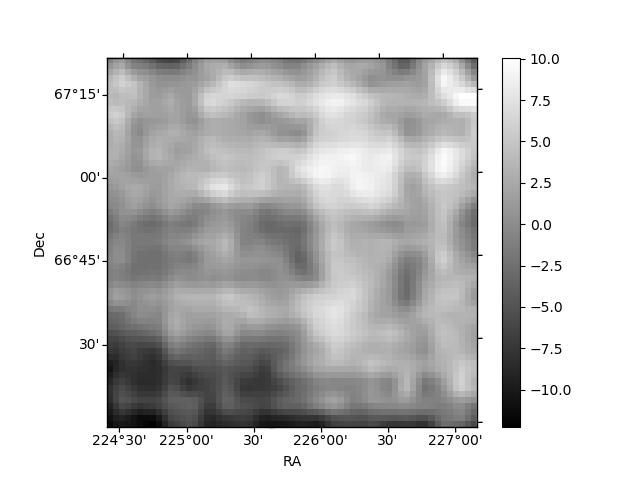
Histogram calculated using DETX and DETY for each event in the final _common_clean file
| Quadrant A | 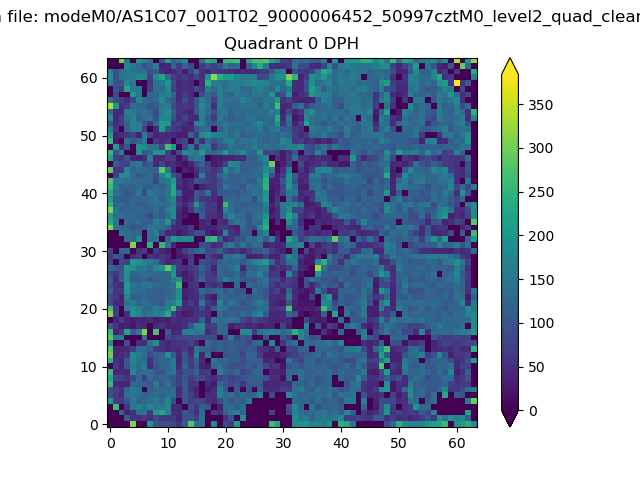 |
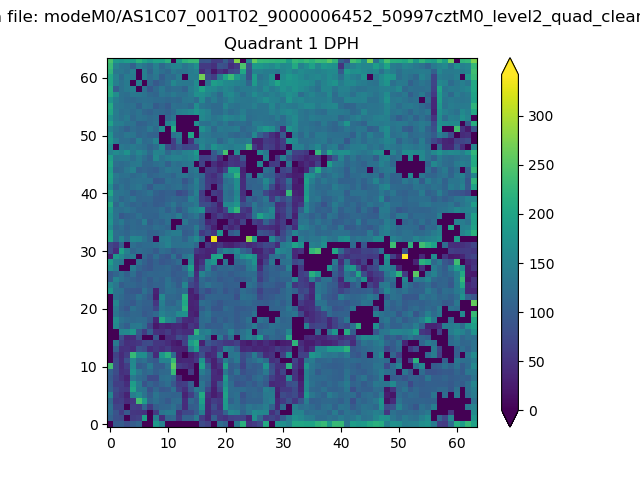 |
Quadrant B |
|---|---|---|---|
| Quadrant D | 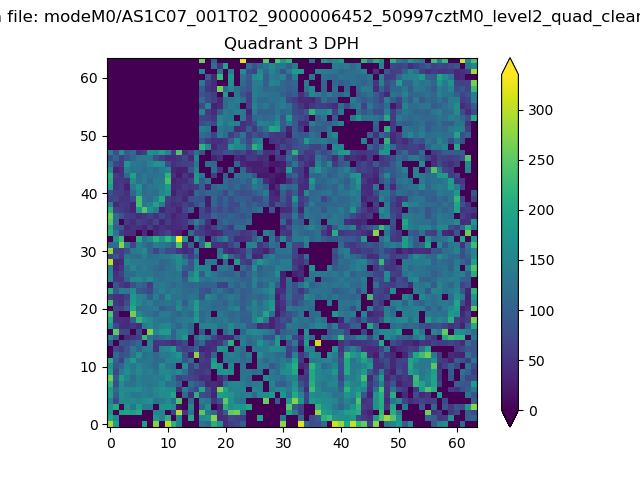 |
 |
Quadrant C |
| Plot type | Count rate plots | Images |
|---|---|---|
| Comparison with Poisson distribution Blue bars denote a histogram of data divided into 1 sec bins. Red curve is a Poisson curve with rate = median count rate of data. |
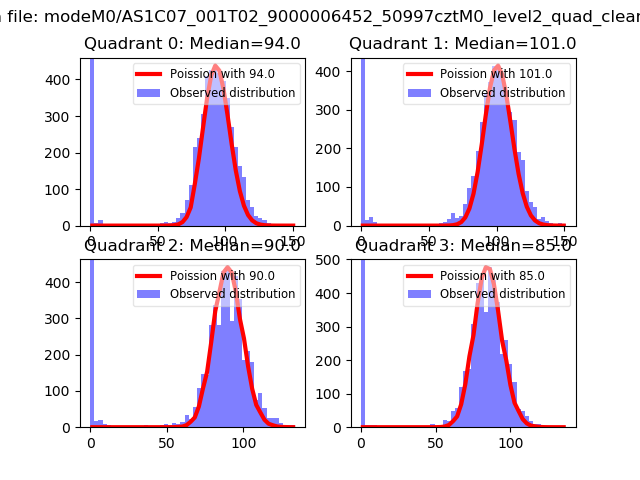 |
 |
| Quadrant-wise count rates Data is divided into 100 sec bins |
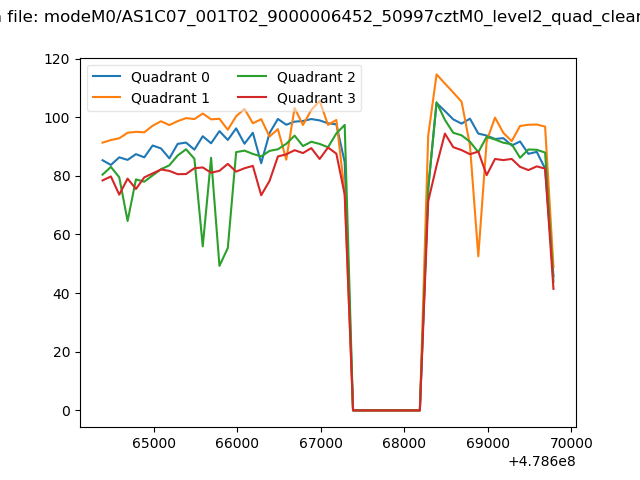 |
|
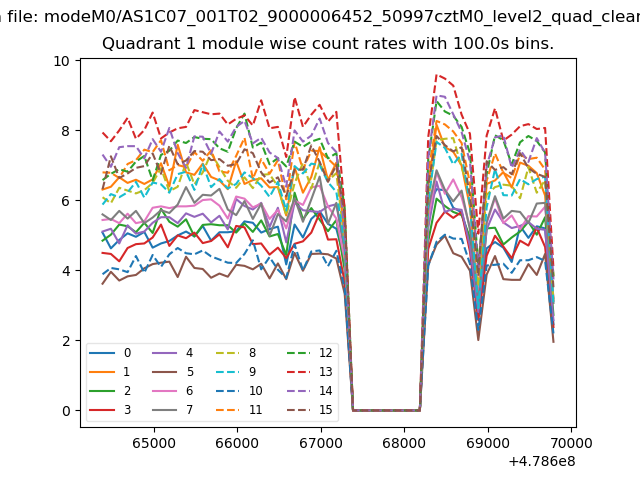
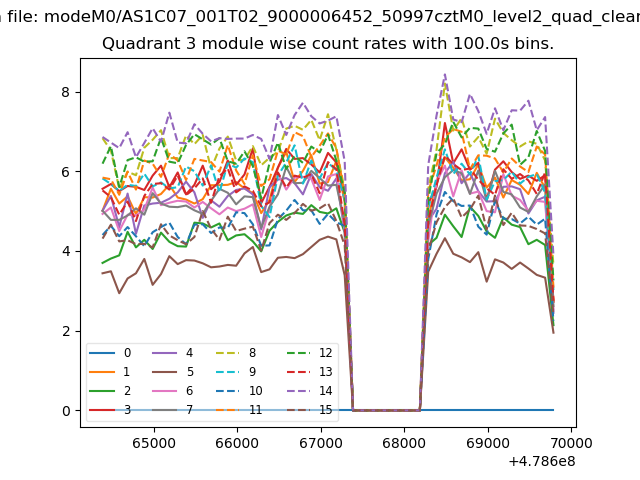
| Module-wise count rates for Quadrant A Data is divided into 100 sec bins |
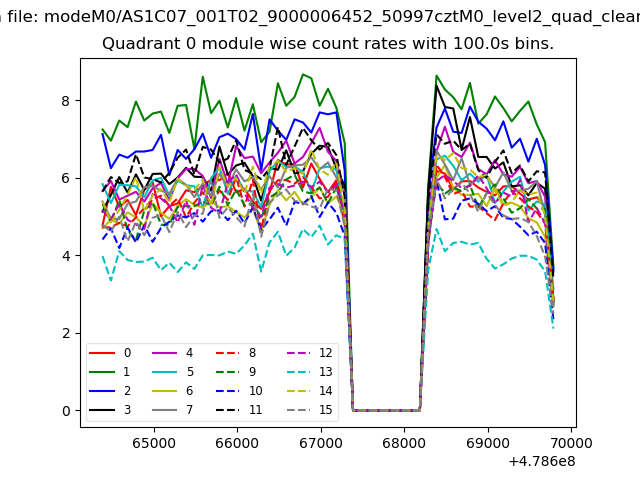 |
 |
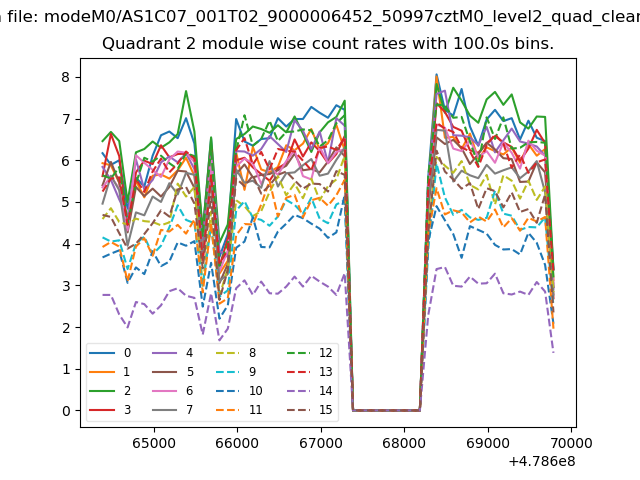
| Module-wise count rates for Quadrant B Data is divided into 100 sec bins |
 |
 |
| Module-wise count rates for Quadrant C Data is divided into 100 sec bins |
 |
 |
| Module-wise count rates for Quadrant D Data is divided into 100 sec bins |
 |
 |
| Parameter | Plot |
|---|---|
| CZT HV Monitor | 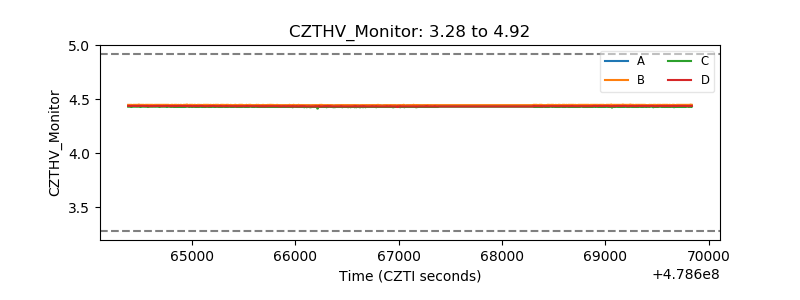 |
| D_VDD | 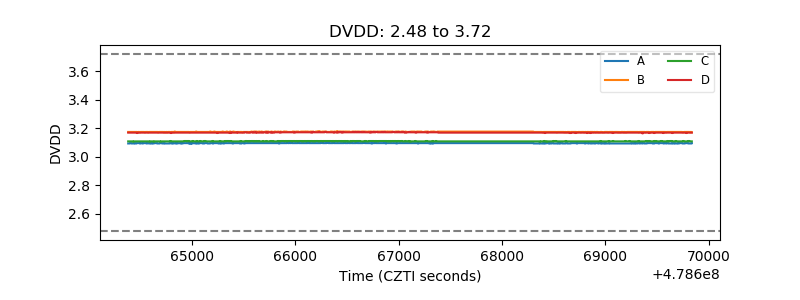 |
| Temperature 1 | 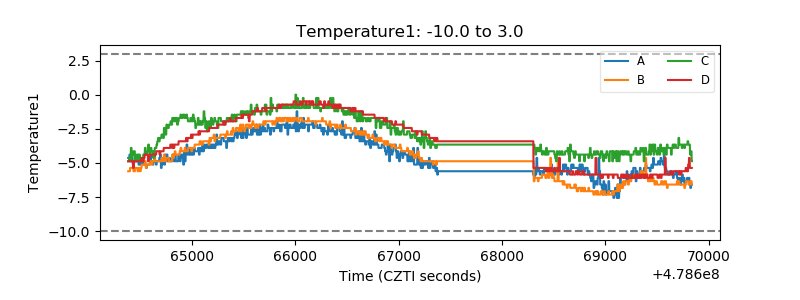 |
| Veto HV Monitor | 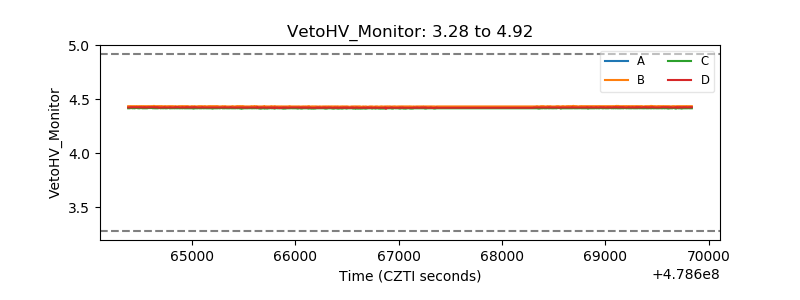 |
| Veto LLD | 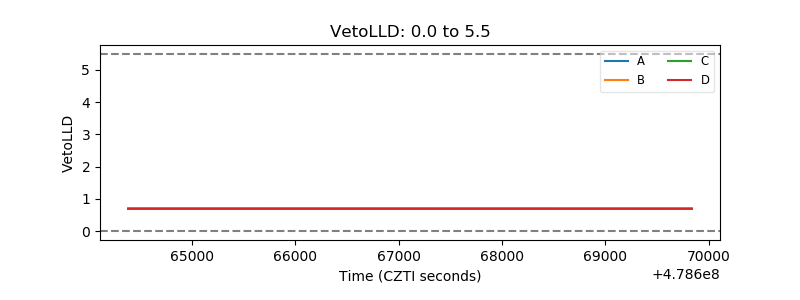 |
| Alpha Counter | 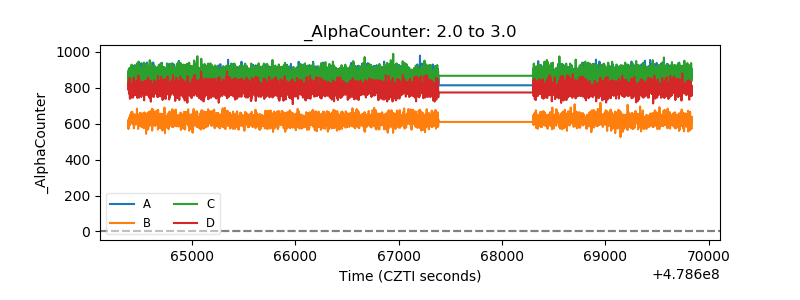 |
| _CPM_Rate | 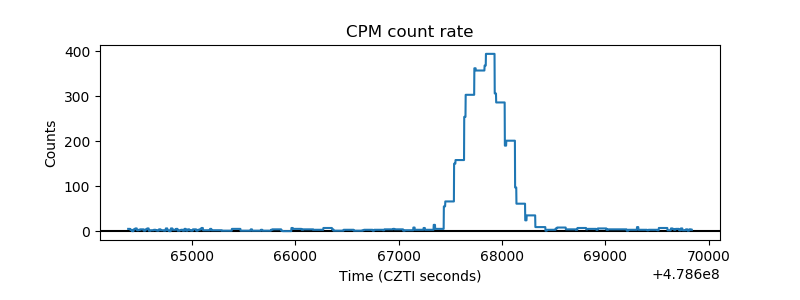 |
| CZT Counter |  |
| +2.5 Volts monitor | 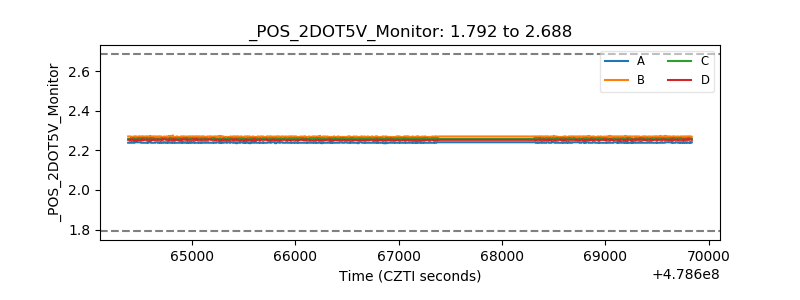 |
| +5 Volts monitor | 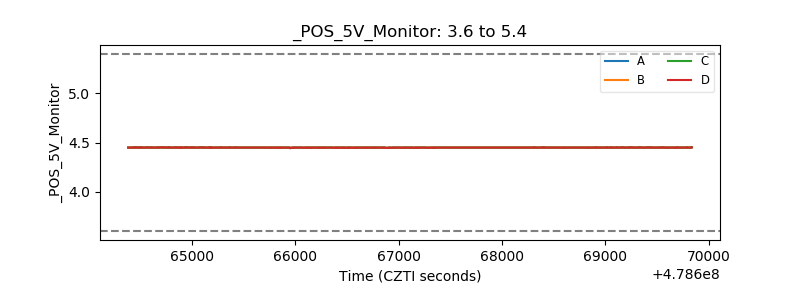 |
| _ROLL_ROT | 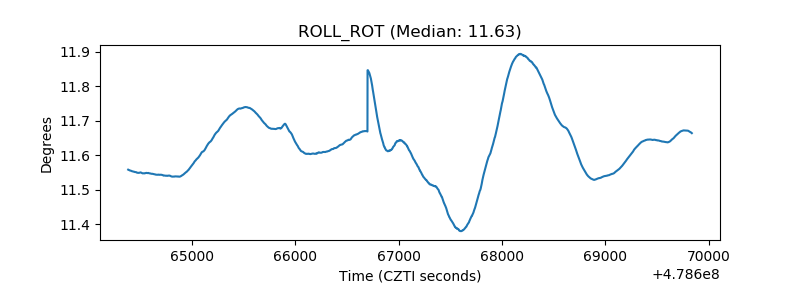 |
| _Roll_DEC | 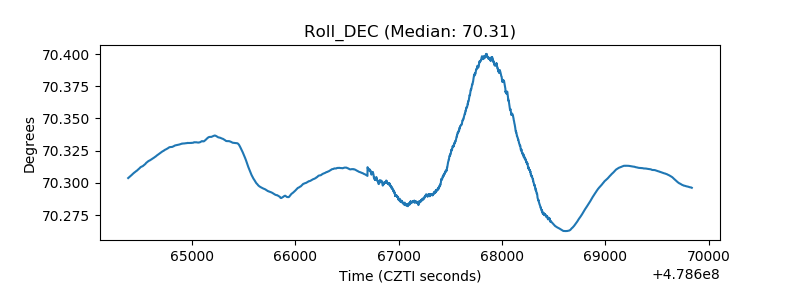 |
| _Roll_RA | 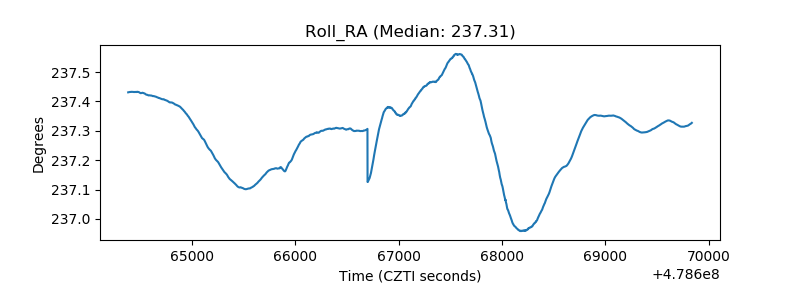 |
| Veto Counter | 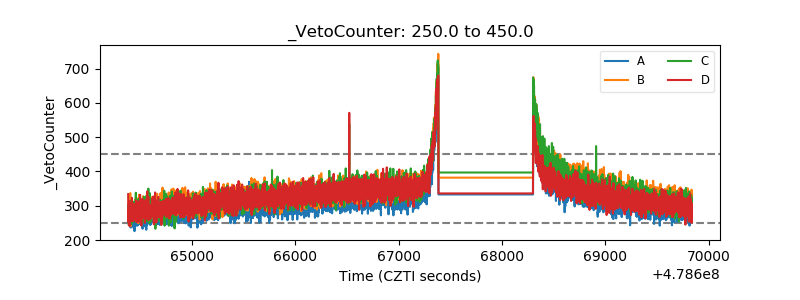 |