| Param | Original file | Final file |
|---|---|---|
| Filename | modeM0/AS1C07_001T02_9000006452_50999cztM0_level2.fits | modeM0/AS1C07_001T02_9000006452_50999cztM0_level2_quad_clean.evt |
| Size (bytes) | 533,393,280 | 89,628,480 |
| Size | 508.7 MB | 85.5 MB |
| Events in quadrant A | 4,961,687 | 577,878 |
| Events in quadrant B | 3,964,341 | 628,900 |
| Events in quadrant C | 5,234,178 | 545,164 |
| Events in quadrant D | 5,090,711 | 518,027 |
| Mode SS | |||
|---|---|---|---|
| Quadrant | BADHDUFLAG | Total packets | Discarded packets |
| A | 0 | 128 | 0 |
| B | 0 | 128 | 0 |
| C | 0 | 128 | 0 |
| D | 0 | 128 | 0 |
| Mode M9 | |||
|---|---|---|---|
| Quadrant | BADHDUFLAG | Total packets | Discarded packets |
| A | 0 | 11 | 0 |
| B | 0 | 11 | 0 |
| C | 0 | 11 | 0 |
| D | 0 | 11 | 0 |
| Mode M0 | |||
|---|---|---|---|
| Quadrant | BADHDUFLAG | Total packets | Discarded packets |
| A | 0 | 19153 | 1 |
| B | 0 | 16291 | 1 |
| C | 0 | 19938 | 1 |
| D | 0 | 19748 | 1 |
| Quadrant | Total seconds | Saturated seconds | Saturation percentage |
|---|---|---|---|
| A | 6363 | 341 | 5.359107% |
| B | 6364 | 322 | 5.059711% |
| C | 6364 | 505 | 7.935261% |
| D | 6364 | 401 | 6.301069% |
Noise dominated data is calculated using 1-second bins in cleaned event files. If a bin has >2000 counts, and if more than 50% of those come from <1% of pixels, then it is considered to be noise-dominated and hence unusable.
| Quadrant | # 1 sec bins | Bins with >0 counts | Bins with >2000 counts | High rate bins dominated by noise | Noise dominated (total time) | Noise dominated (detector-on time) | Marked lightcurve |
|---|---|---|---|---|---|---|---|
| A | 7398 | 6364 | 224 | 224 | 3.03% | 3.52% |  |
| B | 7399 | 6365 | 179 | 179 | 2.42% | 2.81% |  |
| C | 7399 | 6365 | 497 | 497 | 6.72% | 7.81% | 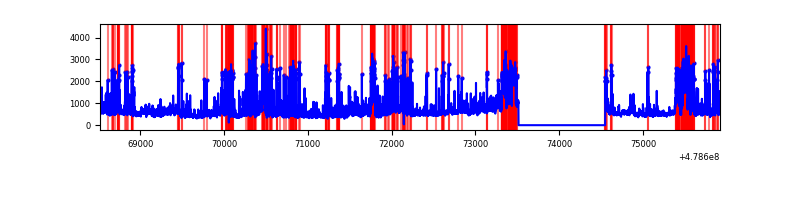 |
| D | 7399 | 6365 | 386 | 386 | 5.22% | 6.06% | 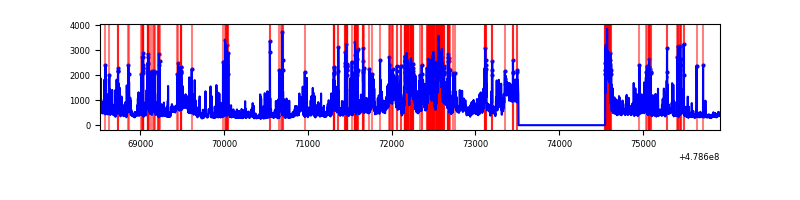 |
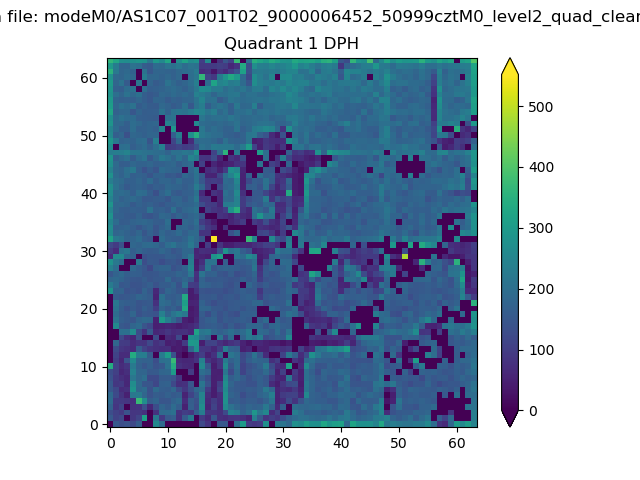
Top three noisy pixels from each quadrant. If the there are fewer than three noisy pixels in the level2.evt file, extra rows are filled as -1
| Pixel properties | Quadrant properties | ||||||
|---|---|---|---|---|---|---|---|
| Quadrant | DetID | PixID | Counts | Sigma | Mean | Median | Sigma |
| A | 12 | 80 | 1492072 | 9143.76 | 650 | 633 | 163.1 |
| A | 4 | 4 | 111253 | 678.19 | 650 | 633 | 163.1 |
| A | 5 | 240 | 98890 | 602.4 | 650 | 633 | 163.1 |
| B | 12 | 32 | 727039 | 5342.34 | 645 | 624 | 136.0 |
| B | 1 | 223 | 123720 | 905.3 | 645 | 624 | 136.0 |
| B | 4 | 206 | 113035 | 826.71 | 645 | 624 | 136.0 |
| C | 1 | 44 | 625165 | 3637.35 | 618 | 614 | 171.7 |
| C | 12 | 247 | 546064 | 3176.67 | 618 | 614 | 171.7 |
| C | 13 | 3 | 544684 | 3168.63 | 618 | 614 | 171.7 |
| D | 8 | 176 | 694531 | 4005.61 | 613 | 590 | 173.2 |
| D | 2 | 153 | 461417 | 2660.02 | 613 | 590 | 173.2 |
| D | 2 | 216 | 438695 | 2528.86 | 613 | 590 | 173.2 |
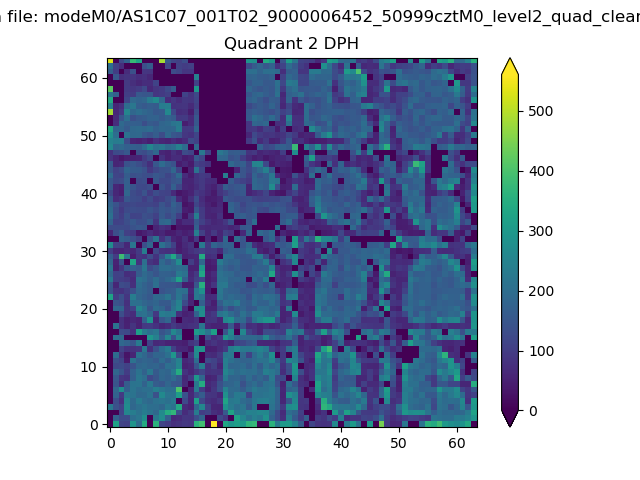
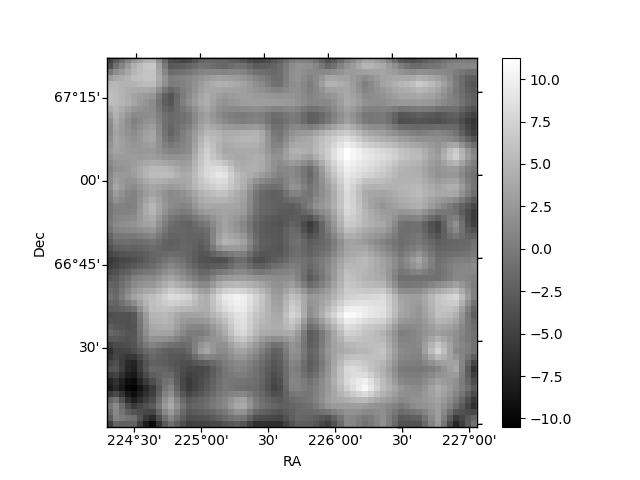
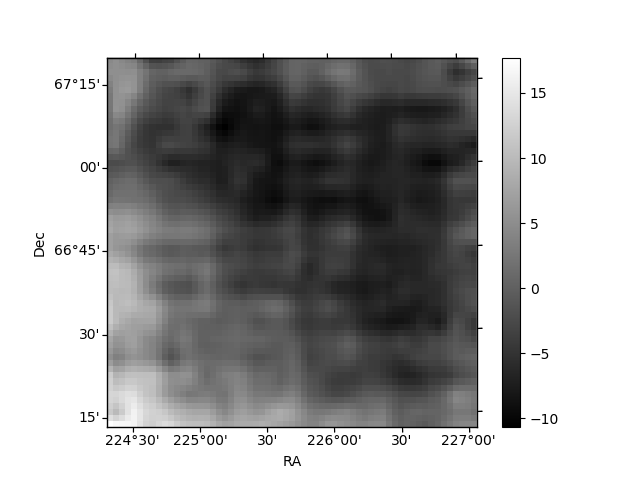
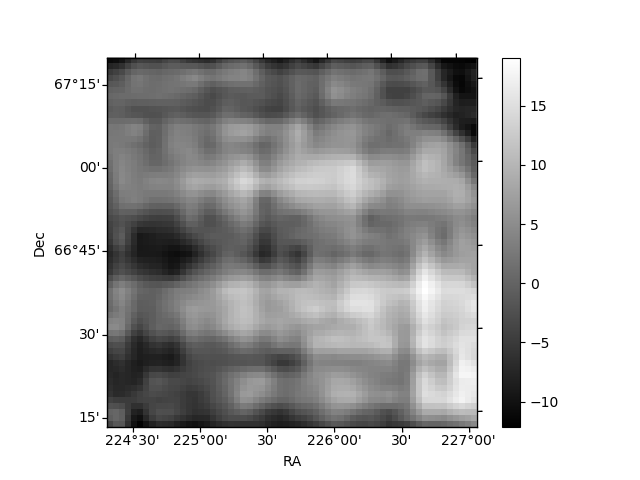
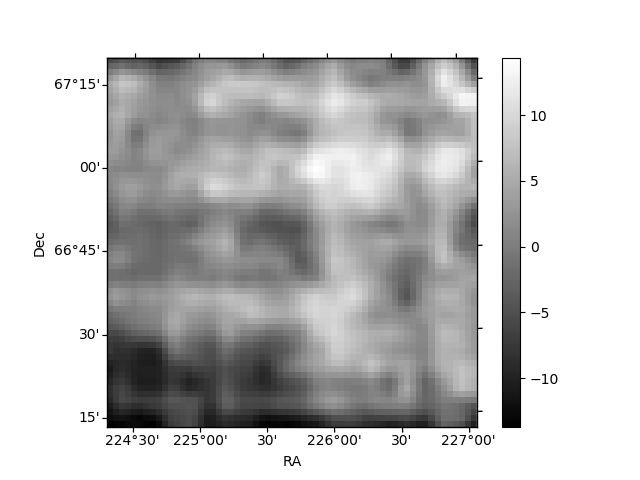
Histogram calculated using DETX and DETY for each event in the final _common_clean file
| Quadrant A | 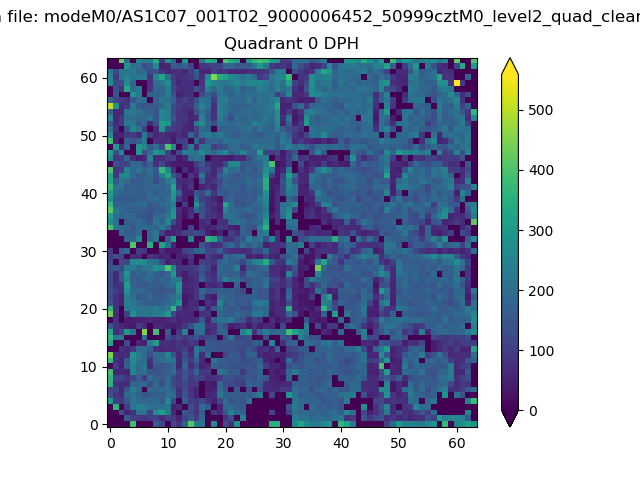 |
 |
Quadrant B |
|---|---|---|---|
| Quadrant D | 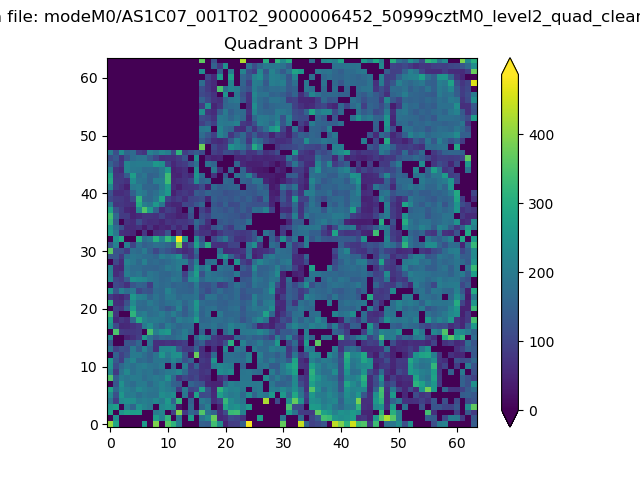 |
 |
Quadrant C |
| Plot type | Count rate plots | Images |
|---|---|---|
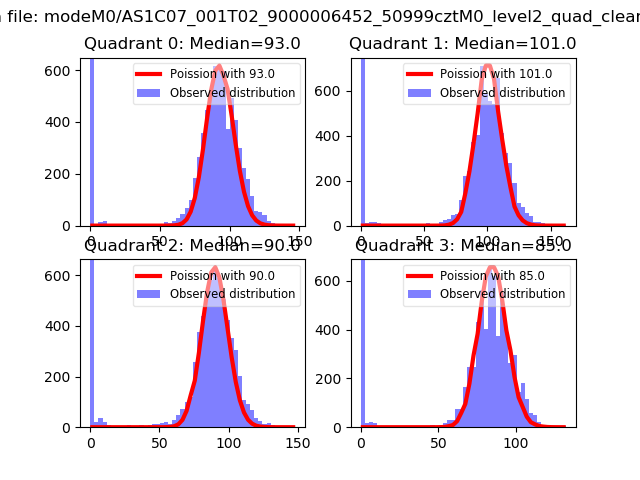
| Comparison with Poisson distribution Blue bars denote a histogram of data divided into 1 sec bins. Red curve is a Poisson curve with rate = median count rate of data. |
 |
 |
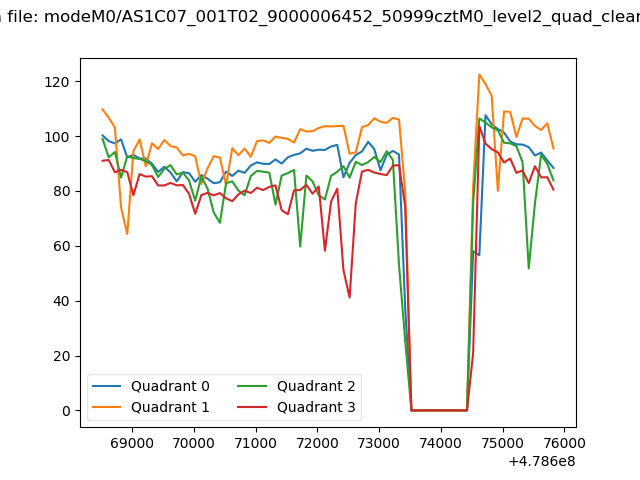
| Quadrant-wise count rates Data is divided into 100 sec bins |
 |
|
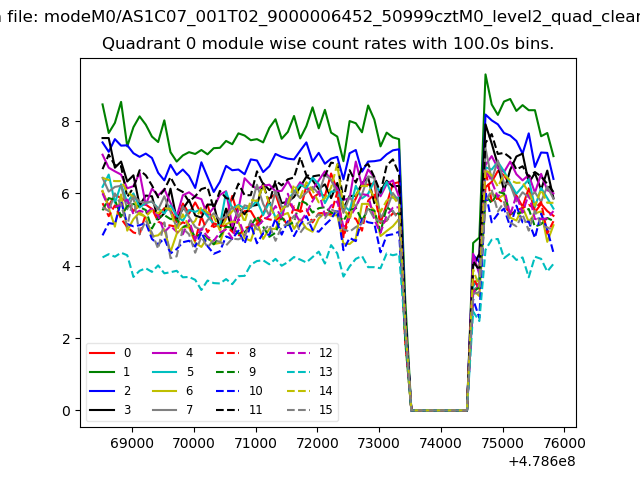
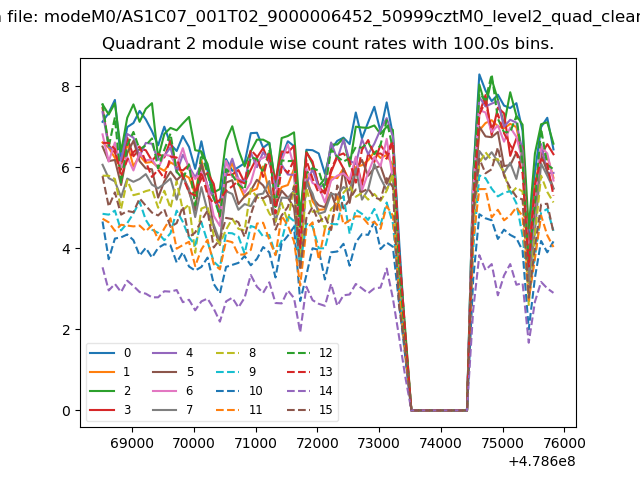
| Module-wise count rates for Quadrant A Data is divided into 100 sec bins |
 |
 |
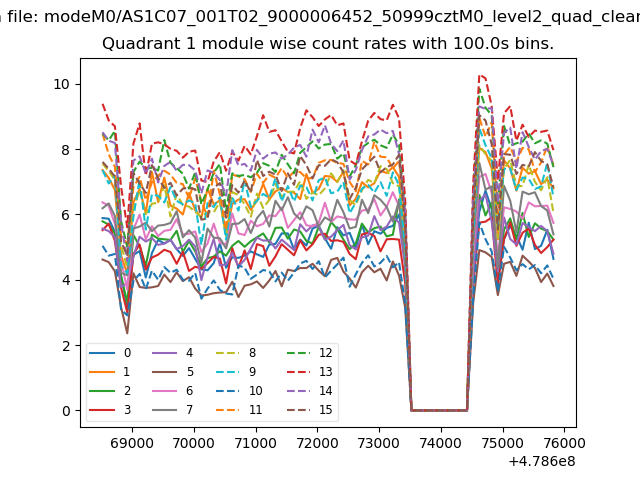
| Module-wise count rates for Quadrant B Data is divided into 100 sec bins |
 |
 |
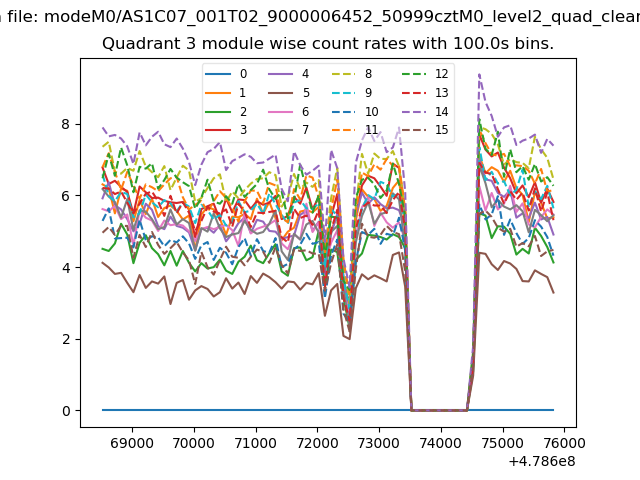
| Module-wise count rates for Quadrant C Data is divided into 100 sec bins |
 |
 |
| Module-wise count rates for Quadrant D Data is divided into 100 sec bins |
 |
 |
| Parameter | Plot |
|---|---|
| CZT HV Monitor | 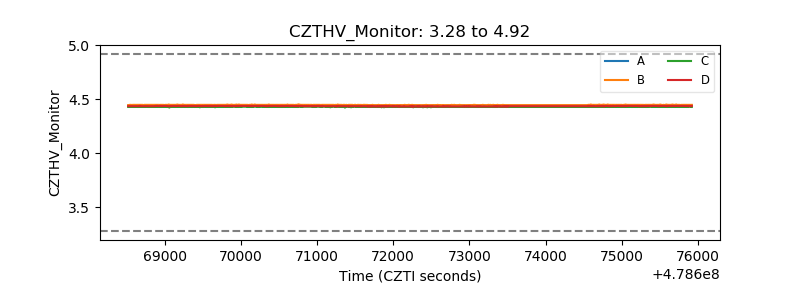 |
| D_VDD | 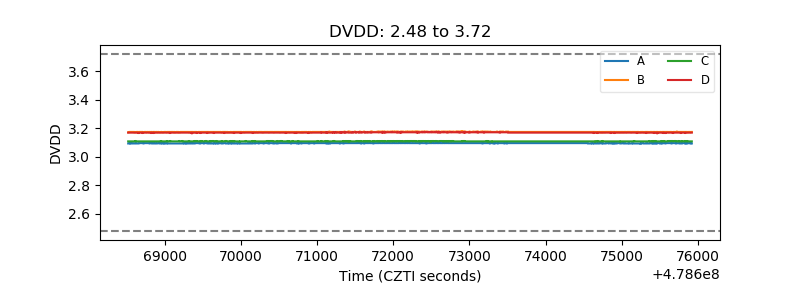 |
| Temperature 1 | 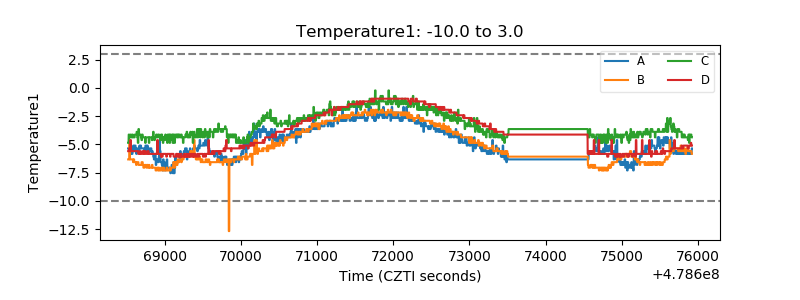 |
| Veto HV Monitor | 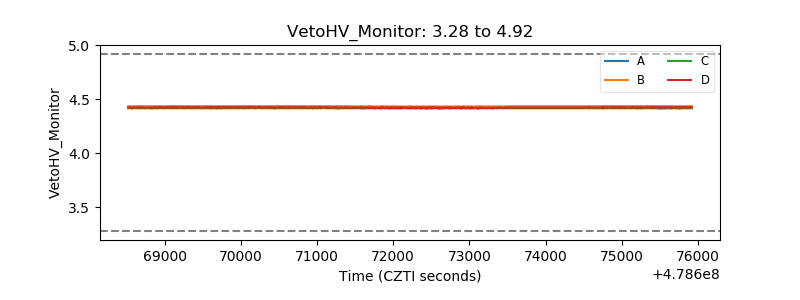 |
| Veto LLD | 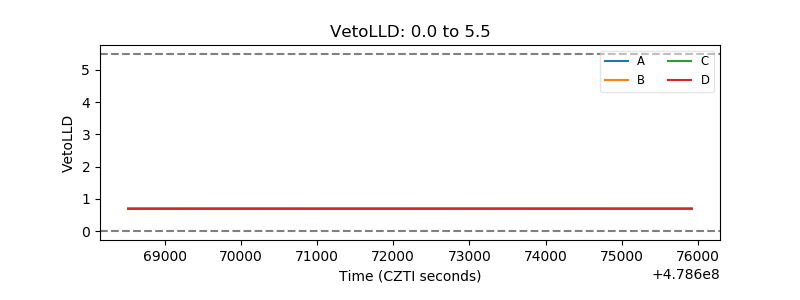 |
| Alpha Counter | 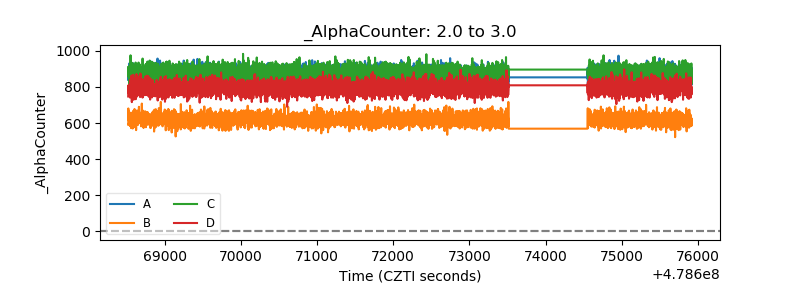 |
| _CPM_Rate | 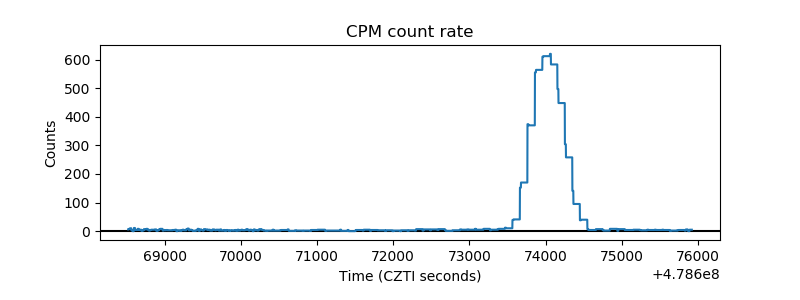 |
| CZT Counter | 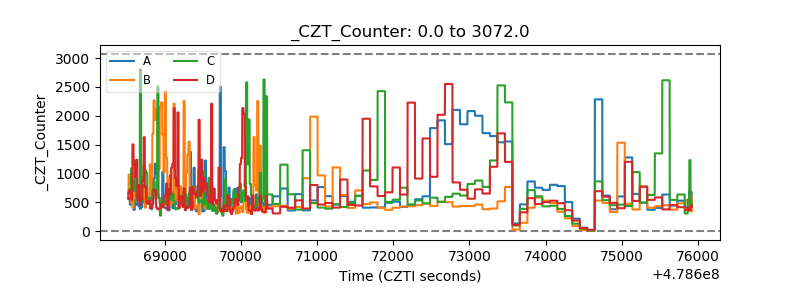 |
| +2.5 Volts monitor | 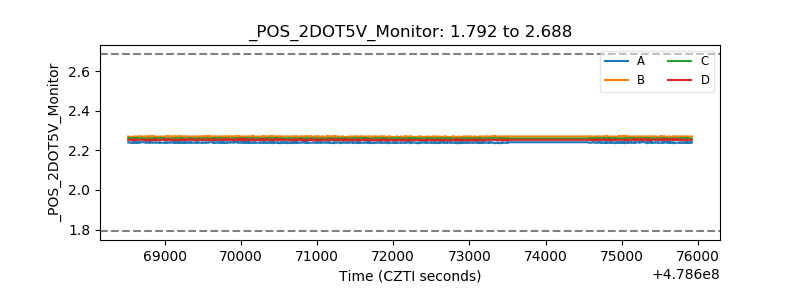 |
| +5 Volts monitor |  |
| _ROLL_ROT | 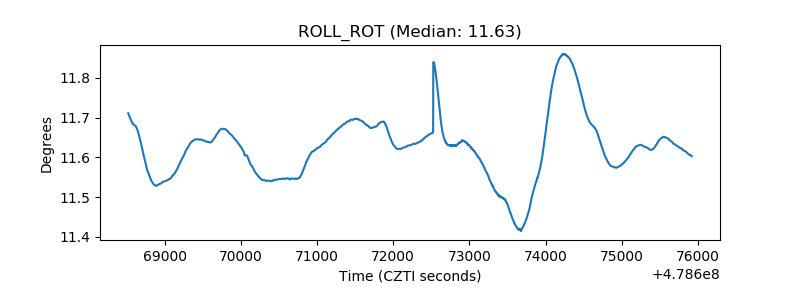 |
| _Roll_DEC | 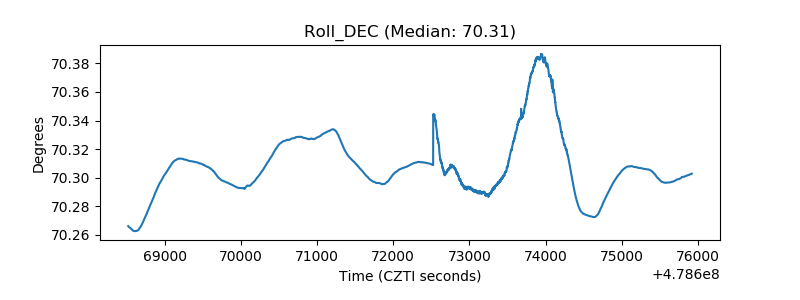 |
| _Roll_RA | 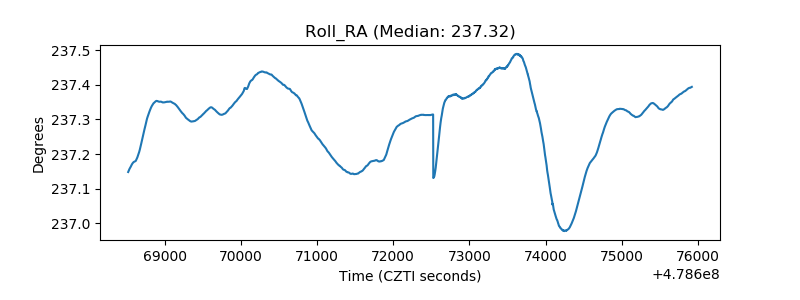 |
| Veto Counter | 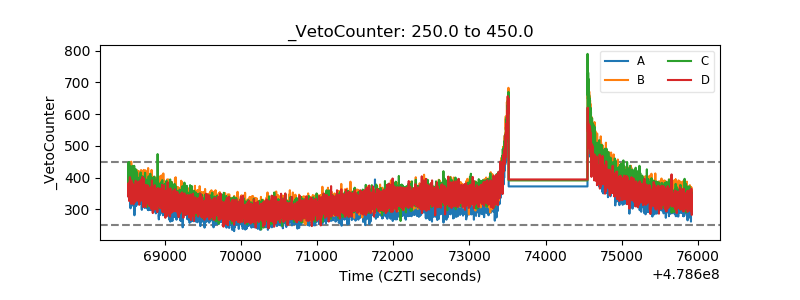 |