| Param | Original file | Final file |
|---|---|---|
| Filename | modeM0/AS1C07_001T02_9000006452_51000cztM0_level2.fits | modeM0/AS1C07_001T02_9000006452_51000cztM0_level2_quad_clean.evt |
| Size (bytes) | 334,641,600 | 60,405,120 |
| Size | 319.1 MB | 57.6 MB |
| Events in quadrant A | 3,170,390 | 378,900 |
| Events in quadrant B | 2,829,578 | 424,886 |
| Events in quadrant C | 3,422,576 | 365,276 |
| Events in quadrant D | 2,636,110 | 362,119 |
| Mode SS | |||
|---|---|---|---|
| Quadrant | BADHDUFLAG | Total packets | Discarded packets |
| A | 0 | 106 | 18 |
| B | 0 | 104 | 15 |
| C | 0 | 104 | 14 |
| D | 0 | 104 | 14 |
| Mode M9 | |||
|---|---|---|---|
| Quadrant | BADHDUFLAG | Total packets | Discarded packets |
| A | 0 | 11 | 0 |
| B | 0 | 11 | 0 |
| C | 0 | 13 | 2 |
| D | 0 | 10 | 0 |
| Mode M0 | |||
|---|---|---|---|
| Quadrant | BADHDUFLAG | Total packets | Discarded packets |
| A | 0 | 14968 | 2744 |
| B | 0 | 13716 | 2314 |
| C | 0 | 16256 | 3252 |
| D | 0 | 12832 | 1986 |
| Quadrant | Total seconds | Saturated seconds | Saturation percentage |
|---|---|---|---|
| A | 4182 | 324 | 7.747489% |
| B | 4223 | 213 | 5.043808% |
| C | 4146 | 254 | 6.126387% |
| D | 4276 | 138 | 3.227315% |
Noise dominated data is calculated using 1-second bins in cleaned event files. If a bin has >2000 counts, and if more than 50% of those come from <1% of pixels, then it is considered to be noise-dominated and hence unusable.
| Quadrant | # 1 sec bins | Bins with >0 counts | Bins with >2000 counts | High rate bins dominated by noise | Noise dominated (total time) | Noise dominated (detector-on time) | Marked lightcurve |
|---|---|---|---|---|---|---|---|
| A | 6481 | 4524 | 264 | 264 | 4.07% | 5.84% | 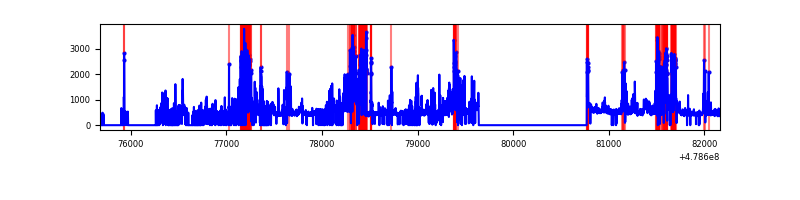 |
| B | 6477 | 4558 | 123 | 123 | 1.90% | 2.70% | 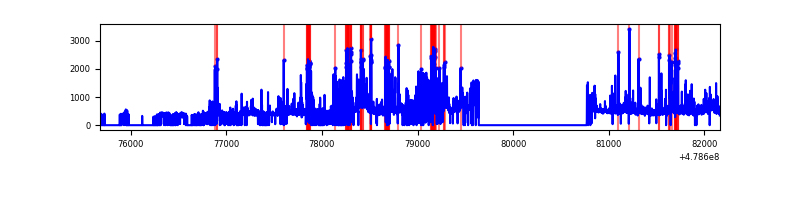 |
| C | 6479 | 4501 | 269 | 269 | 4.15% | 5.98% | 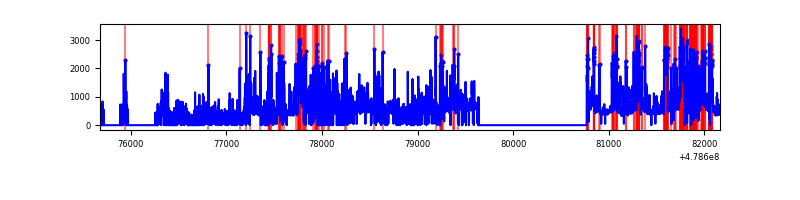 |
| D | 6483 | 4591 | 117 | 117 | 1.80% | 2.55% | 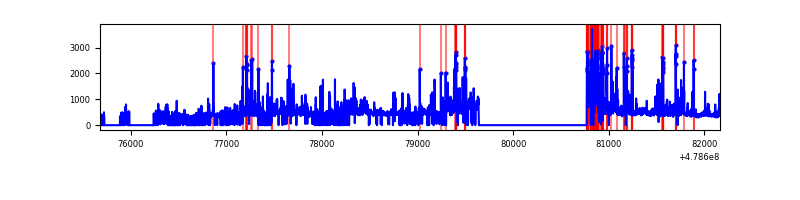 |
Top three noisy pixels from each quadrant. If the there are fewer than three noisy pixels in the level2.evt file, extra rows are filled as -1
| Pixel properties | Quadrant properties | ||||||
|---|---|---|---|---|---|---|---|
| Quadrant | DetID | PixID | Counts | Sigma | Mean | Median | Sigma |
| A | 8 | 43 | 439239 | 4025.31 | 434 | 423 | 109.0 |
| A | 15 | 239 | 371821 | 3406.87 | 434 | 423 | 109.0 |
| A | 3 | 130 | 126850 | 1159.73 | 434 | 423 | 109.0 |
| B | 4 | 170 | 506306 | 5329.34 | 441 | 427 | 94.9 |
| B | 4 | 171 | 123552 | 1297.1 | 441 | 427 | 94.9 |
| B | 4 | 81 | 90837 | 952.45 | 441 | 427 | 94.9 |
| C | 9 | 38 | 383632 | 3266.96 | 422 | 417 | 117.3 |
| C | 14 | 245 | 377847 | 3217.64 | 422 | 417 | 117.3 |
| C | 1 | 44 | 164190 | 1396.19 | 422 | 417 | 117.3 |
| D | 8 | 176 | 281949 | 2311.16 | 434 | 418 | 121.8 |
| D | 2 | 153 | 157293 | 1287.82 | 434 | 418 | 121.8 |
| D | 3 | 12 | 106096 | 867.54 | 434 | 418 | 121.8 |
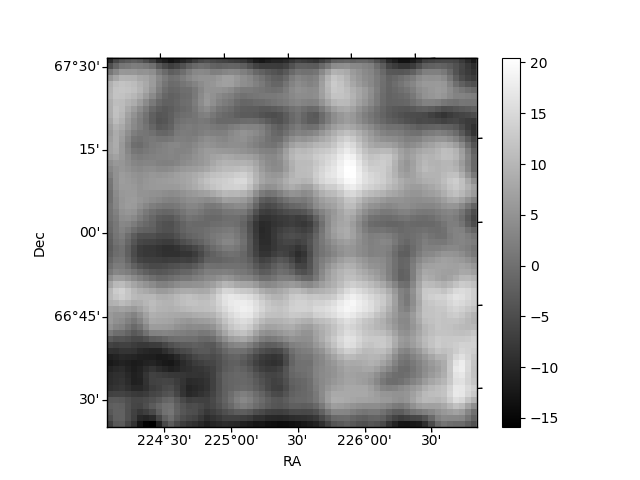
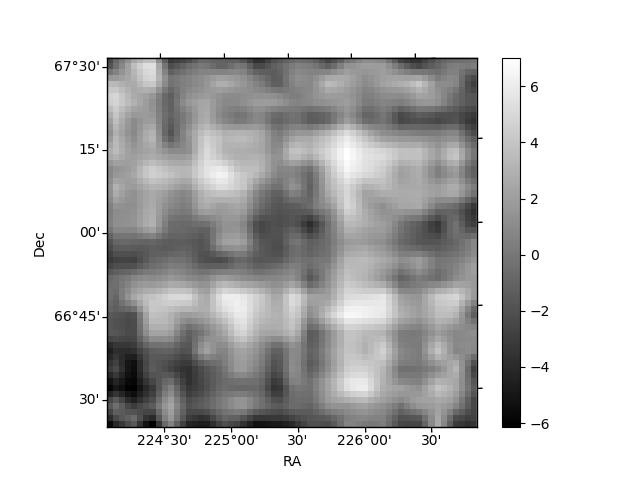
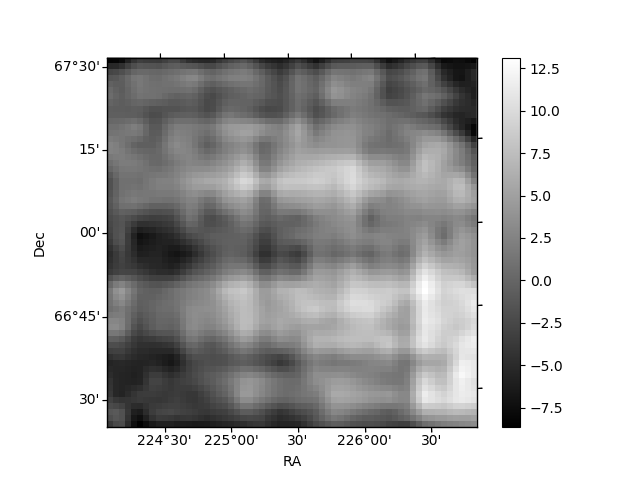
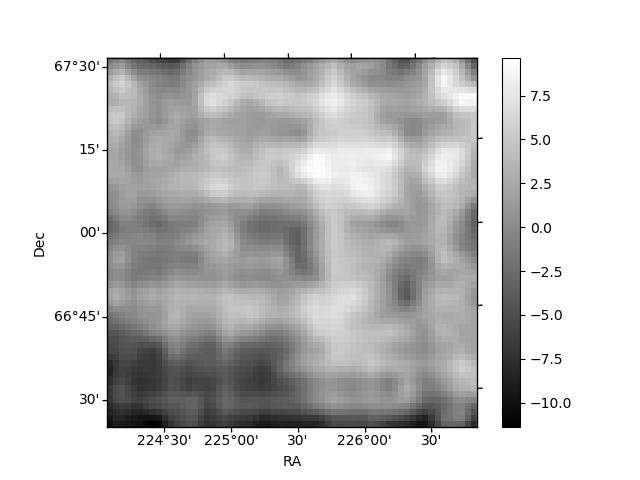
Histogram calculated using DETX and DETY for each event in the final _common_clean file
| Quadrant A | 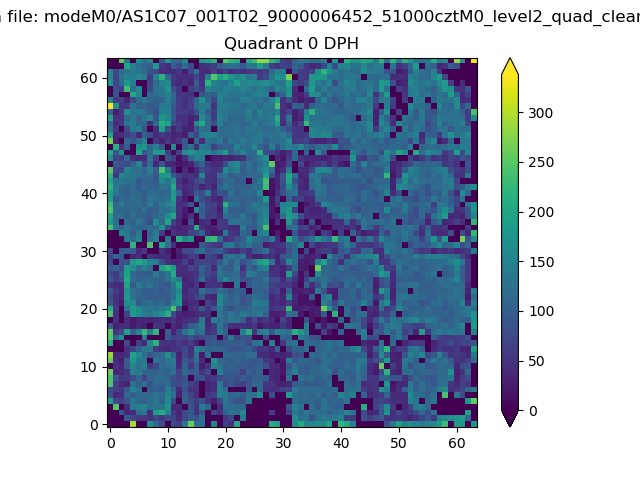 |
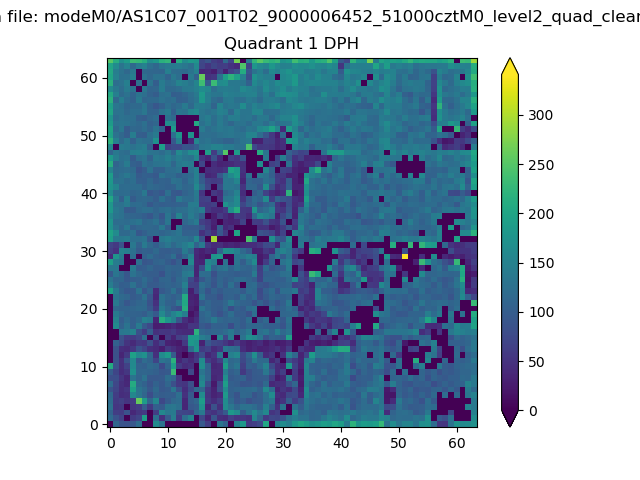 |
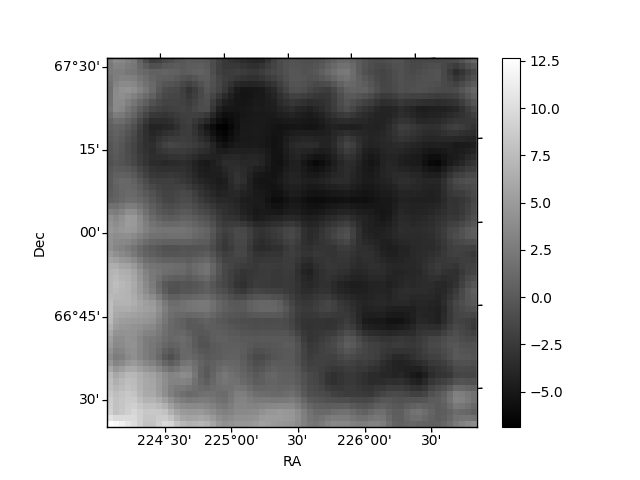
Quadrant B |
|---|---|---|---|
| Quadrant D | 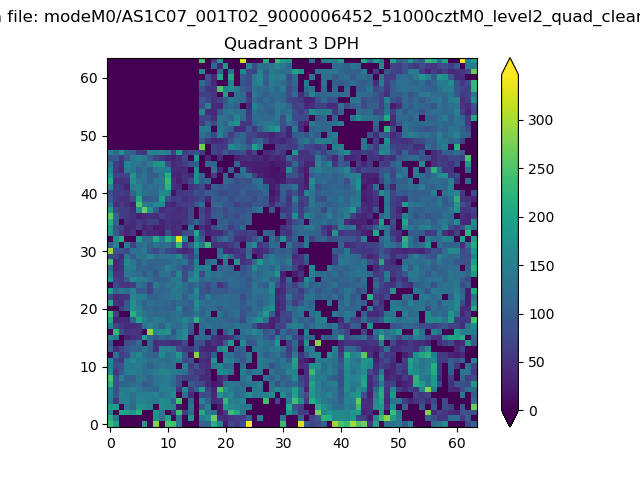 |
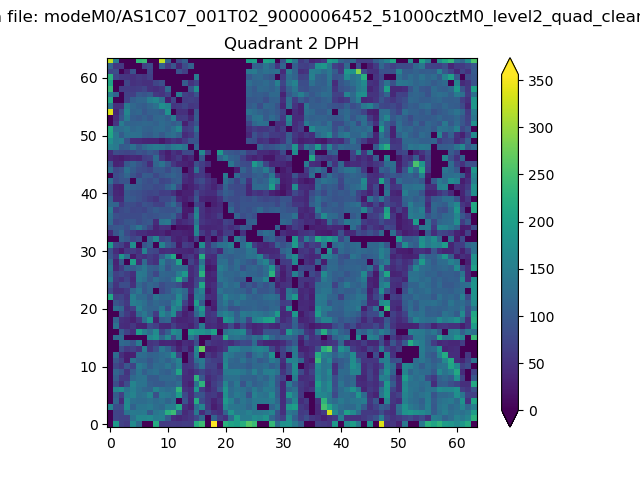 |
Quadrant C |
| Plot type | Count rate plots | Images |
|---|---|---|
| Comparison with Poisson distribution Blue bars denote a histogram of data divided into 1 sec bins. Red curve is a Poisson curve with rate = median count rate of data. |
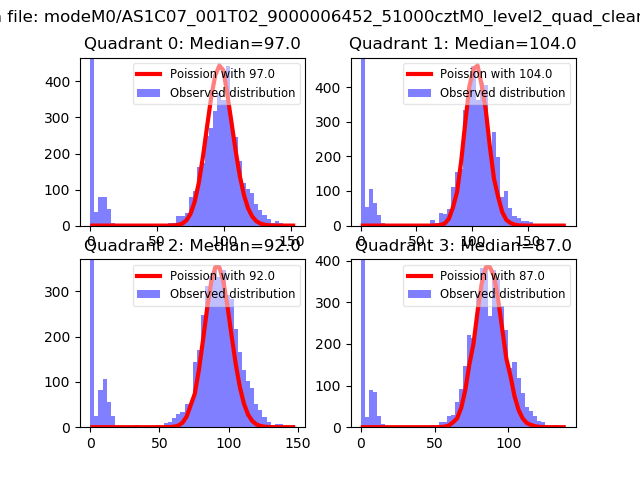 |
 |
| Quadrant-wise count rates Data is divided into 100 sec bins |
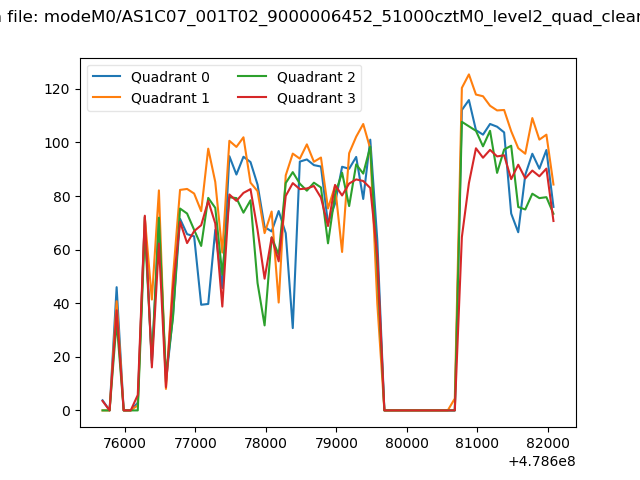 |
|
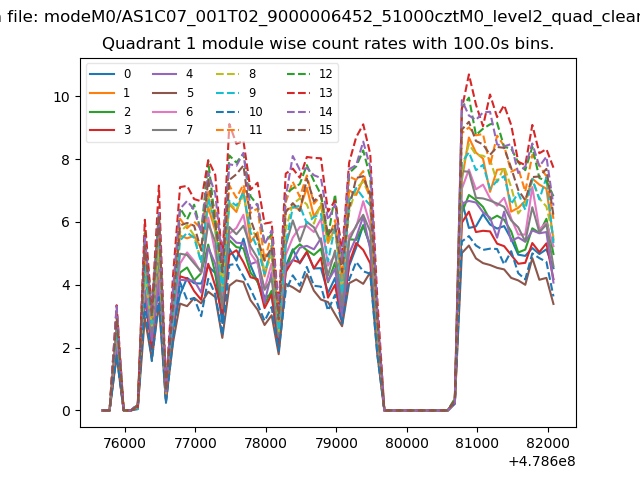
| Module-wise count rates for Quadrant A Data is divided into 100 sec bins |
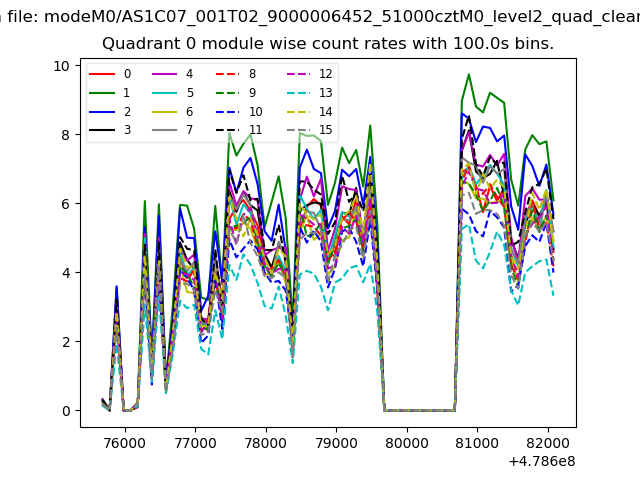 |
 |
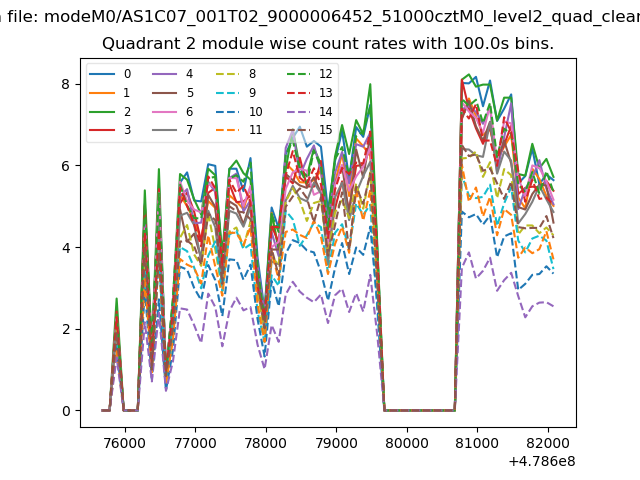
| Module-wise count rates for Quadrant B Data is divided into 100 sec bins |
 |
 |
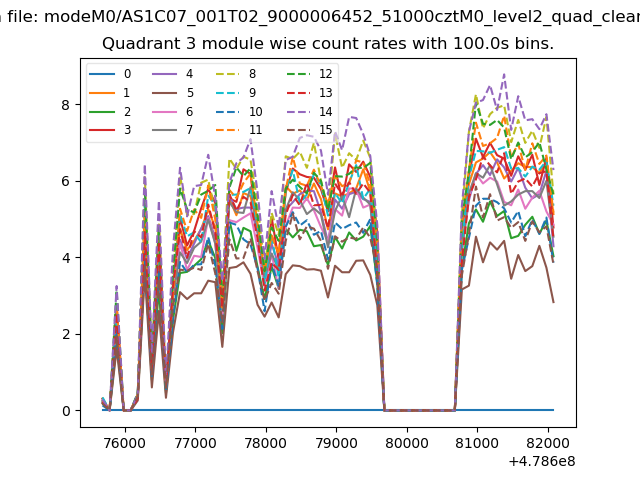
| Module-wise count rates for Quadrant C Data is divided into 100 sec bins |
 |
 |
| Module-wise count rates for Quadrant D Data is divided into 100 sec bins |
 |
 |
| Parameter | Plot |
|---|---|
| CZT HV Monitor | 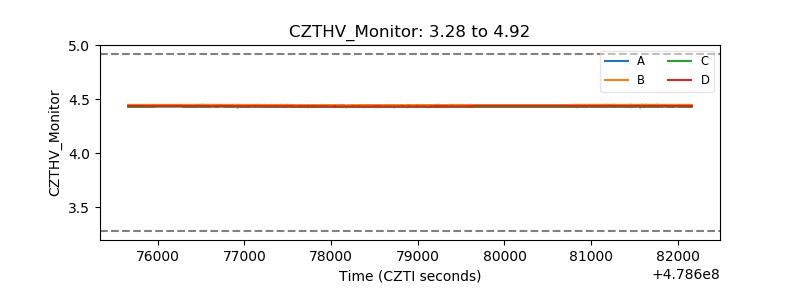 |
| D_VDD | 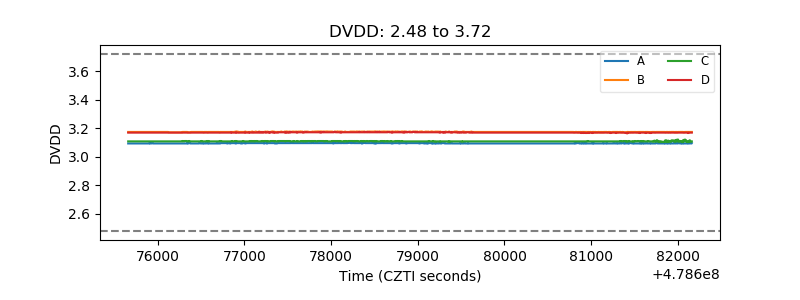 |
| Temperature 1 | 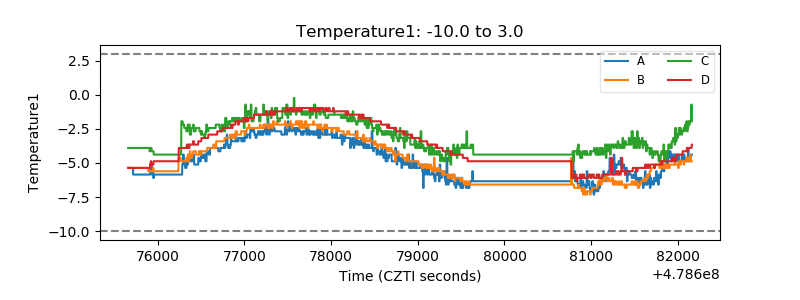 |
| Veto HV Monitor | 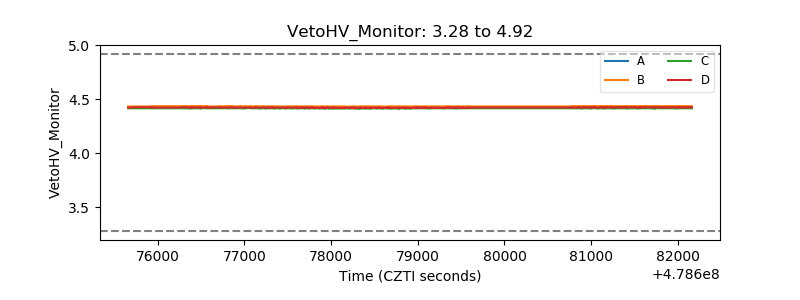 |
| Veto LLD | 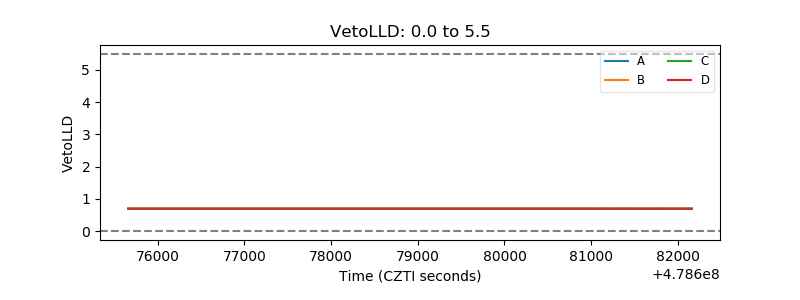 |
| Alpha Counter | 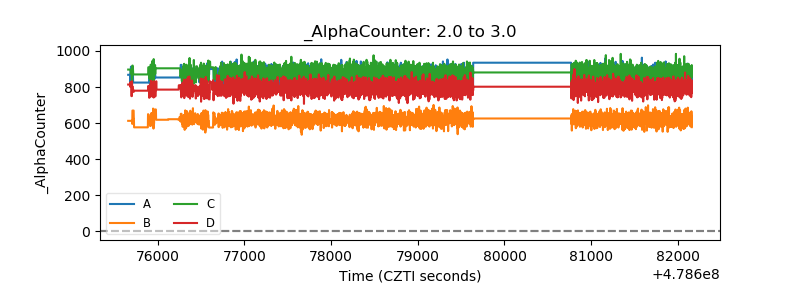 |
| _CPM_Rate | 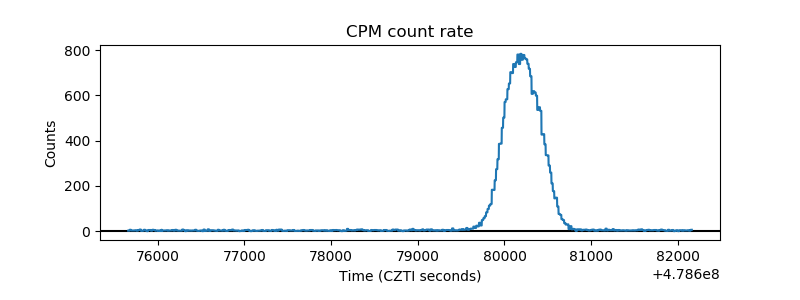 |
| CZT Counter | 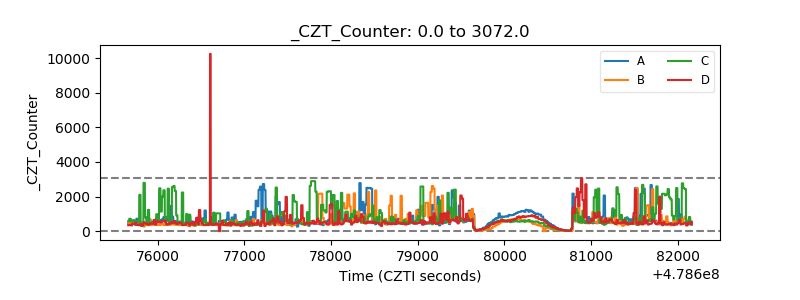 |
| +2.5 Volts monitor | 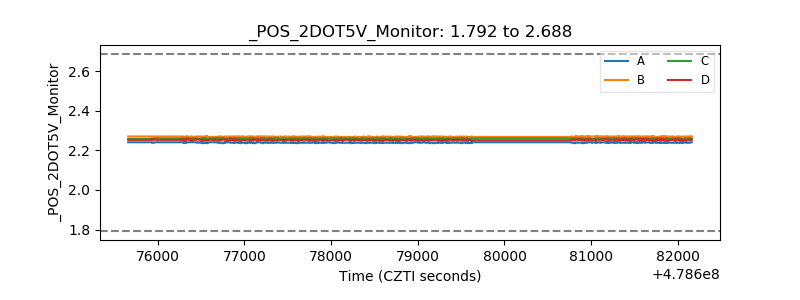 |
| +5 Volts monitor | 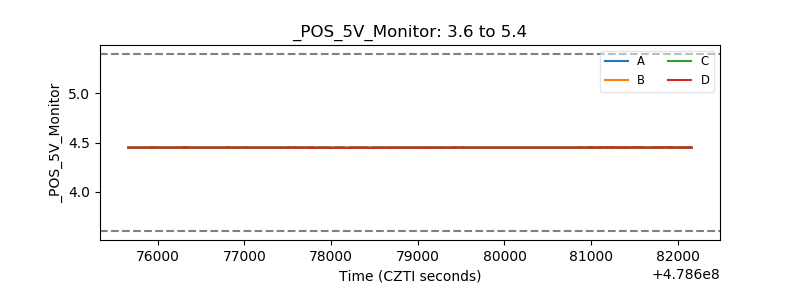 |
| _ROLL_ROT | 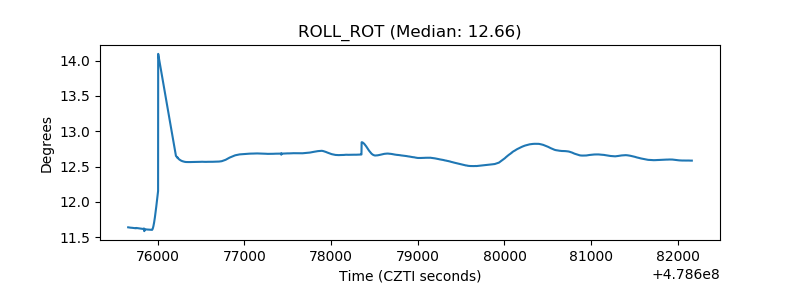 |
| _Roll_DEC | 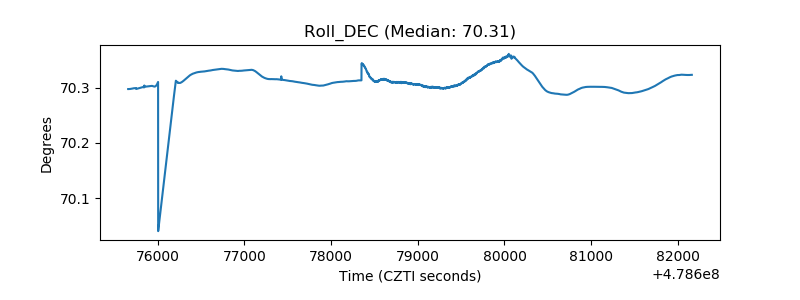 |
| _Roll_RA | 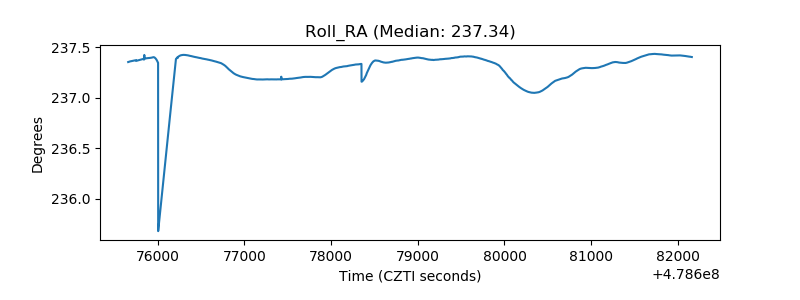 |
| Veto Counter | 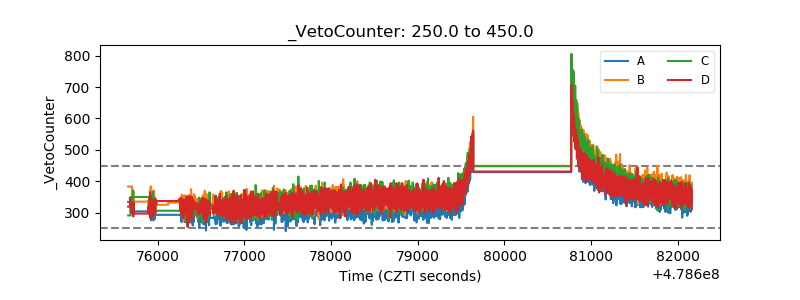 |