| Param | Original file | Final file |
|---|---|---|
| Filename | modeM0/AS1C07_001T02_9000006452_51002cztM0_level2.fits | modeM0/AS1C07_001T02_9000006452_51002cztM0_level2_quad_clean.evt |
| Size (bytes) | 476,288,640 | 87,287,040 |
| Size | 454.2 MB | 83.2 MB |
| Events in quadrant A | 4,663,285 | 553,119 |
| Events in quadrant B | 4,876,390 | 607,002 |
| Events in quadrant C | 3,916,798 | 544,719 |
| Events in quadrant D | 3,710,190 | 520,719 |
| Mode SS | |||
|---|---|---|---|
| Quadrant | BADHDUFLAG | Total packets | Discarded packets |
| A | 0 | 122 | 0 |
| B | 0 | 122 | 0 |
| C | 0 | 122 | 0 |
| D | 0 | 122 | 0 |
| Mode M9 | |||
|---|---|---|---|
| Quadrant | BADHDUFLAG | Total packets | Discarded packets |
| A | 0 | 11 | 0 |
| B | 0 | 11 | 0 |
| C | 0 | 11 | 0 |
| D | 0 | 11 | 0 |
| Mode M0 | |||
|---|---|---|---|
| Quadrant | BADHDUFLAG | Total packets | Discarded packets |
| A | 0 | 17848 | 1 |
| B | 0 | 18573 | 1 |
| C | 0 | 15753 | 1 |
| D | 0 | 15210 | 1 |
| Quadrant | Total seconds | Saturated seconds | Saturation percentage |
|---|---|---|---|
| A | 5974 | 500 | 8.369602% |
| B | 5974 | 414 | 6.930030% |
| C | 5975 | 281 | 4.702929% |
| D | 5975 | 176 | 2.945607% |
Noise dominated data is calculated using 1-second bins in cleaned event files. If a bin has >2000 counts, and if more than 50% of those come from <1% of pixels, then it is considered to be noise-dominated and hence unusable.
| Quadrant | # 1 sec bins | Bins with >0 counts | Bins with >2000 counts | High rate bins dominated by noise | Noise dominated (total time) | Noise dominated (detector-on time) | Marked lightcurve |
|---|---|---|---|---|---|---|---|
| A | 7089 | 5975 | 332 | 332 | 4.68% | 5.56% | 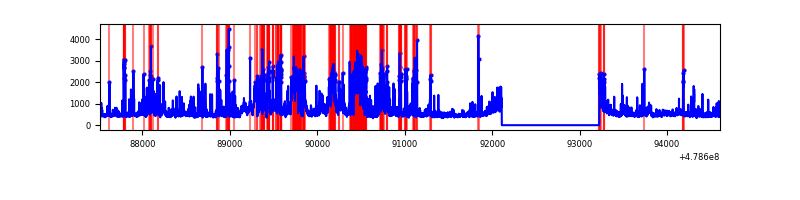 |
| B | 7089 | 5975 | 243 | 243 | 3.43% | 4.07% | 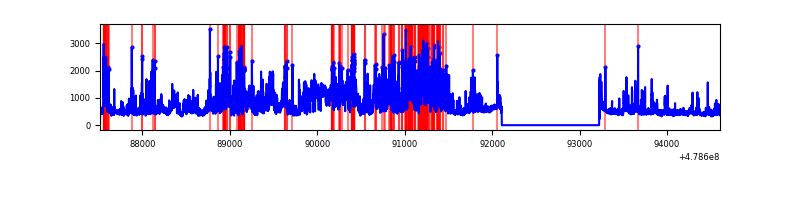 |
| C | 7090 | 5976 | 216 | 216 | 3.05% | 3.61% | 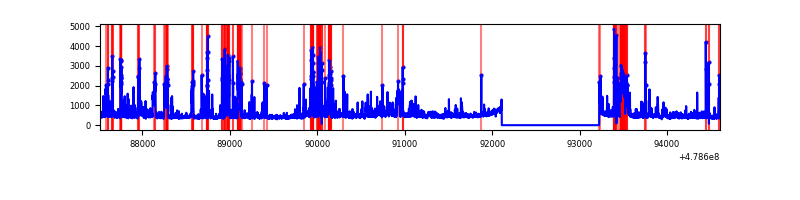 |
| D | 7090 | 5976 | 109 | 109 | 1.54% | 1.82% | 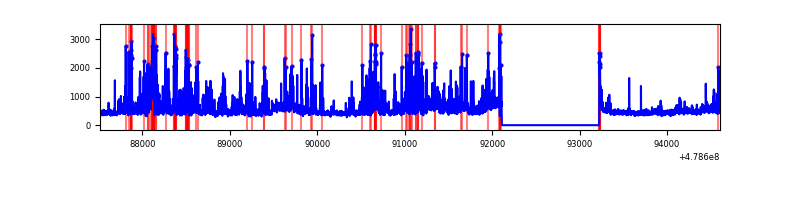 |
Top three noisy pixels from each quadrant. If the there are fewer than three noisy pixels in the level2.evt file, extra rows are filled as -1
| Pixel properties | Quadrant properties | ||||||
|---|---|---|---|---|---|---|---|
| Quadrant | DetID | PixID | Counts | Sigma | Mean | Median | Sigma |
| A | 10 | 253 | 381045 | 2445.18 | 626 | 612 | 155.6 |
| A | 3 | 130 | 334867 | 2148.38 | 626 | 612 | 155.6 |
| A | 12 | 80 | 323745 | 2076.89 | 626 | 612 | 155.6 |
| B | 4 | 170 | 901763 | 6733.14 | 622 | 599 | 133.8 |
| B | 12 | 32 | 634002 | 4732.54 | 622 | 599 | 133.8 |
| B | 4 | 171 | 302529 | 2255.9 | 622 | 599 | 133.8 |
| C | 15 | 1 | 348827 | 2094.36 | 607 | 603 | 166.3 |
| C | 14 | 245 | 314506 | 1887.94 | 607 | 603 | 166.3 |
| C | 13 | 3 | 292967 | 1758.39 | 607 | 603 | 166.3 |
| D | 10 | 181 | 460345 | 2686.06 | 613 | 589 | 171.2 |
| D | 15 | 172 | 131688 | 765.93 | 613 | 589 | 171.2 |
| D | 7 | 39 | 111998 | 650.89 | 613 | 589 | 171.2 |
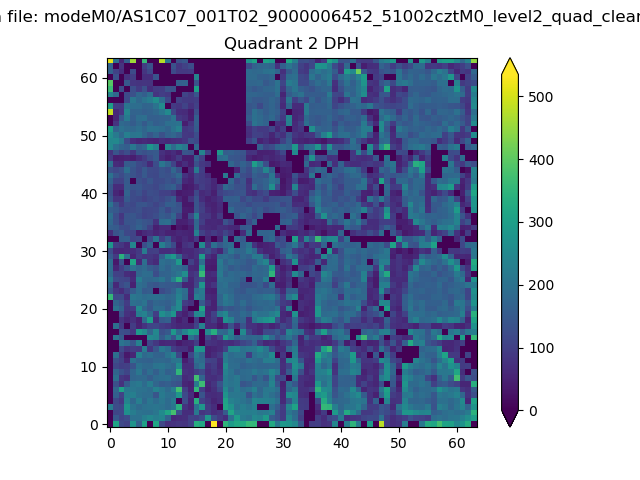
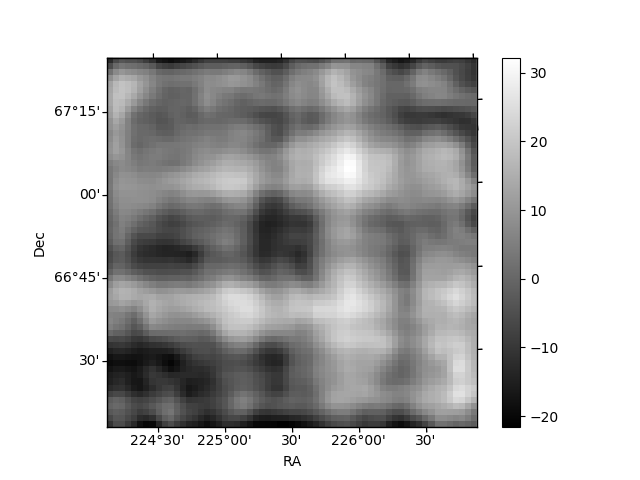
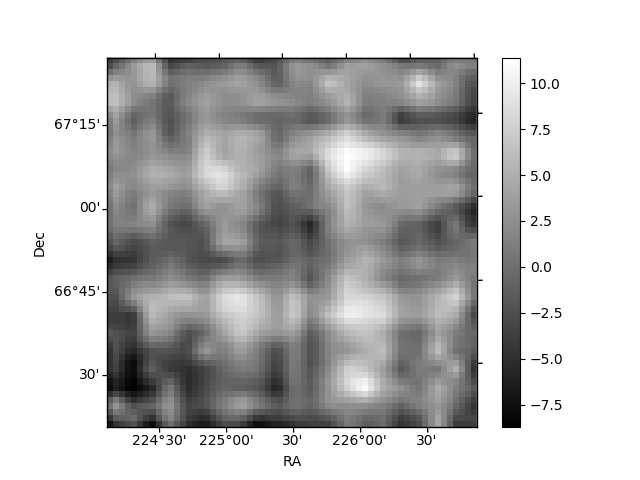
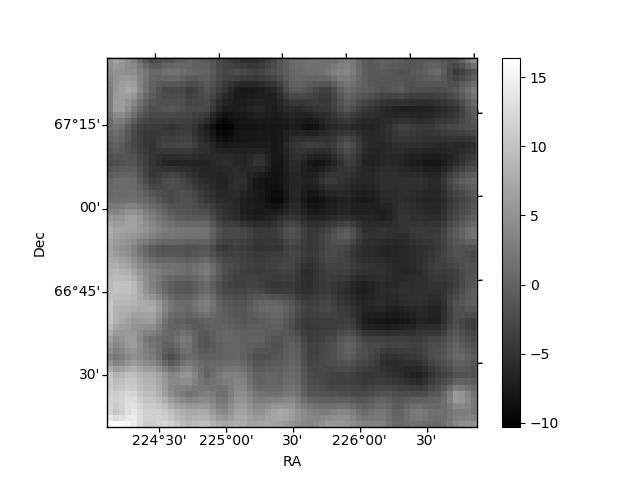
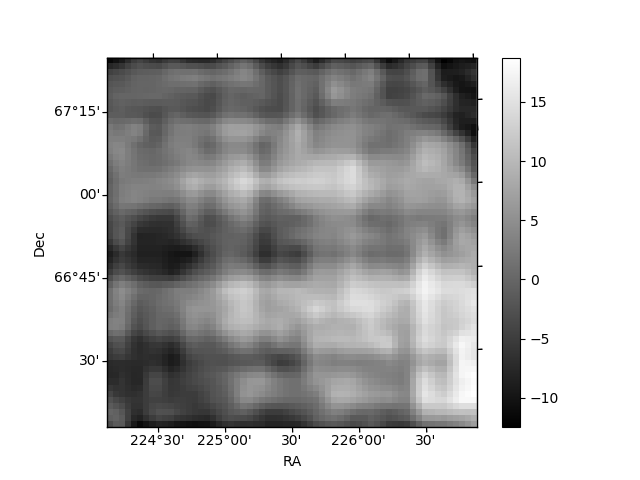
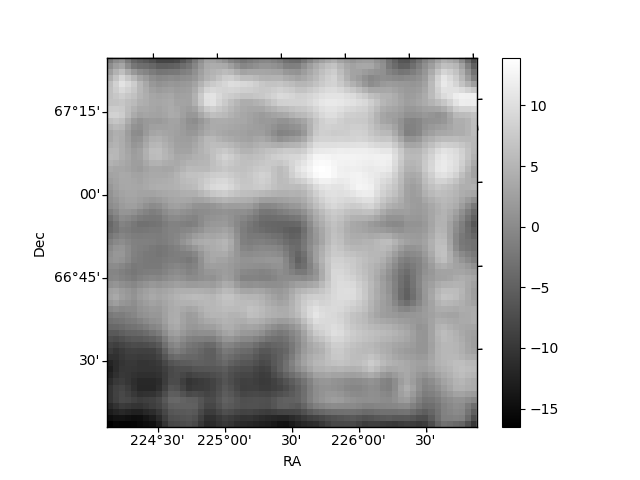
Histogram calculated using DETX and DETY for each event in the final _common_clean file
| Quadrant A | 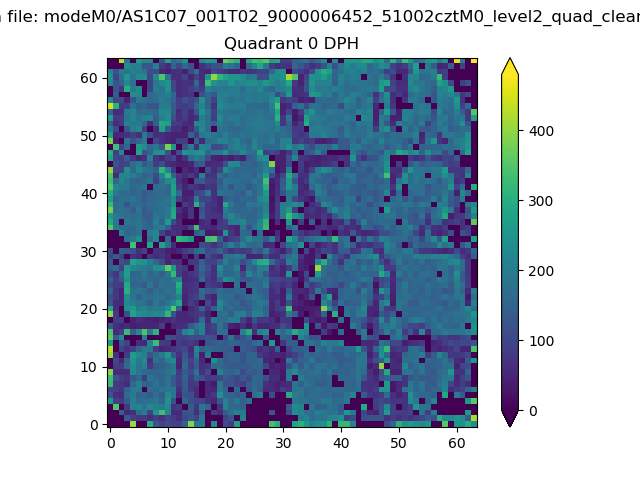 |
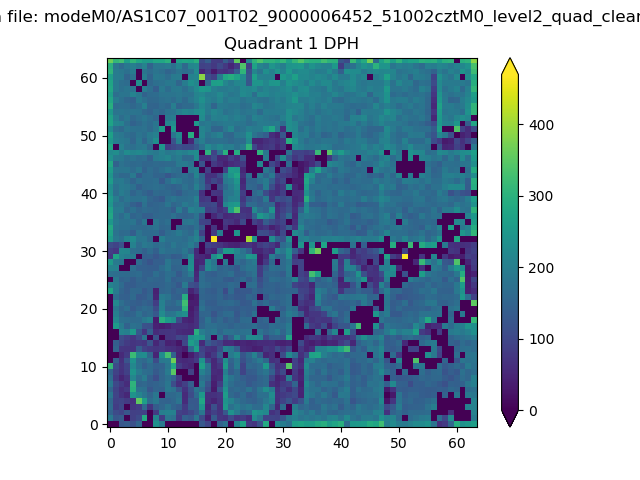 |
Quadrant B |
|---|---|---|---|
| Quadrant D | 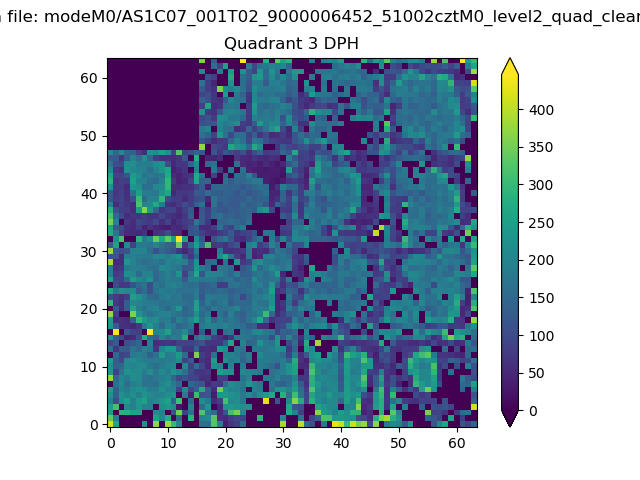 |
 |
Quadrant C |
| Plot type | Count rate plots | Images |
|---|---|---|
| Comparison with Poisson distribution Blue bars denote a histogram of data divided into 1 sec bins. Red curve is a Poisson curve with rate = median count rate of data. |
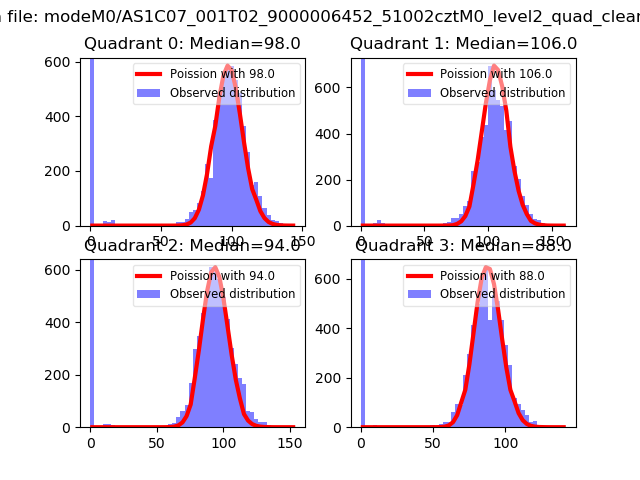 |
 |
| Quadrant-wise count rates Data is divided into 100 sec bins |
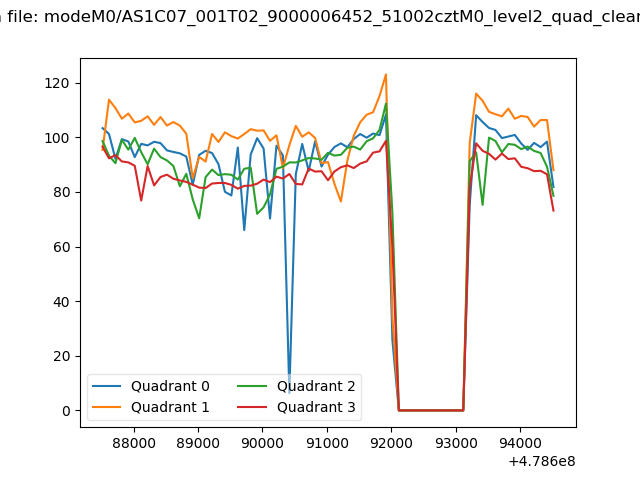 |
|
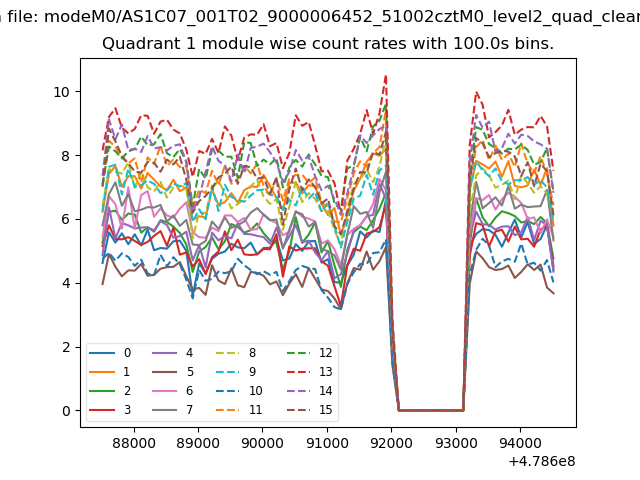
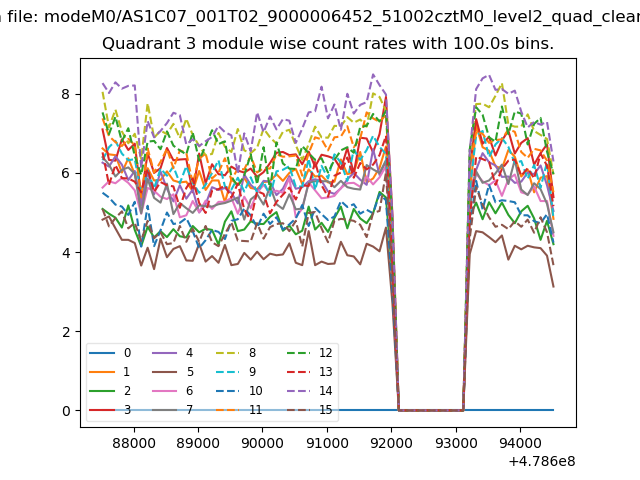
| Module-wise count rates for Quadrant A Data is divided into 100 sec bins |
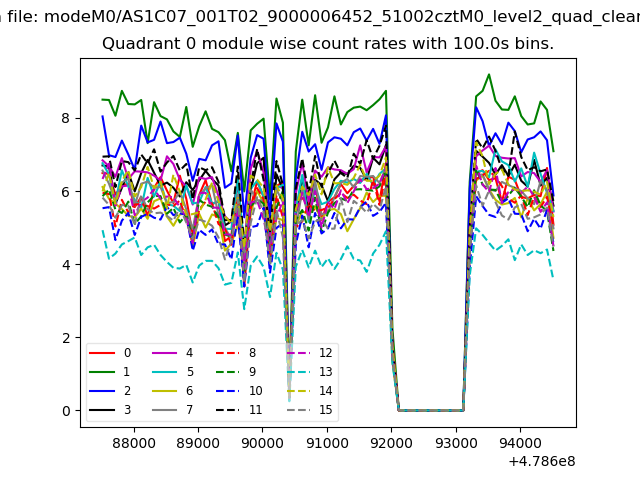 |
 |
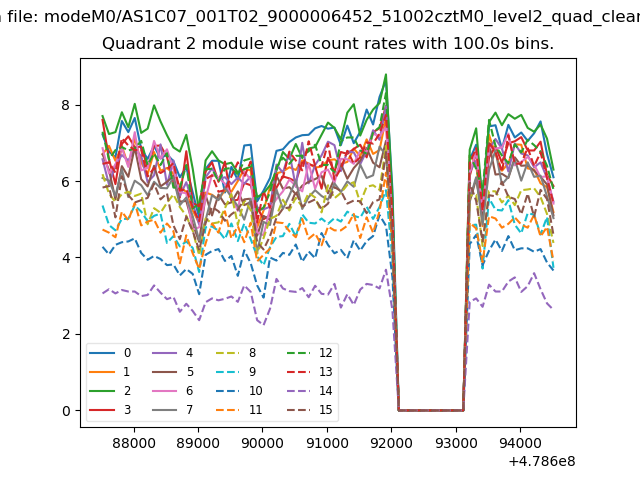
| Module-wise count rates for Quadrant B Data is divided into 100 sec bins |
 |
 |
| Module-wise count rates for Quadrant C Data is divided into 100 sec bins |
 |
 |
| Module-wise count rates for Quadrant D Data is divided into 100 sec bins |
 |
 |
| Parameter | Plot |
|---|---|
| CZT HV Monitor | 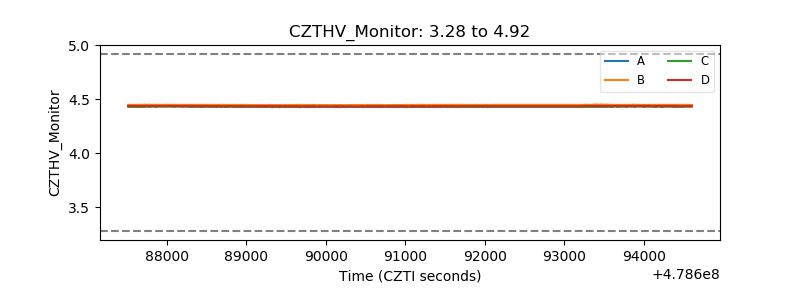 |
| D_VDD | 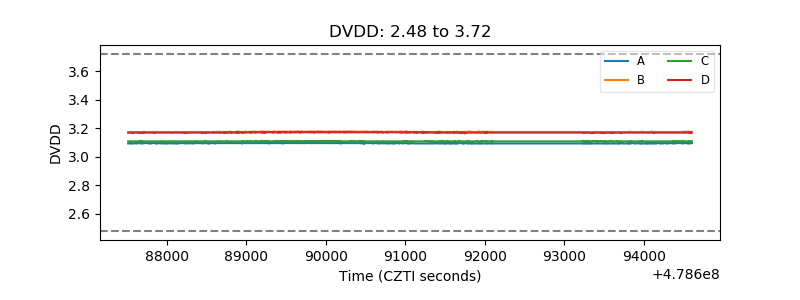 |
| Temperature 1 | 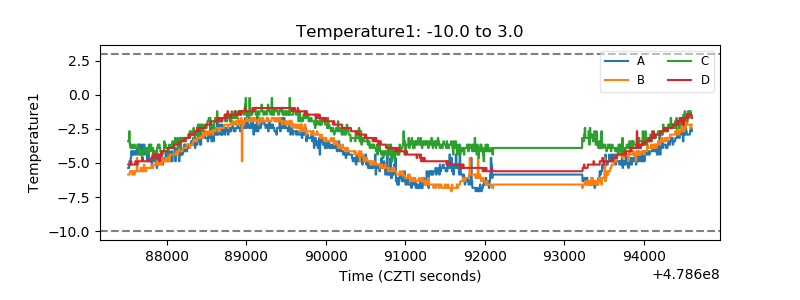 |
| Veto HV Monitor | 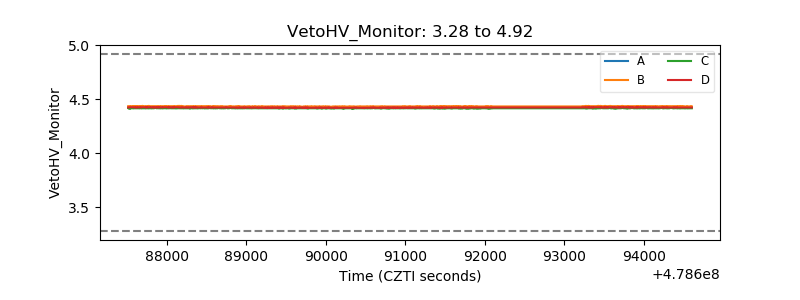 |
| Veto LLD | 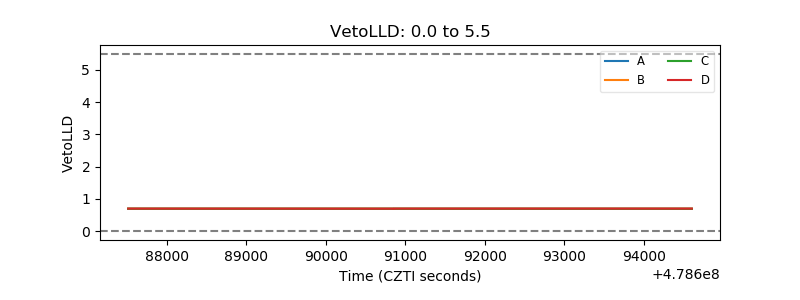 |
| Alpha Counter | 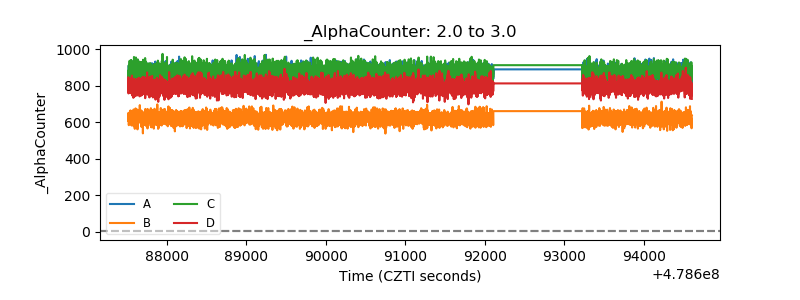 |
| _CPM_Rate | 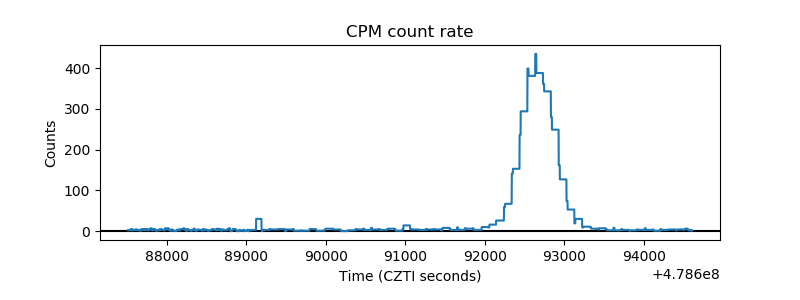 |
| CZT Counter | 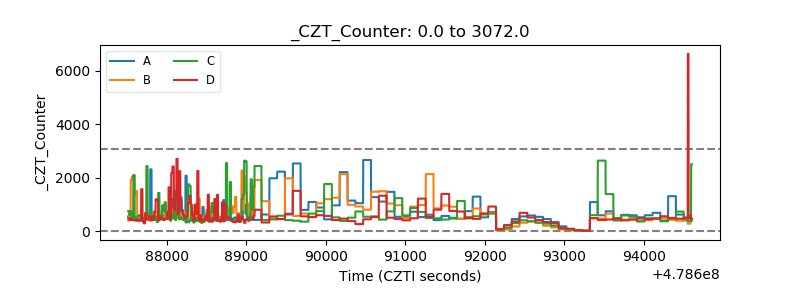 |
| +2.5 Volts monitor | 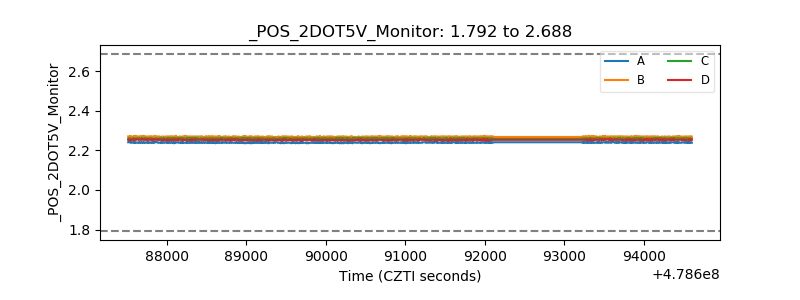 |
| +5 Volts monitor | 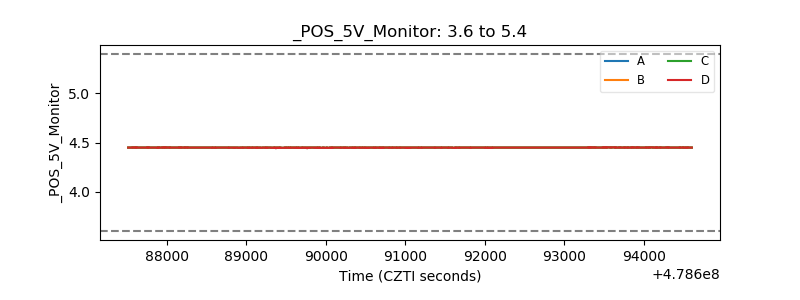 |
| _ROLL_ROT | 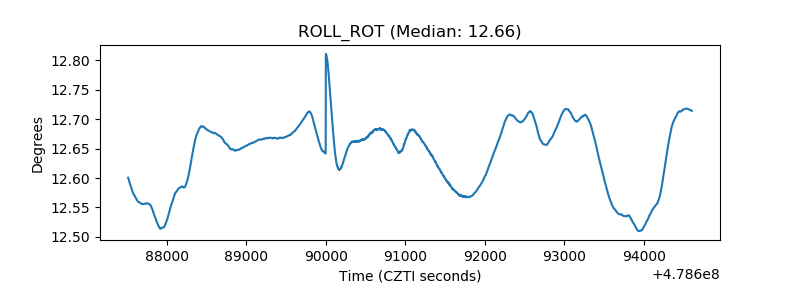 |
| _Roll_DEC | 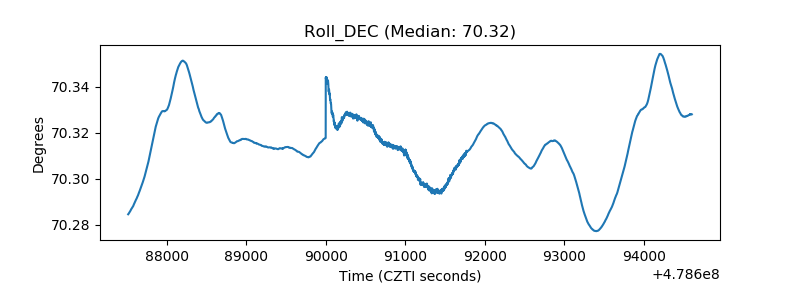 |
| _Roll_RA | 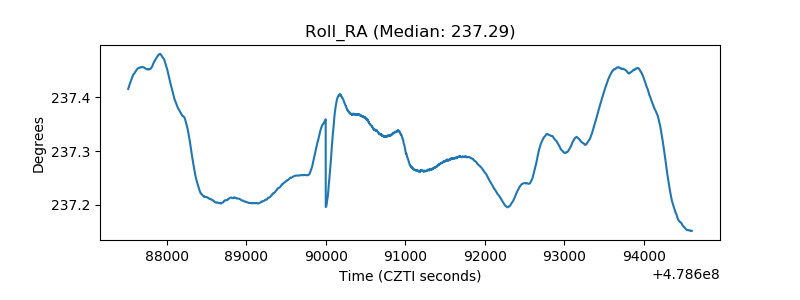 |
| Veto Counter | 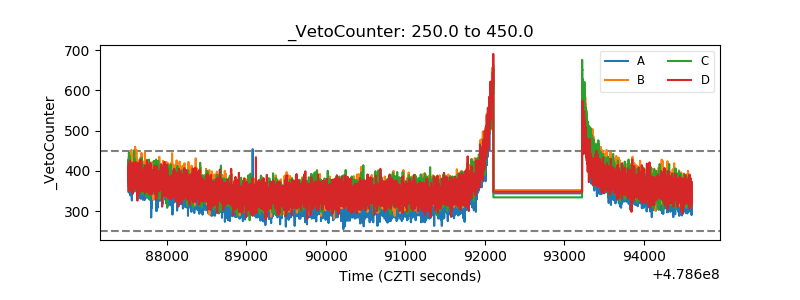 |