| Param | Original file | Final file |
|---|---|---|
| Filename | modeM0/AS1C07_001T02_9000006452_51003cztM0_level2.fits | modeM0/AS1C07_001T02_9000006452_51003cztM0_level2_quad_clean.evt |
| Size (bytes) | 484,205,760 | 88,784,640 |
| Size | 461.8 MB | 84.7 MB |
| Events in quadrant A | 4,949,037 | 568,600 |
| Events in quadrant B | 3,827,353 | 623,857 |
| Events in quadrant C | 4,060,107 | 549,895 |
| Events in quadrant D | 4,605,576 | 512,538 |
| Mode SS | |||
|---|---|---|---|
| Quadrant | BADHDUFLAG | Total packets | Discarded packets |
| A | 0 | 128 | 0 |
| B | 0 | 128 | 0 |
| C | 0 | 128 | 0 |
| D | 0 | 128 | 0 |
| Mode M9 | |||
|---|---|---|---|
| Quadrant | BADHDUFLAG | Total packets | Discarded packets |
| A | 0 | 9 | 0 |
| B | 0 | 9 | 0 |
| C | 0 | 9 | 0 |
| D | 0 | 9 | 0 |
| Mode M0 | |||
|---|---|---|---|
| Quadrant | BADHDUFLAG | Total packets | Discarded packets |
| A | 0 | 18906 | 2 |
| B | 0 | 15612 | 2 |
| C | 0 | 16411 | 3 |
| D | 0 | 17947 | 2 |
| Quadrant | Total seconds | Saturated seconds | Saturation percentage |
|---|---|---|---|
| A | 6204 | 453 | 7.301741% |
| B | 6205 | 267 | 4.302981% |
| C | 6204 | 284 | 4.577692% |
| D | 6204 | 367 | 5.915538% |
Noise dominated data is calculated using 1-second bins in cleaned event files. If a bin has >2000 counts, and if more than 50% of those come from <1% of pixels, then it is considered to be noise-dominated and hence unusable.
| Quadrant | # 1 sec bins | Bins with >0 counts | Bins with >2000 counts | High rate bins dominated by noise | Noise dominated (total time) | Noise dominated (detector-on time) | Marked lightcurve |
|---|---|---|---|---|---|---|---|
| A | 7179 | 6206 | 313 | 313 | 4.36% | 5.04% | 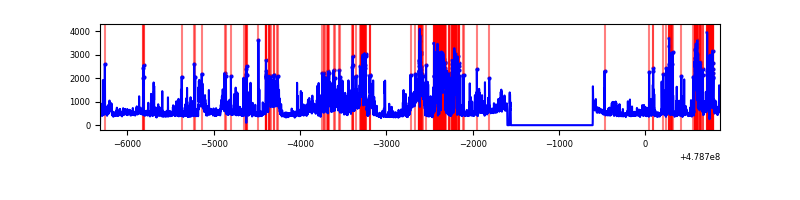 |
| B | 7180 | 6207 | 73 | 73 | 1.02% | 1.18% | 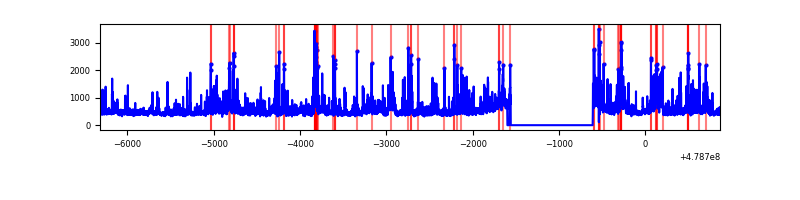 |
| C | 7179 | 6206 | 215 | 215 | 2.99% | 3.46% | 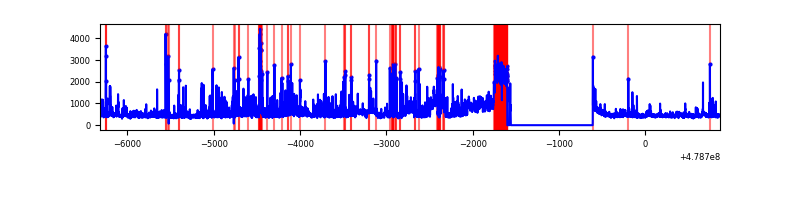 |
| D | 7179 | 6206 | 247 | 247 | 3.44% | 3.98% | 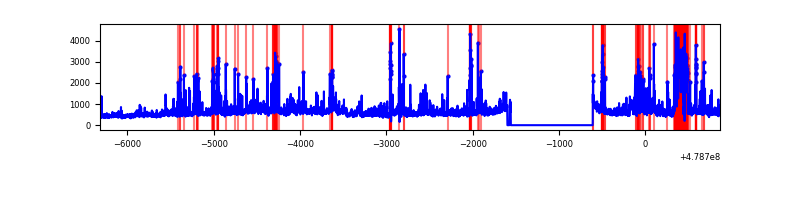 |
Top three noisy pixels from each quadrant. If the there are fewer than three noisy pixels in the level2.evt file, extra rows are filled as -1
| Pixel properties | Quadrant properties | ||||||
|---|---|---|---|---|---|---|---|
| Quadrant | DetID | PixID | Counts | Sigma | Mean | Median | Sigma |
| A | 12 | 80 | 415818 | 2586.67 | 646 | 629 | 160.5 |
| A | 10 | 253 | 385108 | 2395.35 | 646 | 629 | 160.5 |
| A | 3 | 130 | 355030 | 2207.96 | 646 | 629 | 160.5 |
| B | 1 | 207 | 247094 | 1796.75 | 645 | 622 | 137.2 |
| B | 4 | 171 | 216267 | 1572.02 | 645 | 622 | 137.2 |
| B | 4 | 170 | 127516 | 925.04 | 645 | 622 | 137.2 |
| C | 15 | 157 | 606395 | 3569.07 | 617 | 610 | 169.7 |
| C | 15 | 1 | 200826 | 1179.6 | 617 | 610 | 169.7 |
| C | 4 | 12 | 143488 | 841.79 | 617 | 610 | 169.7 |
| D | 10 | 181 | 605694 | 3486.04 | 620 | 595 | 173.6 |
| D | 7 | 39 | 573119 | 3298.38 | 620 | 595 | 173.6 |
| D | 2 | 216 | 280803 | 1614.31 | 620 | 595 | 173.6 |
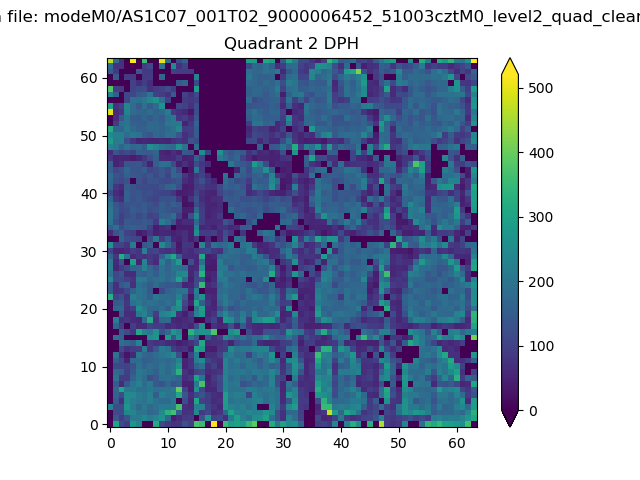
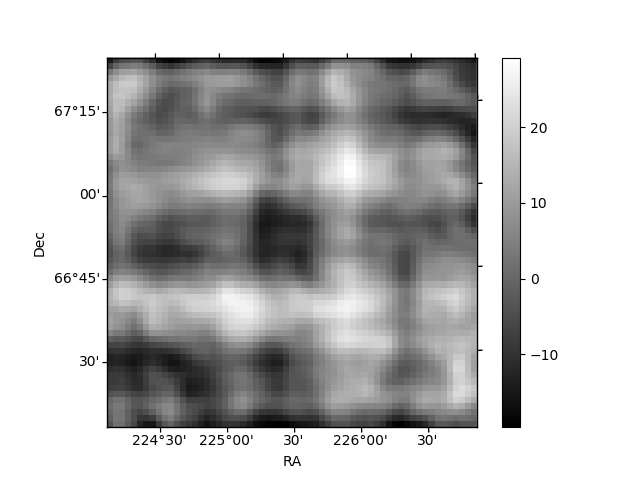
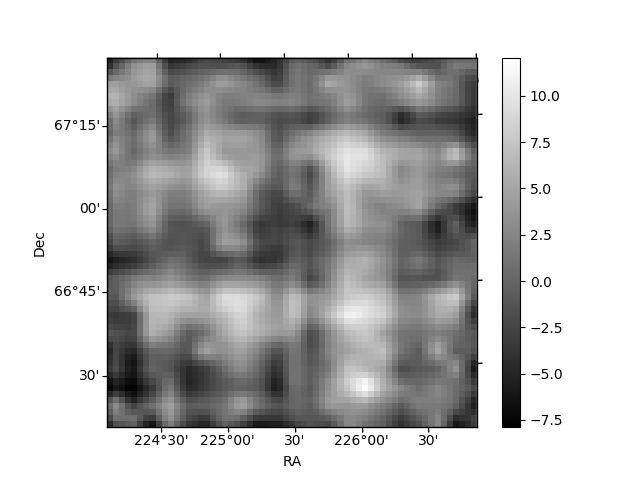
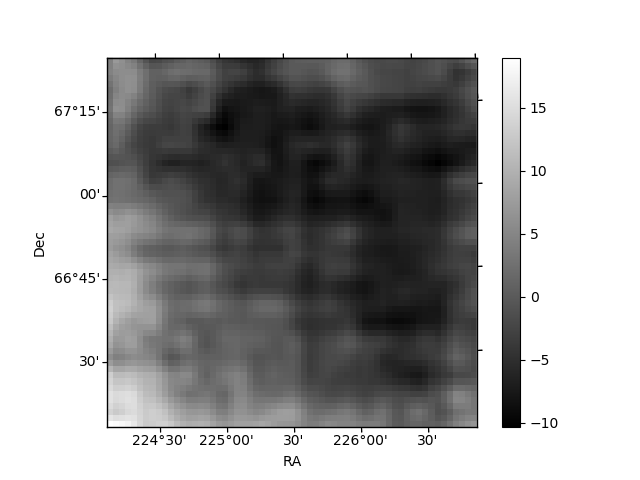
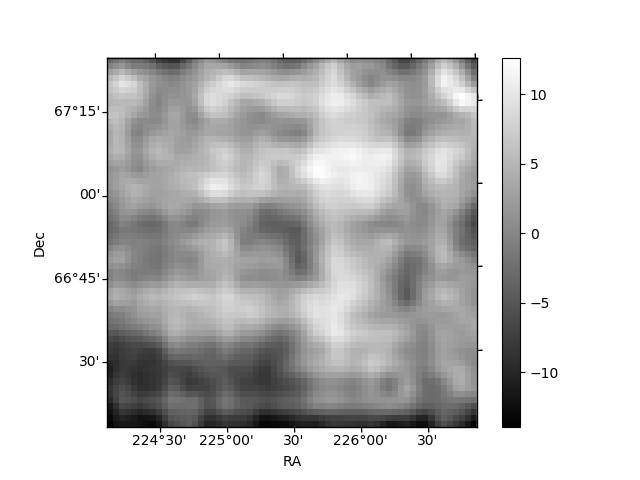
Histogram calculated using DETX and DETY for each event in the final _common_clean file
| Quadrant A | 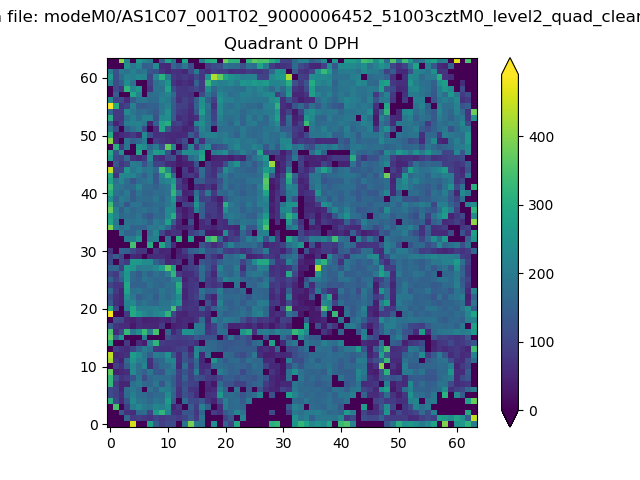 |
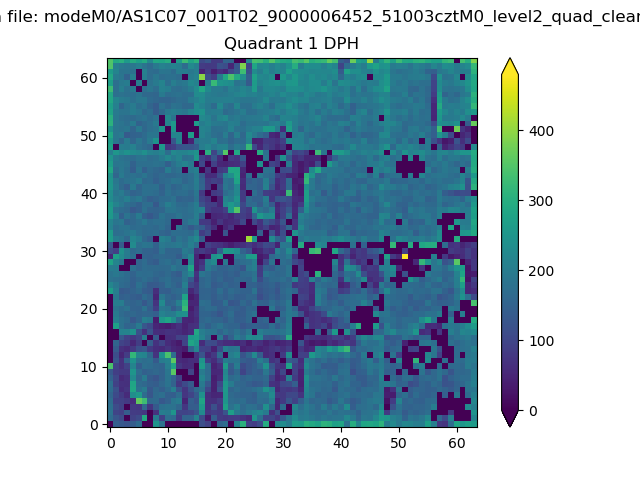 |
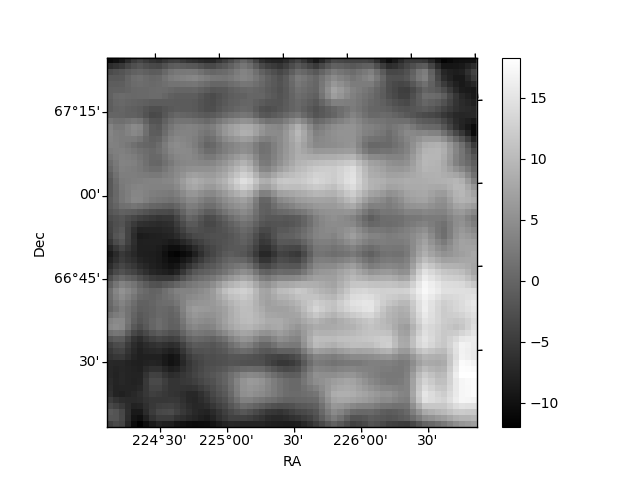
Quadrant B |
|---|---|---|---|
| Quadrant D | 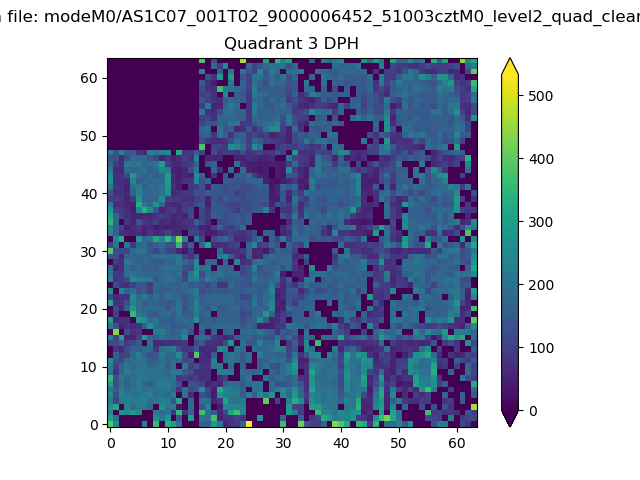 |
 |
Quadrant C |
| Plot type | Count rate plots | Images |
|---|---|---|
| Comparison with Poisson distribution Blue bars denote a histogram of data divided into 1 sec bins. Red curve is a Poisson curve with rate = median count rate of data. |
 |
 |
| Quadrant-wise count rates Data is divided into 100 sec bins |
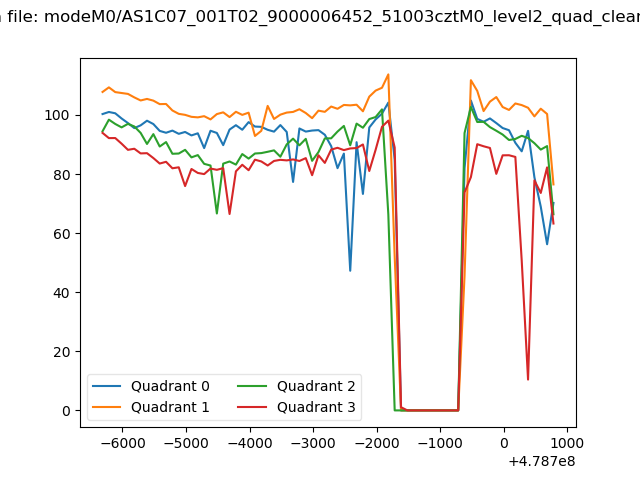 |
|
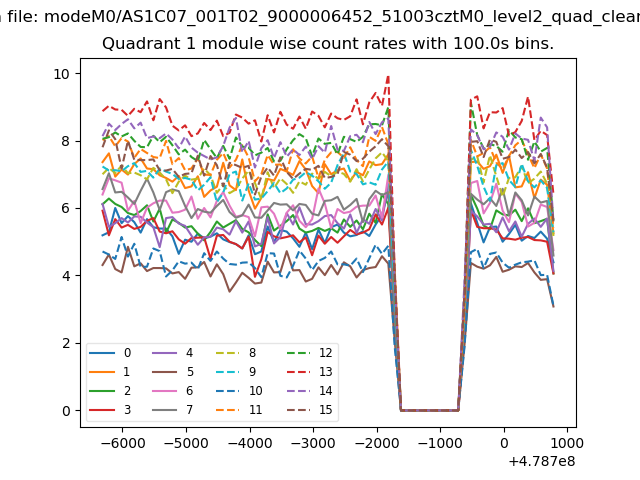
| Module-wise count rates for Quadrant A Data is divided into 100 sec bins |
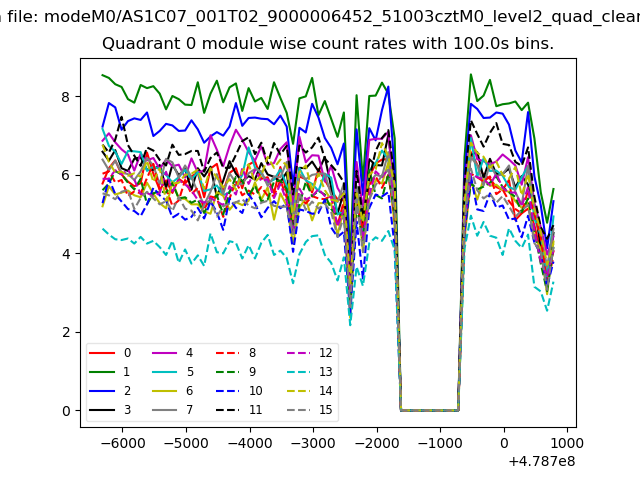 |
 |
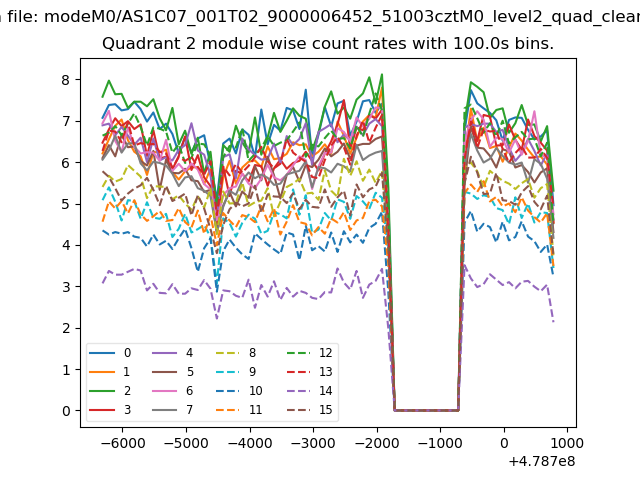
| Module-wise count rates for Quadrant B Data is divided into 100 sec bins |
 |
 |
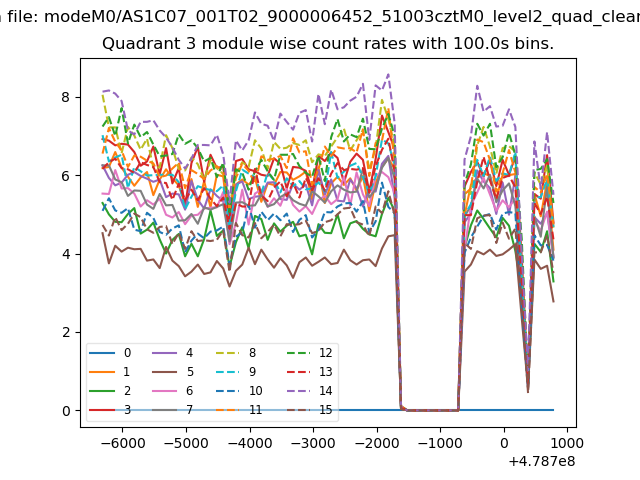
| Module-wise count rates for Quadrant C Data is divided into 100 sec bins |
 |
 |
| Module-wise count rates for Quadrant D Data is divided into 100 sec bins |
 |
 |
| Parameter | Plot |
|---|---|
| CZT HV Monitor | 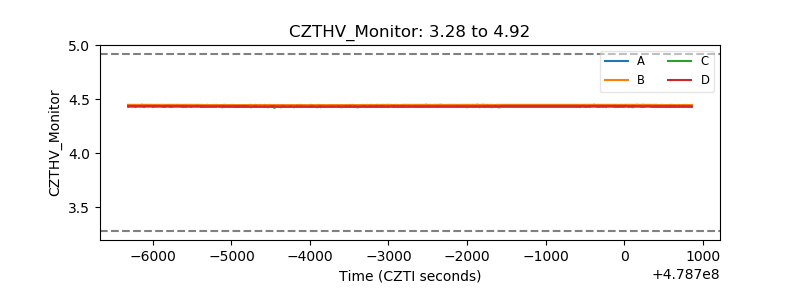 |
| D_VDD | 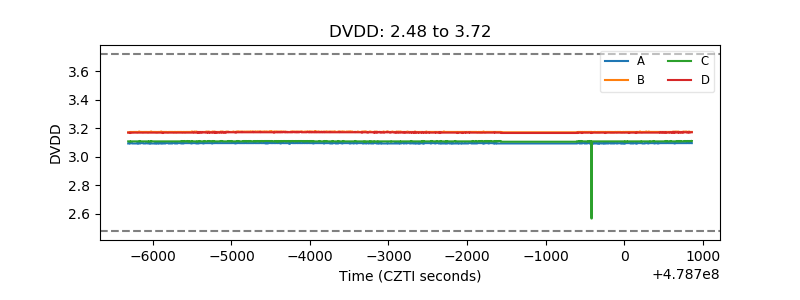 |
| Temperature 1 | 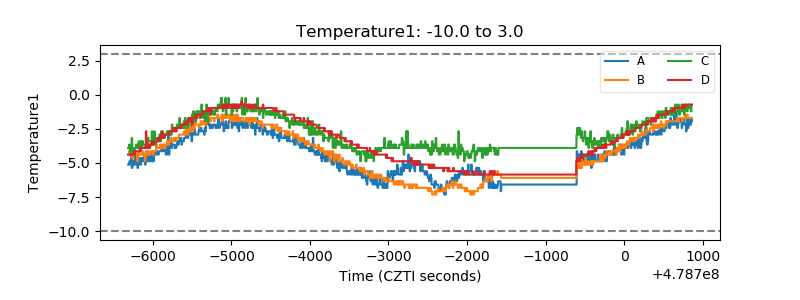 |
| Veto HV Monitor |  |
| Veto LLD | 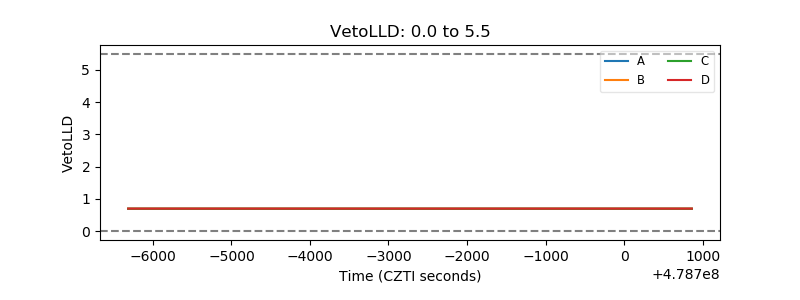 |
| Alpha Counter | 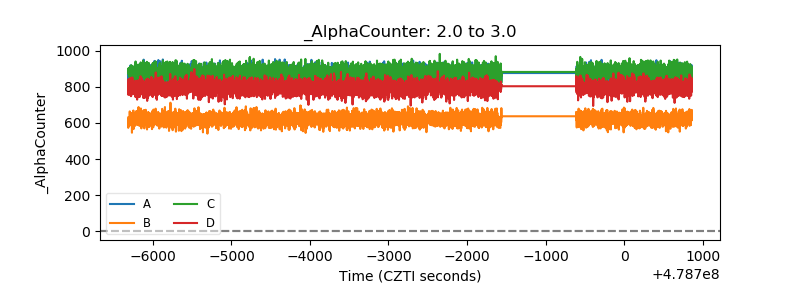 |
| _CPM_Rate | 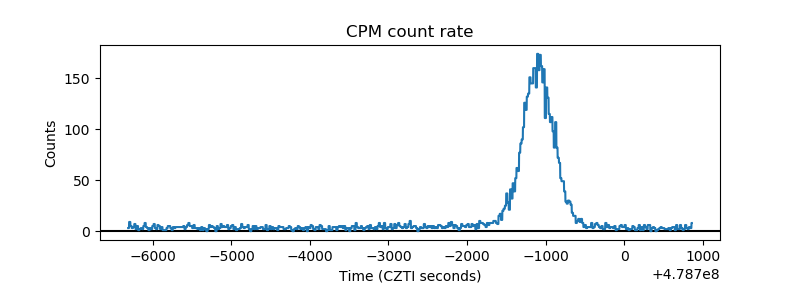 |
| CZT Counter | 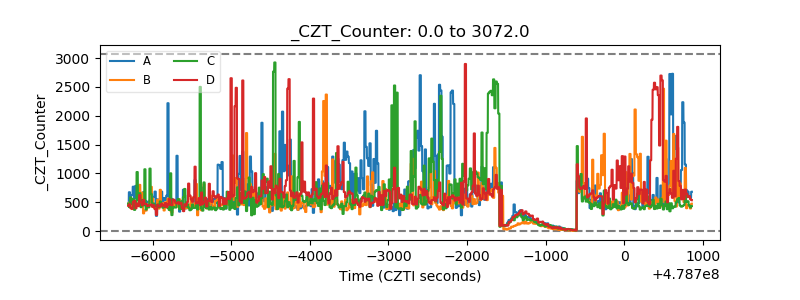 |
| +2.5 Volts monitor | 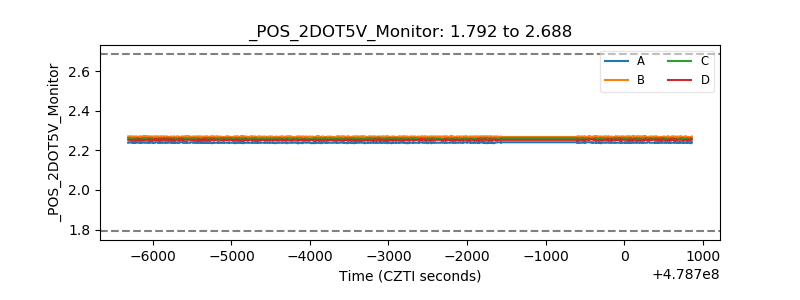 |
| +5 Volts monitor | 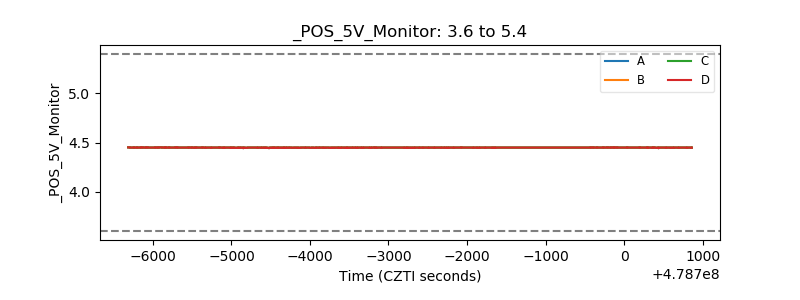 |
| _ROLL_ROT | 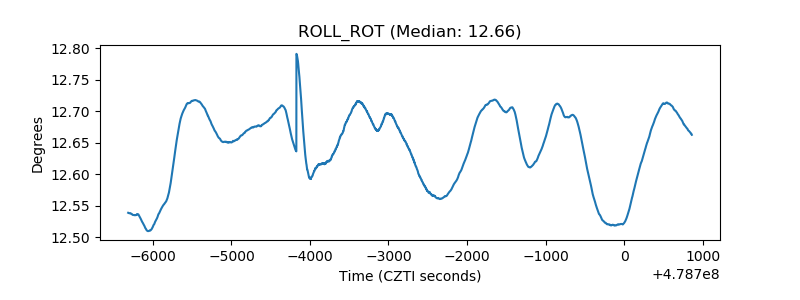 |
| _Roll_DEC | 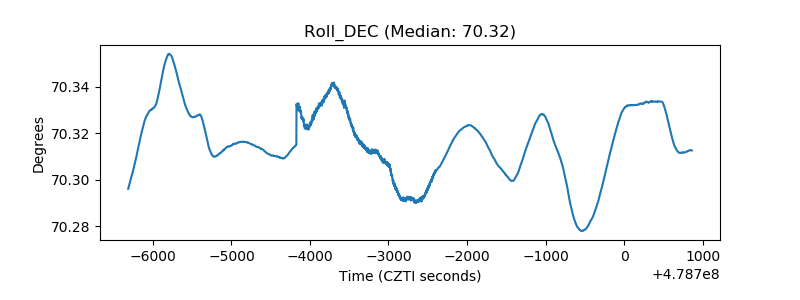 |
| _Roll_RA | 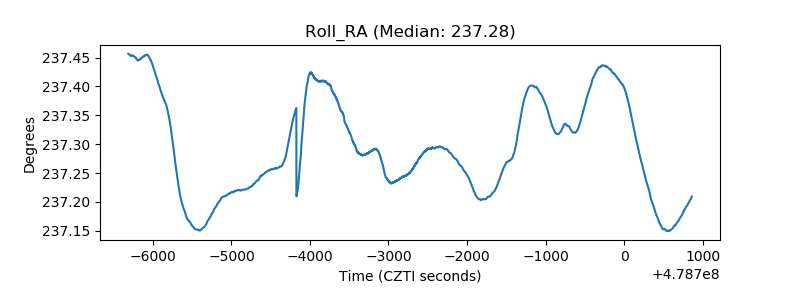 |
| Veto Counter | 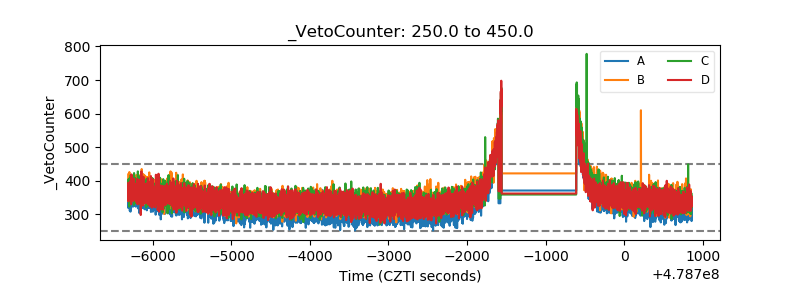 |