| Param | Original file | Final file |
|---|---|---|
| Filename | modeM0/AS1C07_001T02_9000006452_51004cztM0_level2.fits | modeM0/AS1C07_001T02_9000006452_51004cztM0_level2_quad_clean.evt |
| Size (bytes) | 623,675,520 | 92,640,960 |
| Size | 594.8 MB | 88.3 MB |
| Events in quadrant A | 8,551,366 | 546,365 |
| Events in quadrant B | 4,116,024 | 668,418 |
| Events in quadrant C | 4,391,787 | 584,268 |
| Events in quadrant D | 5,502,576 | 534,243 |
| Mode SS | |||
|---|---|---|---|
| Quadrant | BADHDUFLAG | Total packets | Discarded packets |
| A | 0 | 136 | 0 |
| B | 0 | 136 | 0 |
| C | 0 | 136 | 0 |
| D | 0 | 136 | 0 |
| Mode M9 | |||
|---|---|---|---|
| Quadrant | BADHDUFLAG | Total packets | Discarded packets |
| A | 0 | 7 | 0 |
| B | 0 | 7 | 0 |
| C | 0 | 7 | 0 |
| D | 0 | 7 | 0 |
| Mode M0 | |||
|---|---|---|---|
| Quadrant | BADHDUFLAG | Total packets | Discarded packets |
| A | 0 | 30078 | 1 |
| B | 0 | 16940 | 1 |
| C | 0 | 17791 | 1 |
| D | 0 | 21249 | 1 |
| Quadrant | Total seconds | Saturated seconds | Saturation percentage |
|---|---|---|---|
| A | 6771 | 1359 | 20.070891% |
| B | 6771 | 295 | 4.356816% |
| C | 6771 | 370 | 5.464481% |
| D | 6770 | 509 | 7.518464% |
Noise dominated data is calculated using 1-second bins in cleaned event files. If a bin has >2000 counts, and if more than 50% of those come from <1% of pixels, then it is considered to be noise-dominated and hence unusable.
| Quadrant | # 1 sec bins | Bins with >0 counts | Bins with >2000 counts | High rate bins dominated by noise | Noise dominated (total time) | Noise dominated (detector-on time) | Marked lightcurve |
|---|---|---|---|---|---|---|---|
| A | 7396 | 6772 | 1408 | 1408 | 19.04% | 20.79% | 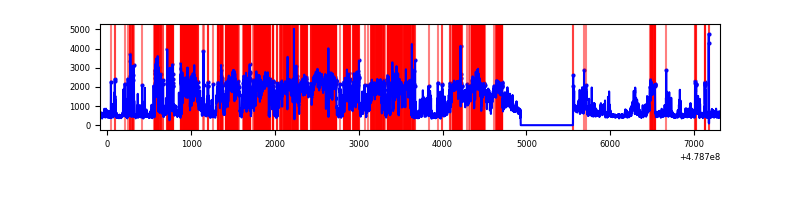 |
| B | 7396 | 6772 | 82 | 82 | 1.11% | 1.21% | 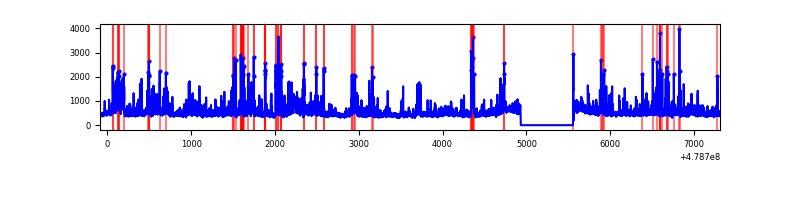 |
| C | 7396 | 6772 | 219 | 219 | 2.96% | 3.23% | 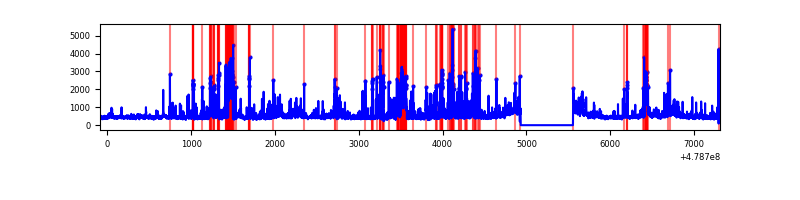 |
| D | 7395 | 6771 | 359 | 359 | 4.85% | 5.30% | 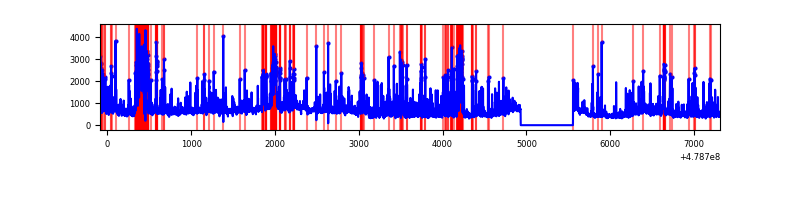 |
Top three noisy pixels from each quadrant. If the there are fewer than three noisy pixels in the level2.evt file, extra rows are filled as -1
| Pixel properties | Quadrant properties | ||||||
|---|---|---|---|---|---|---|---|
| Quadrant | DetID | PixID | Counts | Sigma | Mean | Median | Sigma |
| A | 12 | 80 | 3836760 | 22777.59 | 685 | 667 | 168.4 |
| A | 4 | 249 | 438422 | 2599.26 | 685 | 667 | 168.4 |
| A | 10 | 253 | 390248 | 2313.22 | 685 | 667 | 168.4 |
| B | 4 | 170 | 362863 | 2413.81 | 705 | 680 | 150.0 |
| B | 1 | 207 | 176006 | 1168.48 | 705 | 680 | 150.0 |
| B | 12 | 32 | 145808 | 967.22 | 705 | 680 | 150.0 |
| C | 14 | 245 | 418930 | 2223.16 | 684 | 676 | 188.1 |
| C | 12 | 252 | 309525 | 1641.64 | 684 | 676 | 188.1 |
| C | 3 | 242 | 157721 | 834.75 | 684 | 676 | 188.1 |
| D | 7 | 39 | 674798 | 3603.24 | 672 | 647 | 187.1 |
| D | 10 | 181 | 419049 | 2236.3 | 672 | 647 | 187.1 |
| D | 2 | 216 | 418255 | 2232.05 | 672 | 647 | 187.1 |
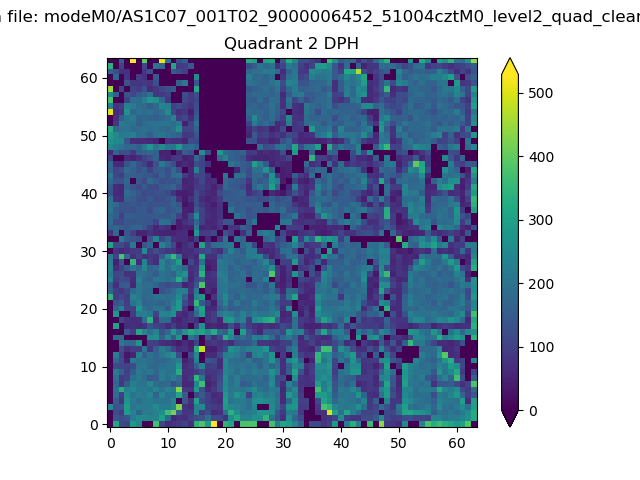
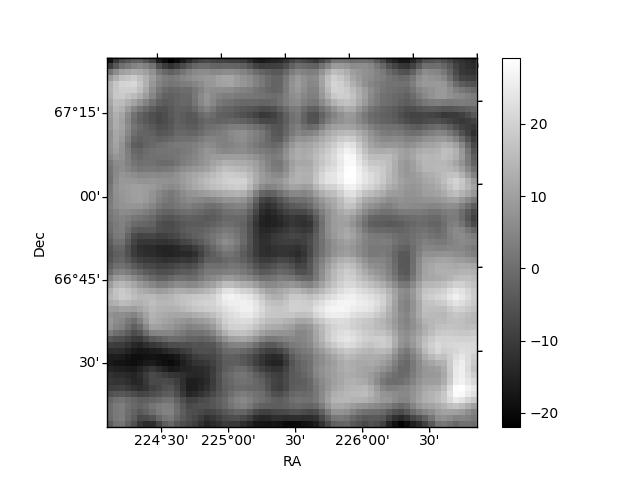
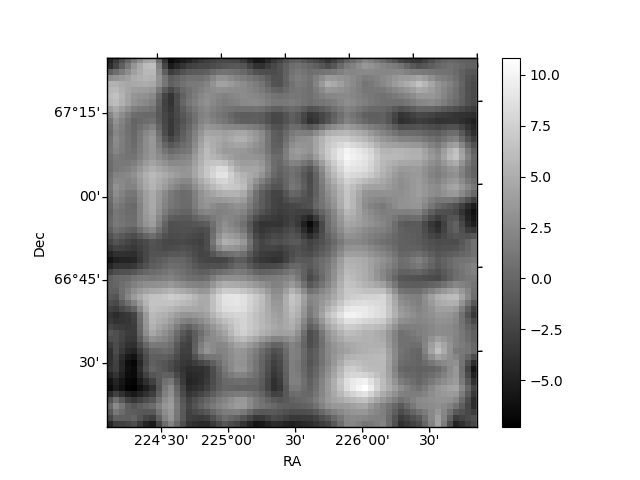
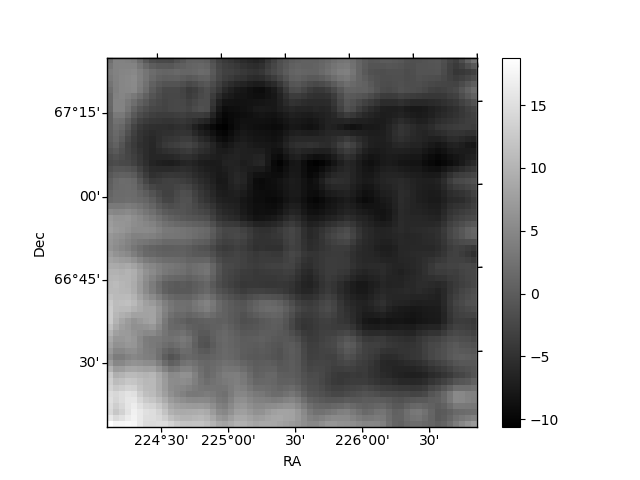
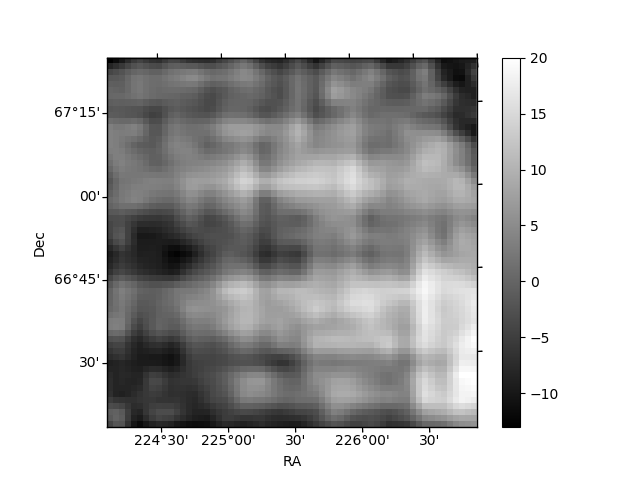
Histogram calculated using DETX and DETY for each event in the final _common_clean file
| Quadrant A | 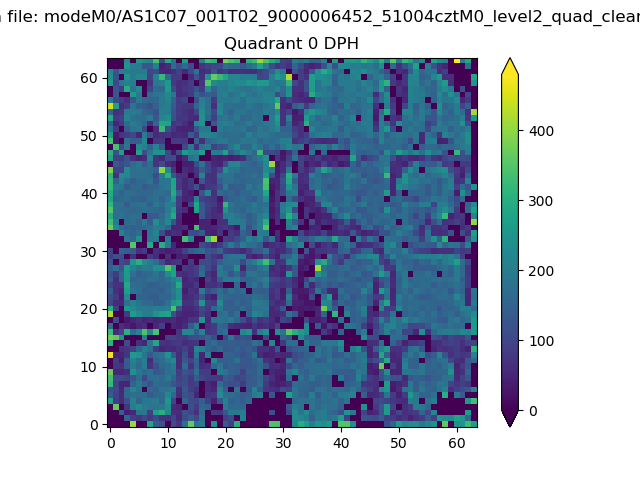 |
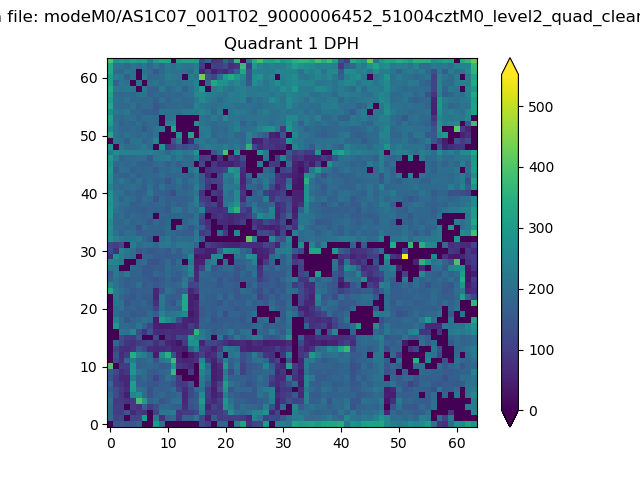 |
Quadrant B |
|---|---|---|---|
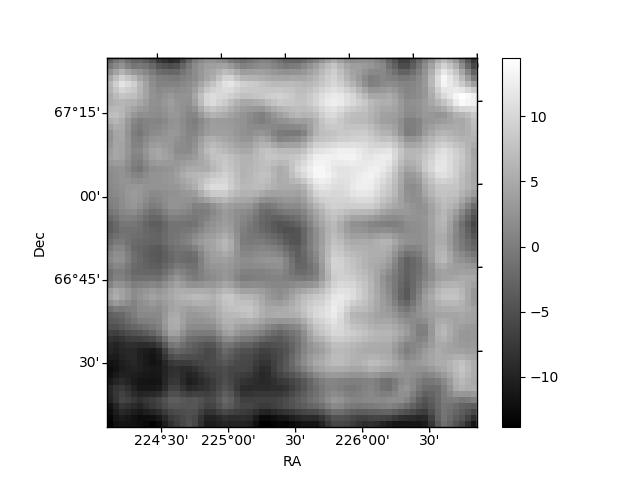
| Quadrant D | 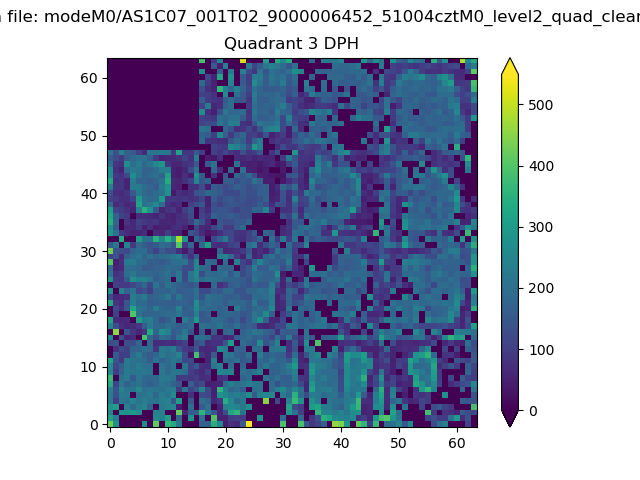 |
 |
Quadrant C |
| Plot type | Count rate plots | Images |
|---|---|---|
| Comparison with Poisson distribution Blue bars denote a histogram of data divided into 1 sec bins. Red curve is a Poisson curve with rate = median count rate of data. |
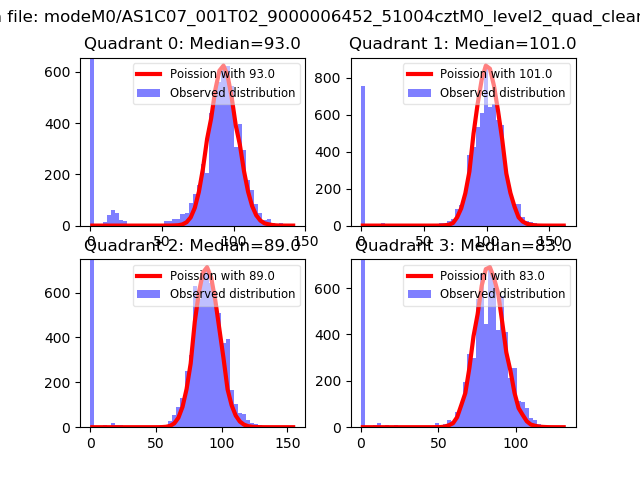 |
 |
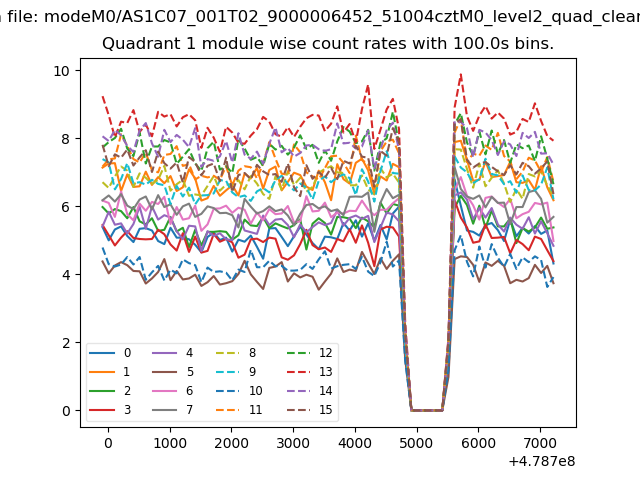
| Quadrant-wise count rates Data is divided into 100 sec bins |
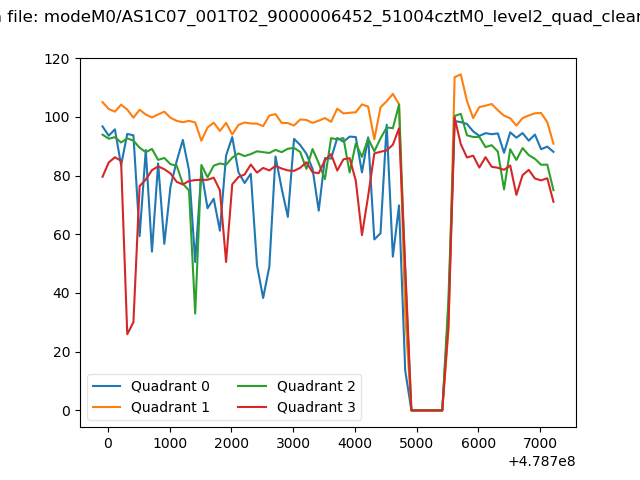 |
|
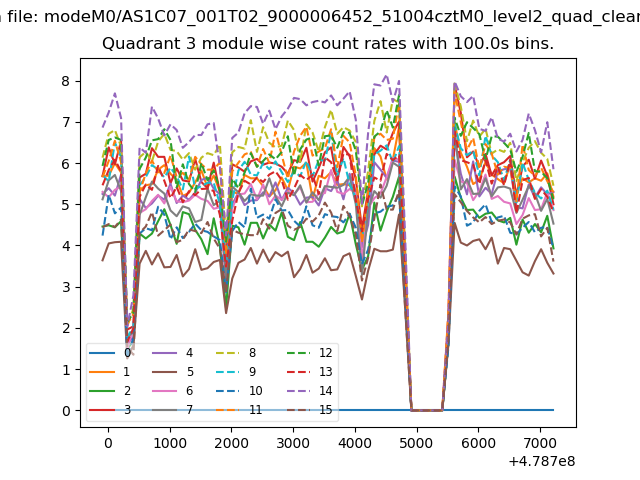
| Module-wise count rates for Quadrant A Data is divided into 100 sec bins |
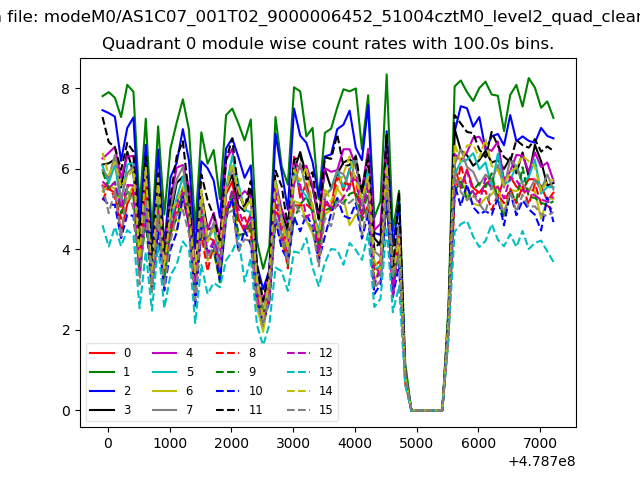 |
 |
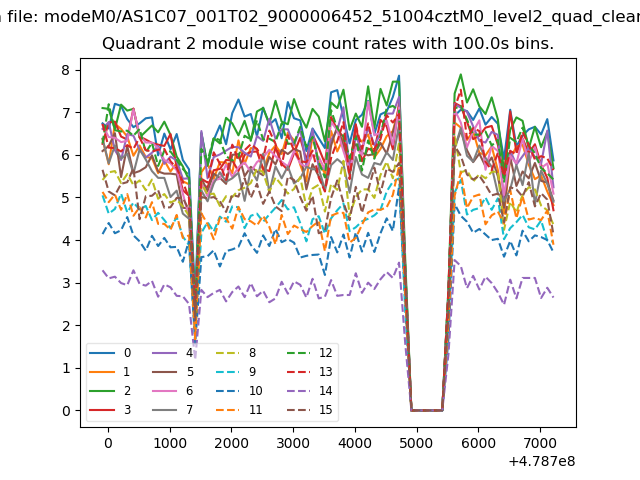
| Module-wise count rates for Quadrant B Data is divided into 100 sec bins |
 |
 |
| Module-wise count rates for Quadrant C Data is divided into 100 sec bins |
 |
 |
| Module-wise count rates for Quadrant D Data is divided into 100 sec bins |
 |
 |
| Parameter | Plot |
|---|---|
| CZT HV Monitor | 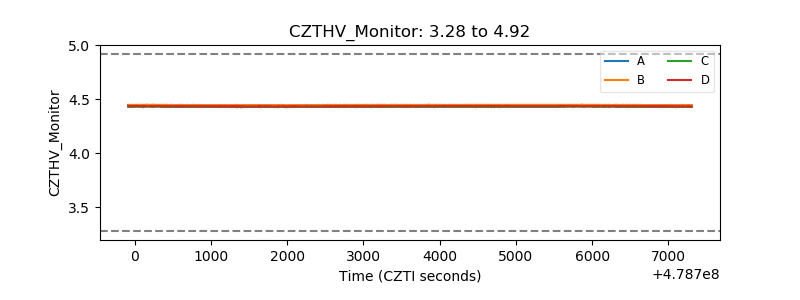 |
| D_VDD | 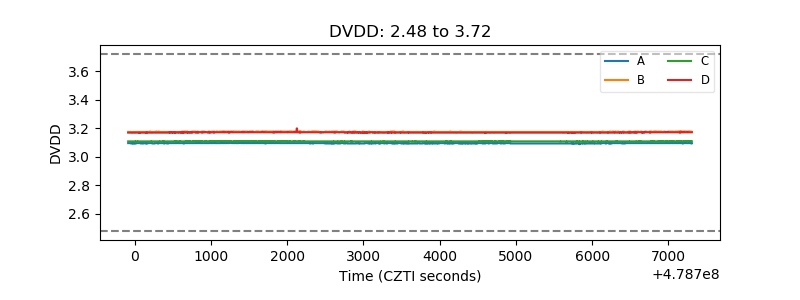 |
| Temperature 1 | 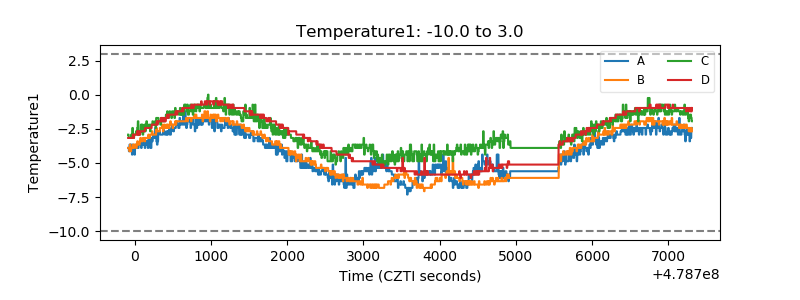 |
| Veto HV Monitor |  |
| Veto LLD | 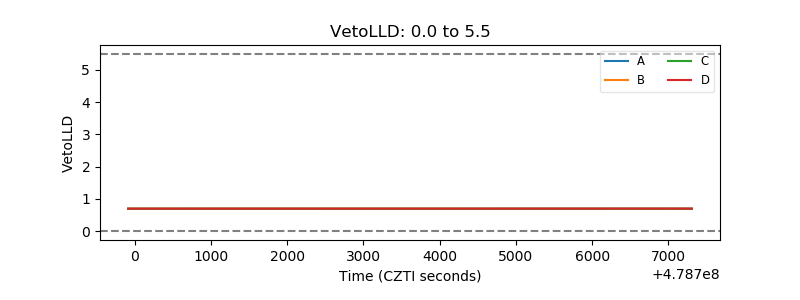 |
| Alpha Counter | 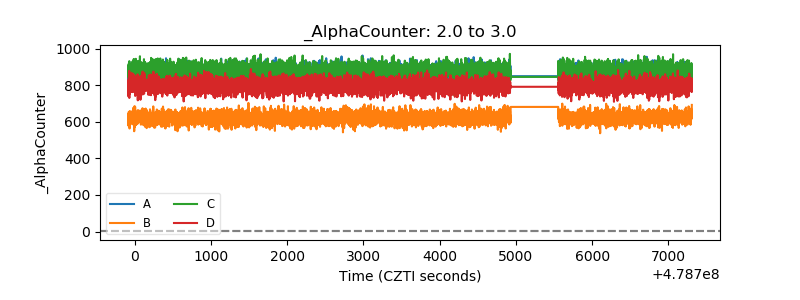 |
| _CPM_Rate | 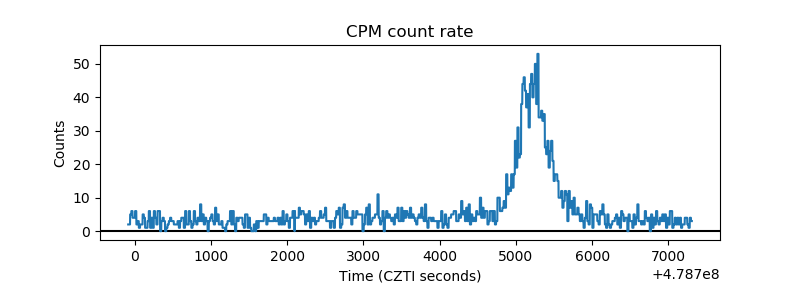 |
| CZT Counter | 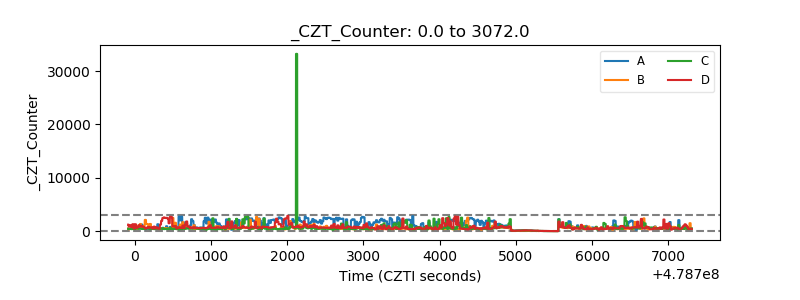 |
| +2.5 Volts monitor | 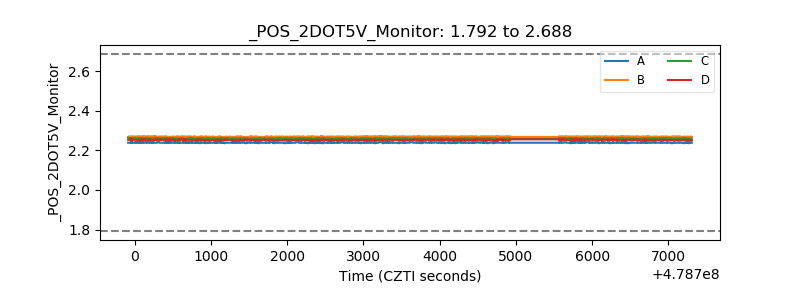 |
| +5 Volts monitor | 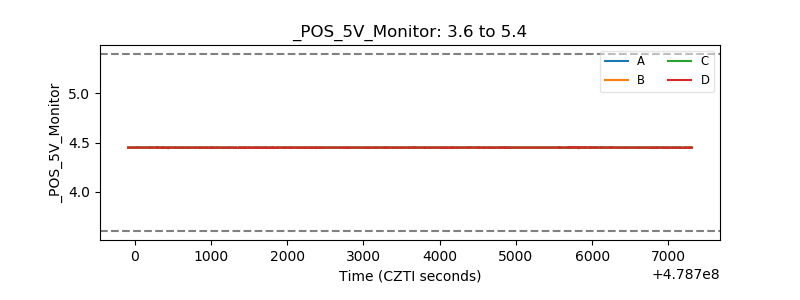 |
| _ROLL_ROT | 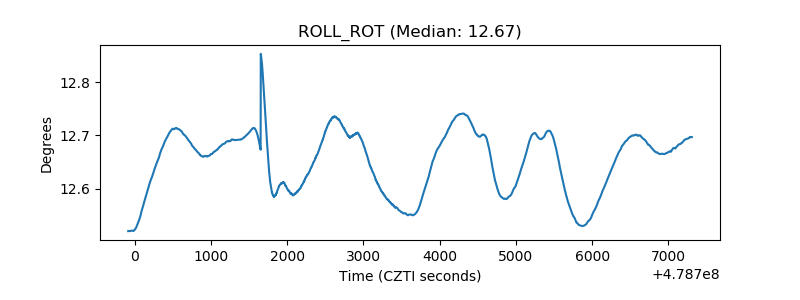 |
| _Roll_DEC | 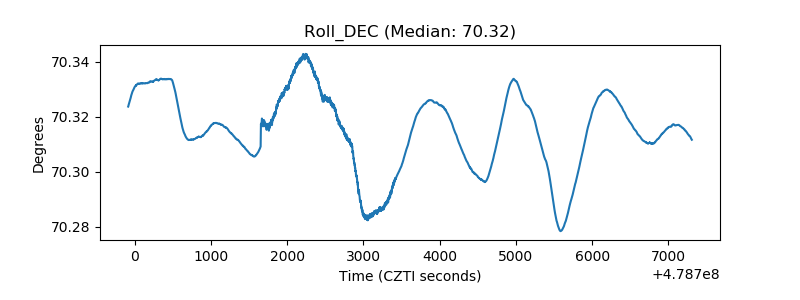 |
| _Roll_RA | 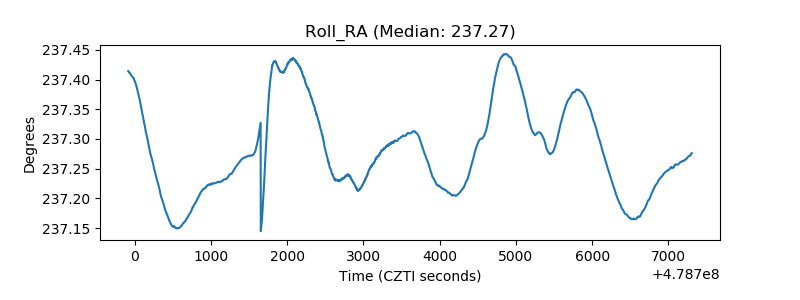 |
| Veto Counter | 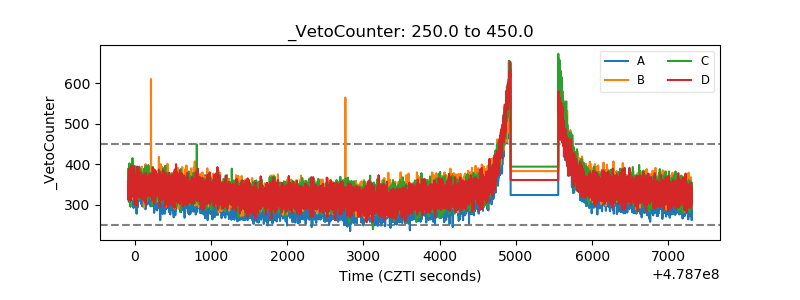 |