| Param | Original file | Final file |
|---|---|---|
| Filename | modeM0/AS1C07_001T02_9000006452_51005cztM0_level2.fits | modeM0/AS1C07_001T02_9000006452_51005cztM0_level2_quad_clean.evt |
| Size (bytes) | 605,376,000 | 94,351,680 |
| Size | 577.3 MB | 90.0 MB |
| Events in quadrant A | 5,795,354 | 607,453 |
| Events in quadrant B | 4,292,023 | 684,036 |
| Events in quadrant C | 6,559,328 | 519,167 |
| Events in quadrant D | 5,225,284 | 563,252 |
| Mode SS | |||
|---|---|---|---|
| Quadrant | BADHDUFLAG | Total packets | Discarded packets |
| A | 0 | 140 | 0 |
| B | 0 | 140 | 0 |
| C | 0 | 140 | 0 |
| D | 0 | 140 | 0 |
| Mode M0 | |||
|---|---|---|---|
| Quadrant | BADHDUFLAG | Total packets | Discarded packets |
| A | 0 | 21919 | 1 |
| B | 0 | 17661 | 1 |
| C | 0 | 24342 | 1 |
| D | 0 | 20477 | 1 |
| Quadrant | Total seconds | Saturated seconds | Saturation percentage |
|---|---|---|---|
| A | 6925 | 644 | 9.299639% |
| B | 6925 | 331 | 4.779783% |
| C | 6925 | 1292 | 18.657040% |
| D | 6925 | 393 | 5.675090% |
Noise dominated data is calculated using 1-second bins in cleaned event files. If a bin has >2000 counts, and if more than 50% of those come from <1% of pixels, then it is considered to be noise-dominated and hence unusable.
| Quadrant | # 1 sec bins | Bins with >0 counts | Bins with >2000 counts | High rate bins dominated by noise | Noise dominated (total time) | Noise dominated (detector-on time) | Marked lightcurve |
|---|---|---|---|---|---|---|---|
| A | 6945 | 6926 | 549 | 549 | 7.90% | 7.93% | 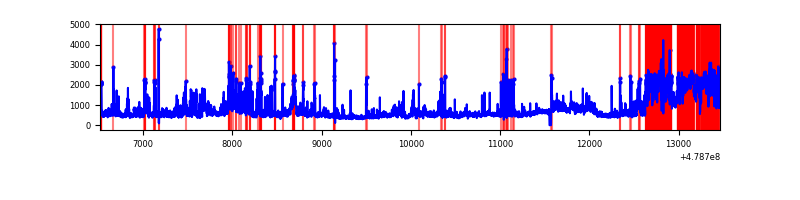 |
| B | 6945 | 6926 | 124 | 124 | 1.79% | 1.79% | 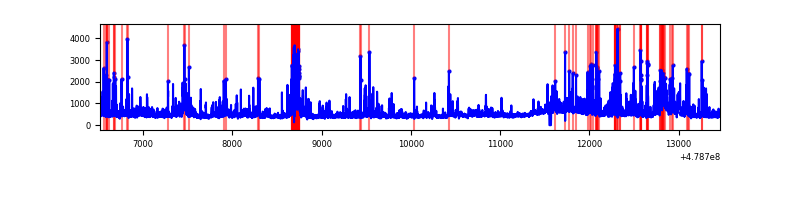 |
| C | 6945 | 6926 | 997 | 997 | 14.36% | 14.40% | 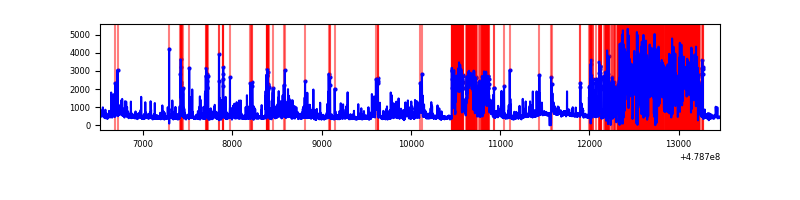 |
| D | 6945 | 6926 | 302 | 302 | 4.35% | 4.36% | 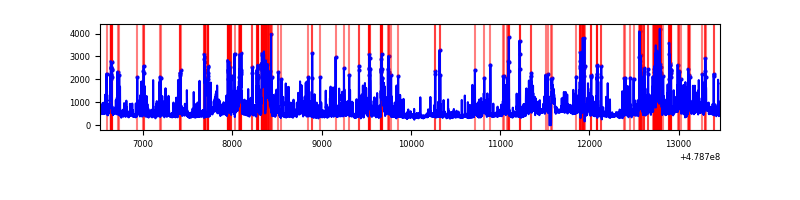 |
Top three noisy pixels from each quadrant. If the there are fewer than three noisy pixels in the level2.evt file, extra rows are filled as -1
| Pixel properties | Quadrant properties | ||||||
|---|---|---|---|---|---|---|---|
| Quadrant | DetID | PixID | Counts | Sigma | Mean | Median | Sigma |
| A | 10 | 253 | 1058869 | 6010.45 | 718 | 700 | 176.1 |
| A | 12 | 80 | 855372 | 4854.58 | 718 | 700 | 176.1 |
| A | 4 | 3 | 210091 | 1189.35 | 718 | 700 | 176.1 |
| B | 4 | 171 | 341459 | 2238.92 | 718 | 693 | 152.2 |
| B | 7 | 252 | 218609 | 1431.76 | 718 | 693 | 152.2 |
| B | 1 | 207 | 210824 | 1380.61 | 718 | 693 | 152.2 |
| C | 13 | 3 | 2341913 | 13272.39 | 633 | 626 | 176.4 |
| C | 1 | 44 | 349477 | 1977.58 | 633 | 626 | 176.4 |
| C | 14 | 96 | 338202 | 1913.67 | 633 | 626 | 176.4 |
| D | 8 | 176 | 638785 | 3267.53 | 699 | 672 | 195.3 |
| D | 2 | 216 | 534245 | 2732.22 | 699 | 672 | 195.3 |
| D | 15 | 108 | 377023 | 1927.15 | 699 | 672 | 195.3 |
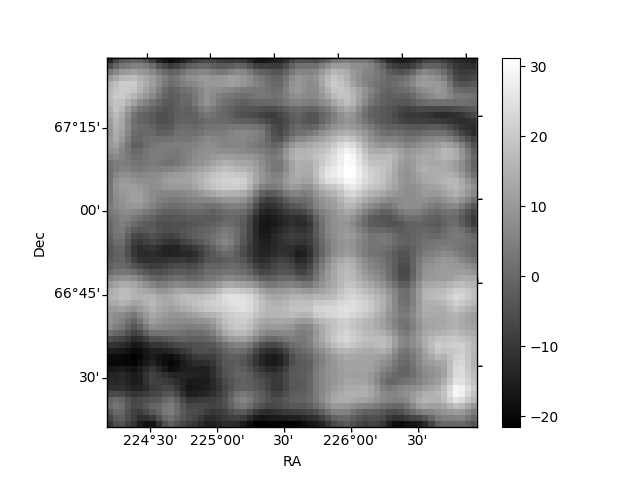
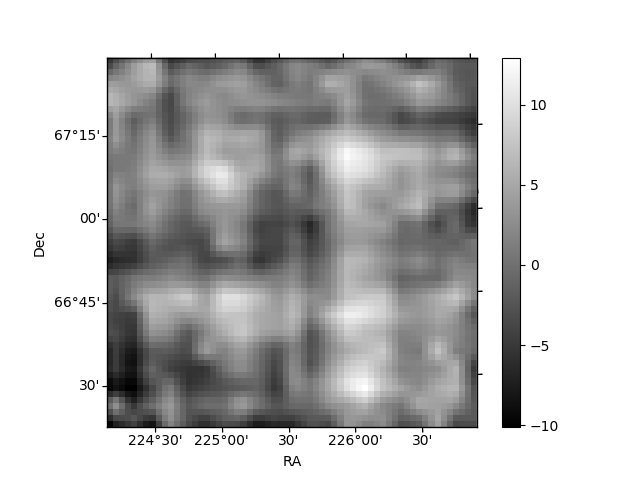
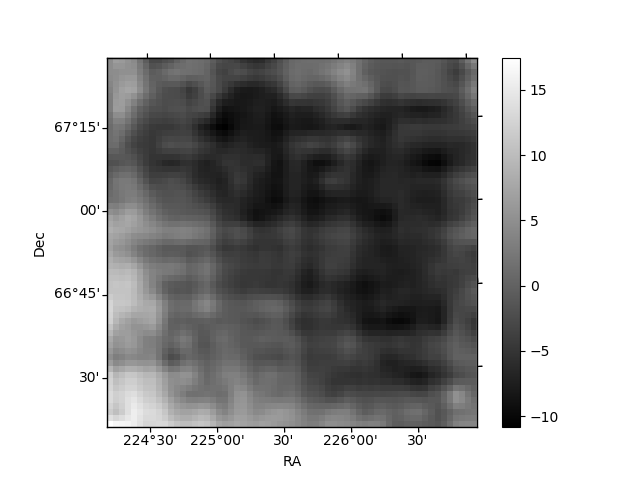
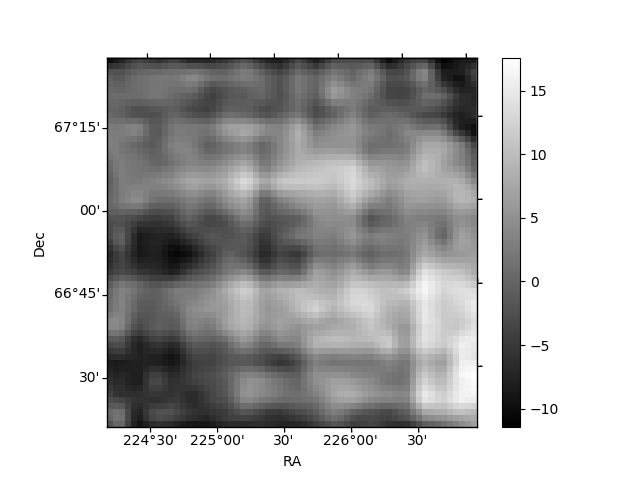
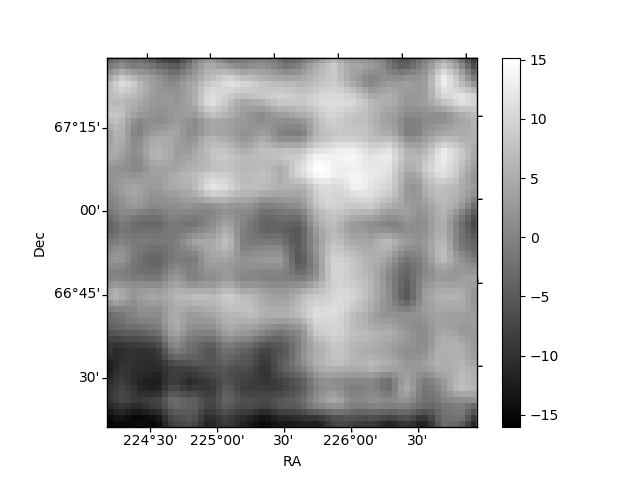
Histogram calculated using DETX and DETY for each event in the final _common_clean file
| Quadrant A | 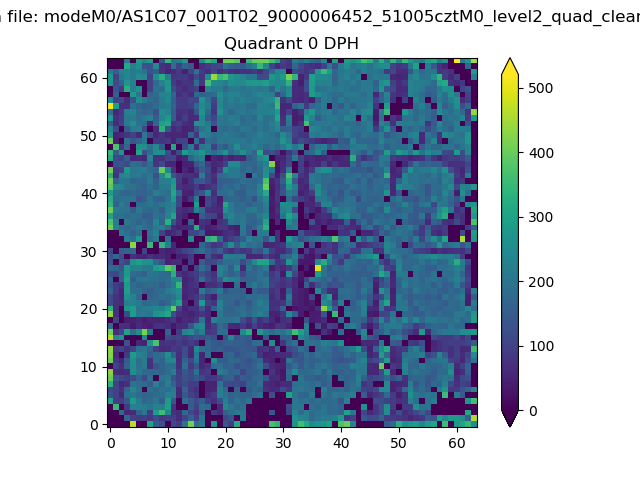 |
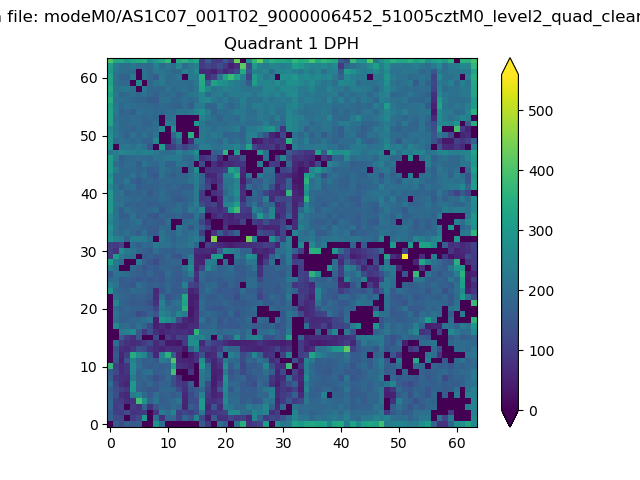 |
Quadrant B |
|---|---|---|---|
| Quadrant D | 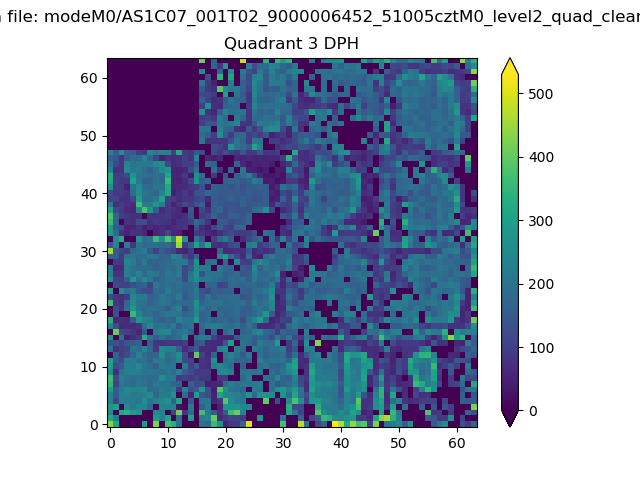 |
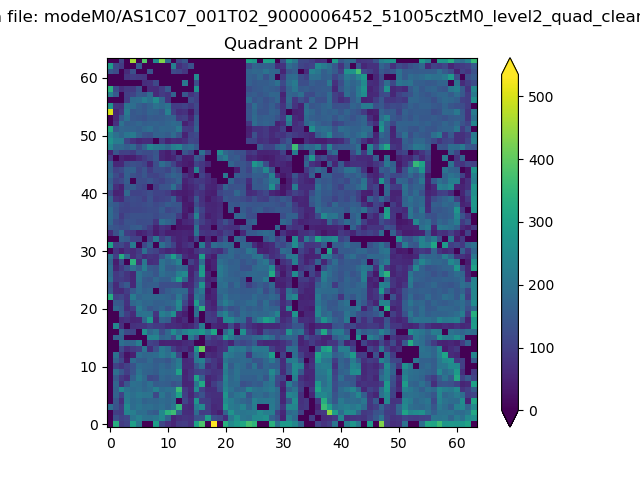 |
Quadrant C |
| Plot type | Count rate plots | Images |
|---|---|---|
| Comparison with Poisson distribution Blue bars denote a histogram of data divided into 1 sec bins. Red curve is a Poisson curve with rate = median count rate of data. |
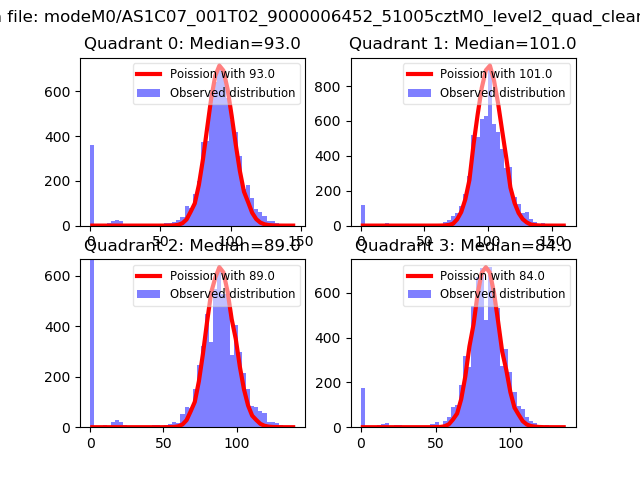 |
 |
| Quadrant-wise count rates Data is divided into 100 sec bins |
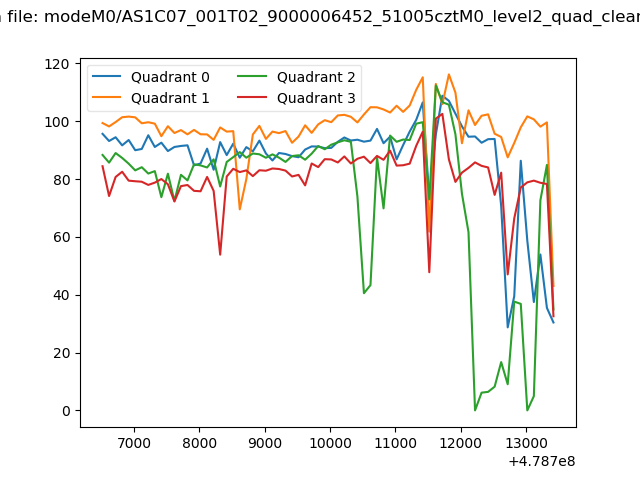 |
|
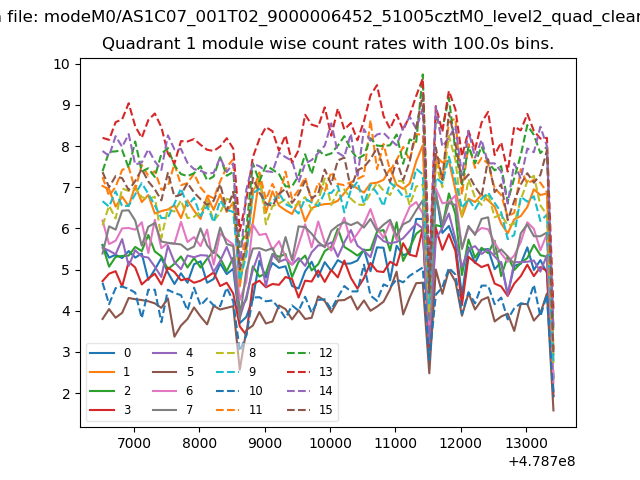
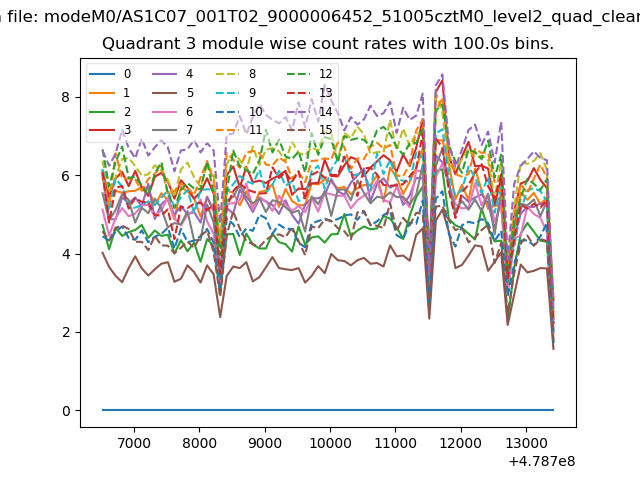
| Module-wise count rates for Quadrant A Data is divided into 100 sec bins |
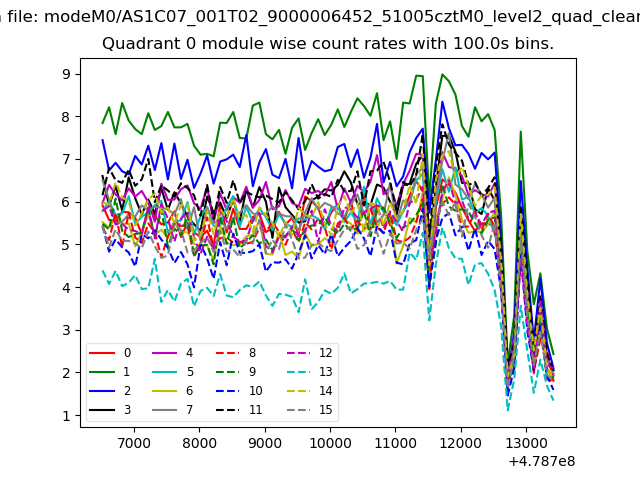 |
 |
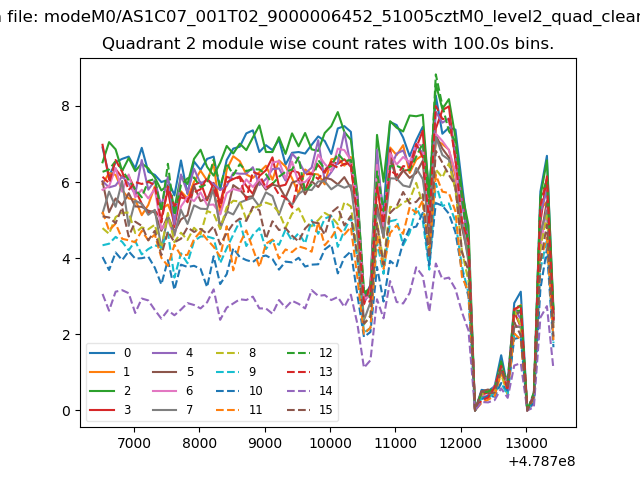
| Module-wise count rates for Quadrant B Data is divided into 100 sec bins |
 |
 |
| Module-wise count rates for Quadrant C Data is divided into 100 sec bins |
 |
 |
| Module-wise count rates for Quadrant D Data is divided into 100 sec bins |
 |
 |
| Parameter | Plot |
|---|---|
| CZT HV Monitor | 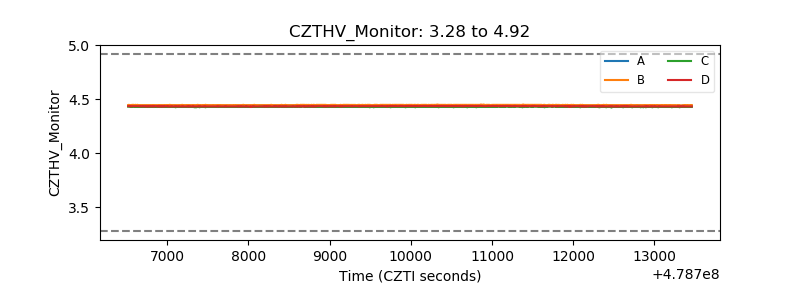 |
| D_VDD | 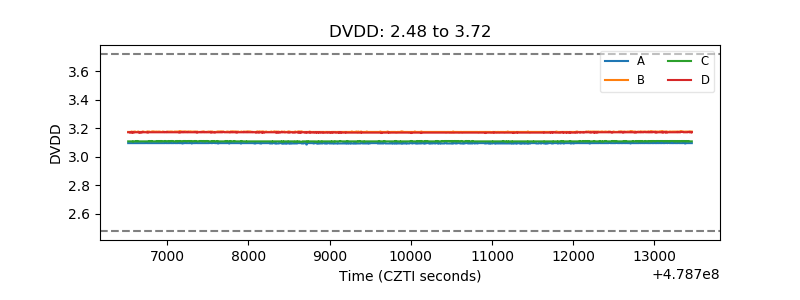 |
| Temperature 1 | 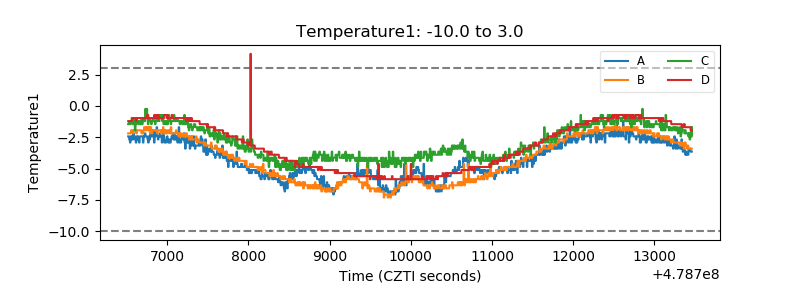 |
| Veto HV Monitor |  |
| Veto LLD | 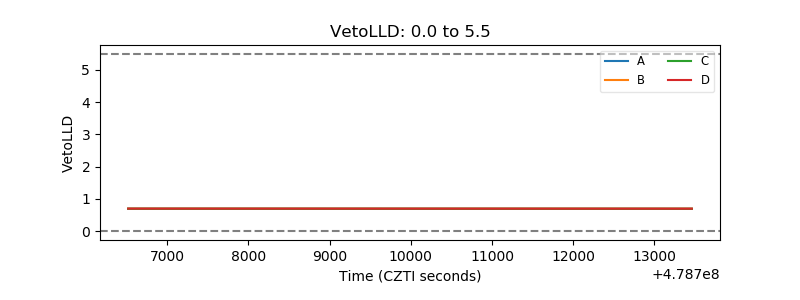 |
| Alpha Counter | 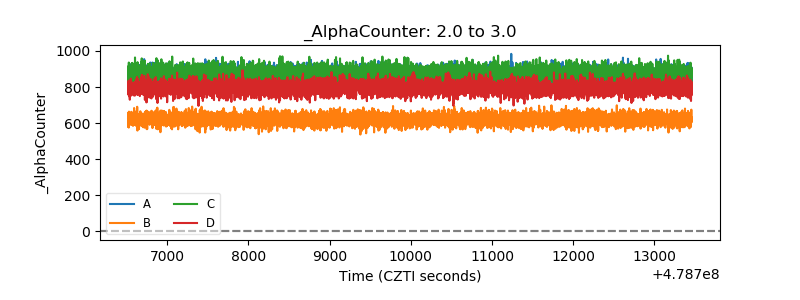 |
| _CPM_Rate | 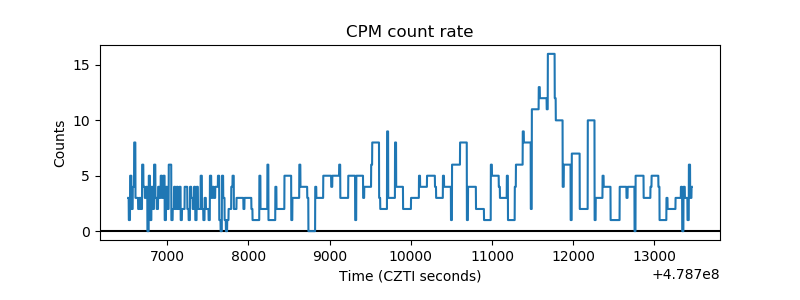 |
| CZT Counter | 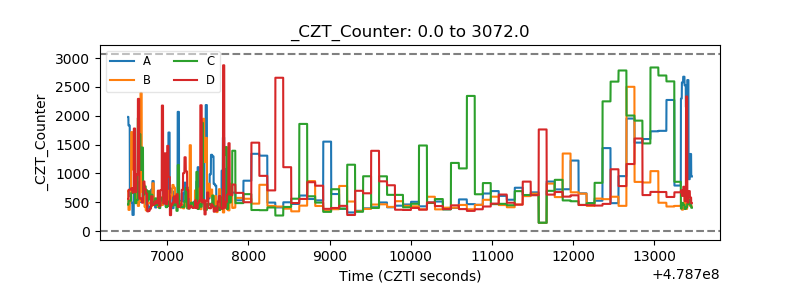 |
| +2.5 Volts monitor | 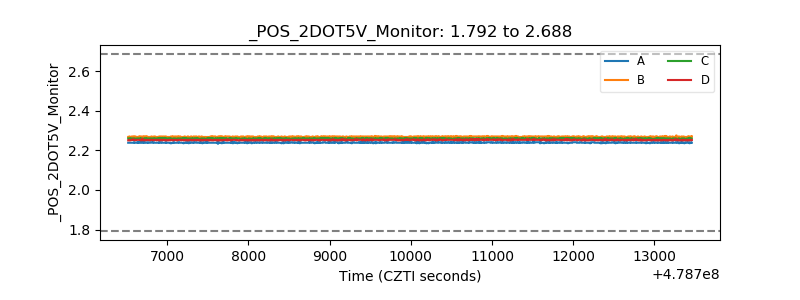 |
| +5 Volts monitor | 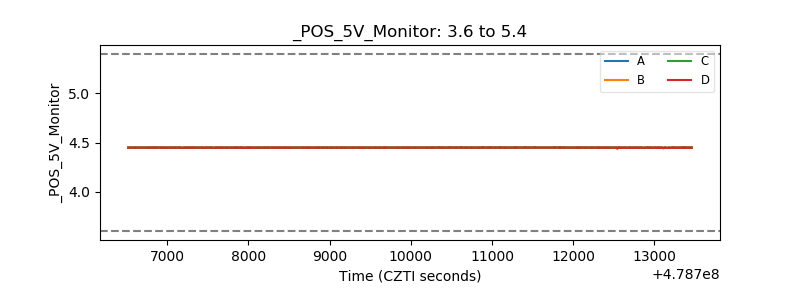 |
| _ROLL_ROT | 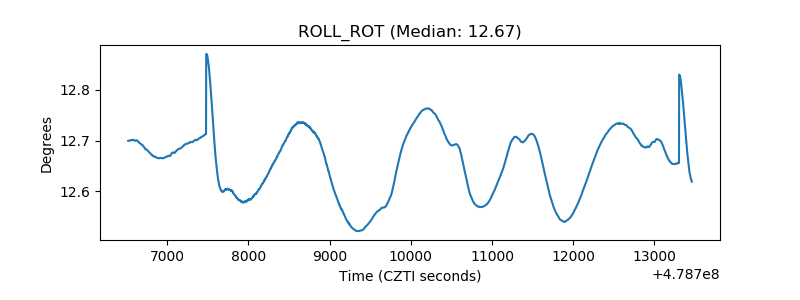 |
| _Roll_DEC | 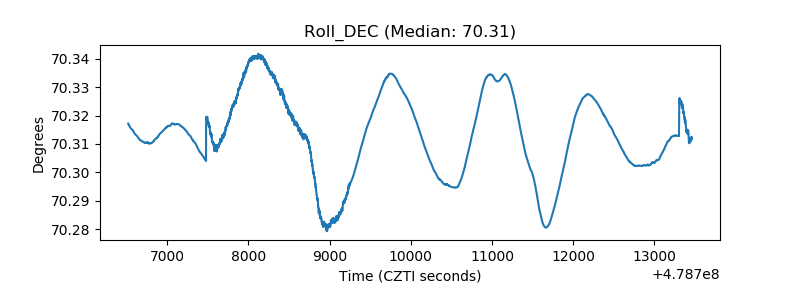 |
| _Roll_RA | 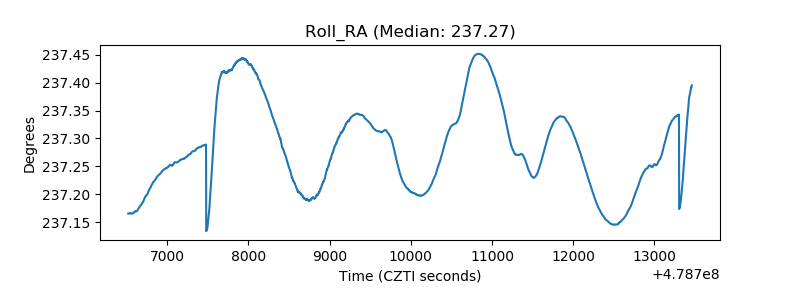 |
| Veto Counter | 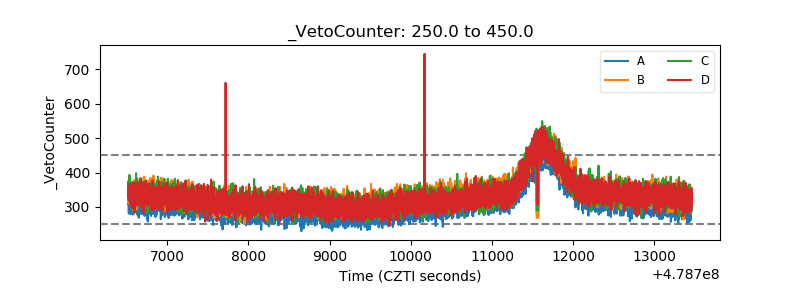 |