| Param | Original file | Final file |
|---|---|---|
| Filename | modeM0/AS1C07_001T02_9000006452_51006cztM0_level2.fits | modeM0/AS1C07_001T02_9000006452_51006cztM0_level2_quad_clean.evt |
| Size (bytes) | 687,870,720 | 98,573,760 |
| Size | 656.0 MB | 94.0 MB |
| Events in quadrant A | 7,998,844 | 601,289 |
| Events in quadrant B | 5,033,649 | 710,208 |
| Events in quadrant C | 6,284,155 | 571,394 |
| Events in quadrant D | 5,581,533 | 593,456 |
| Mode SS | |||
|---|---|---|---|
| Quadrant | BADHDUFLAG | Total packets | Discarded packets |
| A | 0 | 146 | 0 |
| B | 0 | 146 | 0 |
| C | 0 | 146 | 0 |
| D | 0 | 146 | 0 |
| Mode M0 | |||
|---|---|---|---|
| Quadrant | BADHDUFLAG | Total packets | Discarded packets |
| A | 0 | 28923 | 0 |
| B | 0 | 20144 | 1 |
| C | 0 | 23810 | 0 |
| D | 0 | 21688 | 0 |
| Quadrant | Total seconds | Saturated seconds | Saturation percentage |
|---|---|---|---|
| A | 7297 | 1061 | 14.540222% |
| B | 7296 | 344 | 4.714912% |
| C | 7297 | 912 | 12.498287% |
| D | 7297 | 275 | 3.768672% |
Noise dominated data is calculated using 1-second bins in cleaned event files. If a bin has >2000 counts, and if more than 50% of those come from <1% of pixels, then it is considered to be noise-dominated and hence unusable.
| Quadrant | # 1 sec bins | Bins with >0 counts | Bins with >2000 counts | High rate bins dominated by noise | Noise dominated (total time) | Noise dominated (detector-on time) | Marked lightcurve |
|---|---|---|---|---|---|---|---|
| A | 7297 | 7297 | 1014 | 1014 | 13.90% | 13.90% | 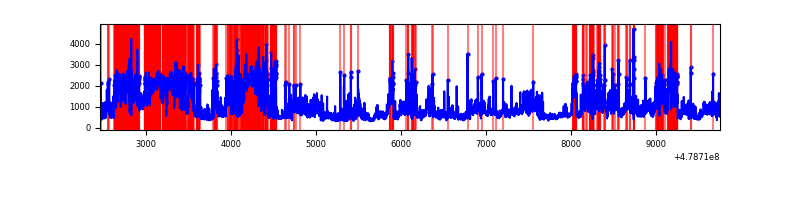 |
| B | 7296 | 7296 | 196 | 196 | 2.69% | 2.69% | 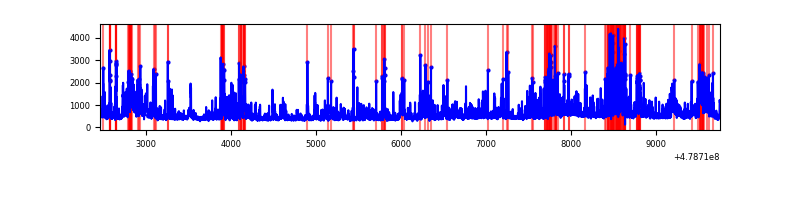 |
| C | 7297 | 7297 | 770 | 770 | 10.55% | 10.55% | 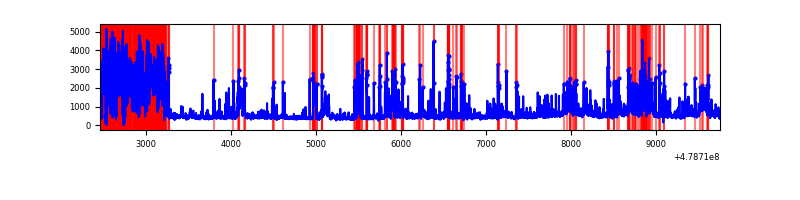 |
| D | 7297 | 7297 | 250 | 250 | 3.43% | 3.43% | 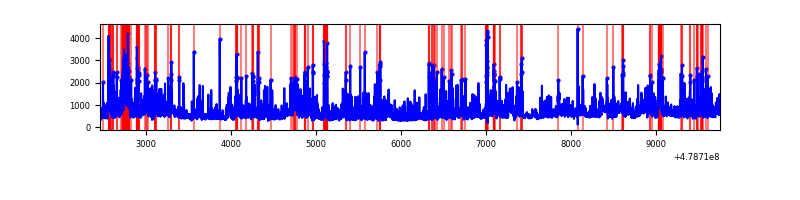 |
Top three noisy pixels from each quadrant. If the there are fewer than three noisy pixels in the level2.evt file, extra rows are filled as -1
| Pixel properties | Quadrant properties | ||||||
|---|---|---|---|---|---|---|---|
| Quadrant | DetID | PixID | Counts | Sigma | Mean | Median | Sigma |
| A | 10 | 253 | 2696061 | 14757.68 | 730 | 712 | 182.6 |
| A | 12 | 80 | 812188 | 4443.02 | 730 | 712 | 182.6 |
| A | 4 | 249 | 279970 | 1529.0 | 730 | 712 | 182.6 |
| B | 4 | 171 | 544311 | 3427.85 | 743 | 719 | 158.6 |
| B | 12 | 32 | 510064 | 3211.89 | 743 | 719 | 158.6 |
| B | 4 | 81 | 268364 | 1687.75 | 743 | 719 | 158.6 |
| C | 13 | 3 | 2103151 | 10946.52 | 688 | 683 | 192.1 |
| C | 15 | 147 | 316056 | 1641.99 | 688 | 683 | 192.1 |
| C | 15 | 224 | 285798 | 1484.45 | 688 | 683 | 192.1 |
| D | 8 | 176 | 402166 | 1959.45 | 728 | 699 | 204.9 |
| D | 2 | 216 | 365588 | 1780.92 | 728 | 699 | 204.9 |
| D | 15 | 108 | 326307 | 1589.2 | 728 | 699 | 204.9 |
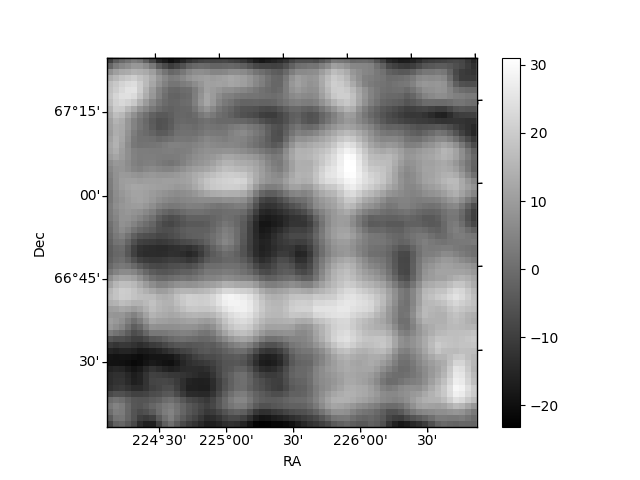
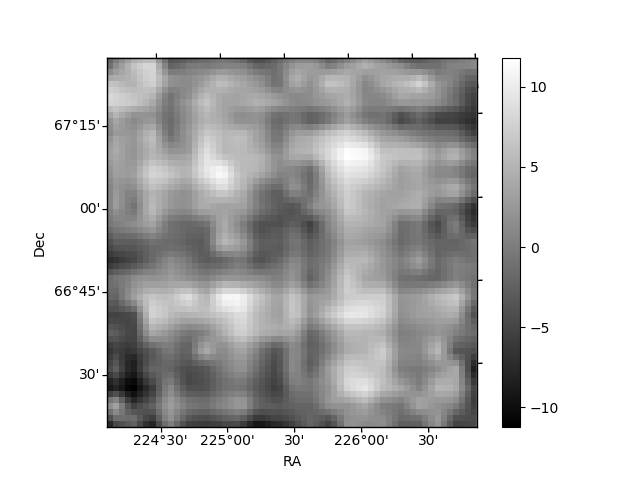
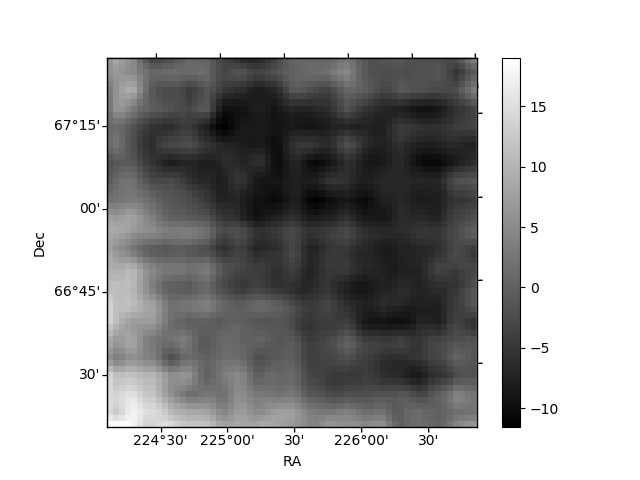
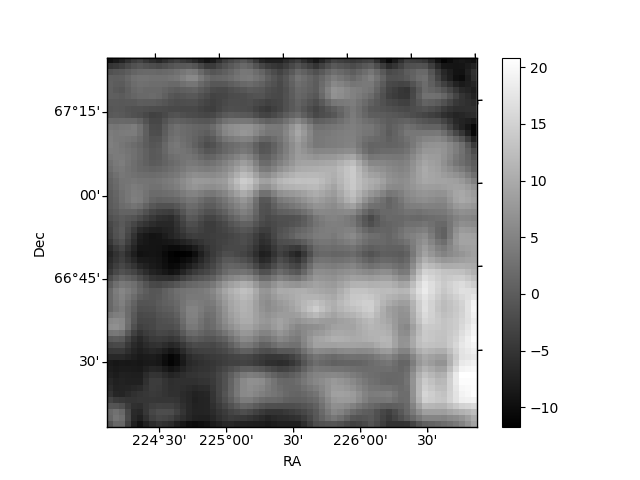
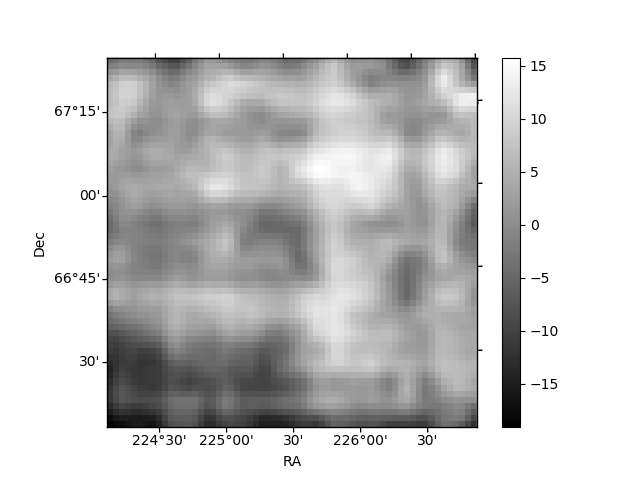
Histogram calculated using DETX and DETY for each event in the final _common_clean file
| Quadrant A | 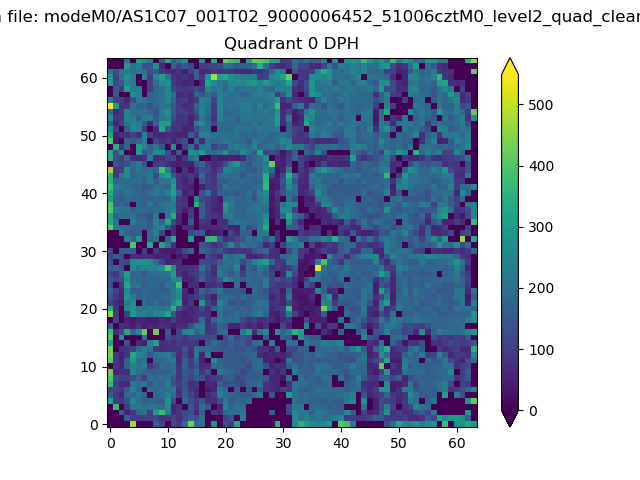 |
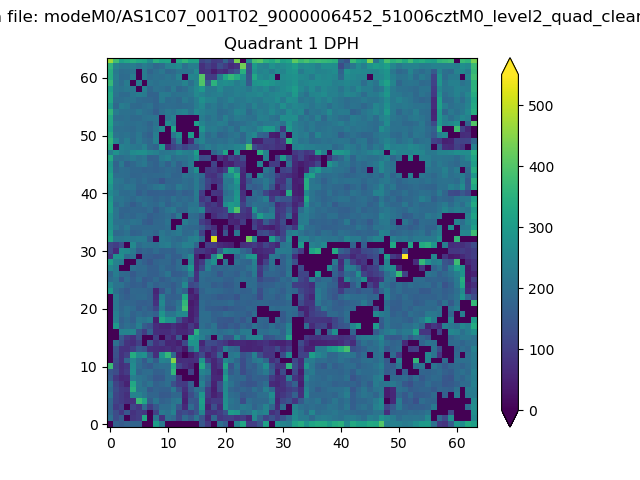 |
Quadrant B |
|---|---|---|---|
| Quadrant D | 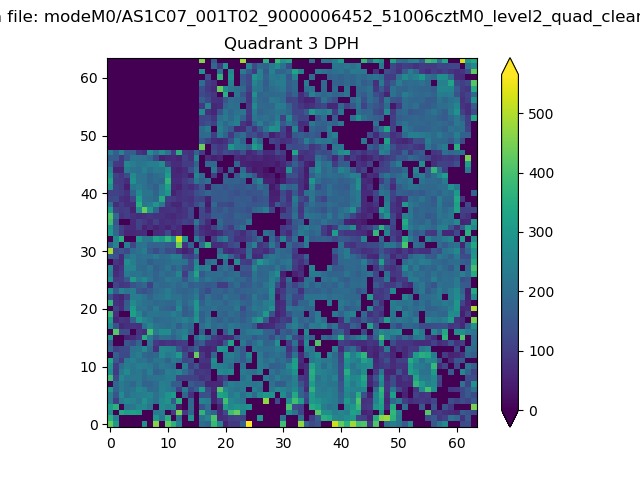 |
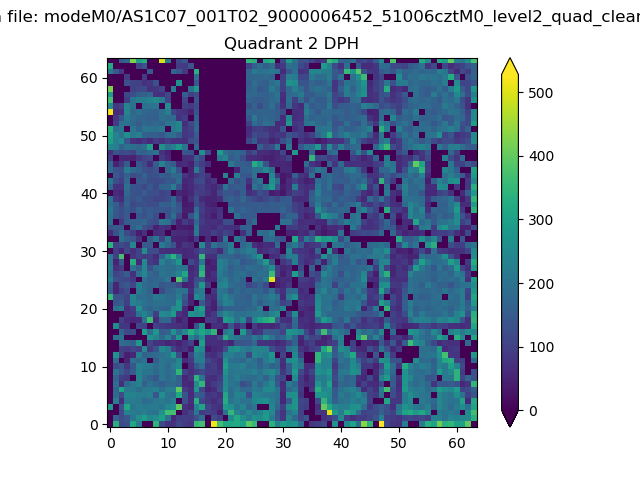 |
Quadrant C |
| Plot type | Count rate plots | Images |
|---|---|---|
| Comparison with Poisson distribution Blue bars denote a histogram of data divided into 1 sec bins. Red curve is a Poisson curve with rate = median count rate of data. |
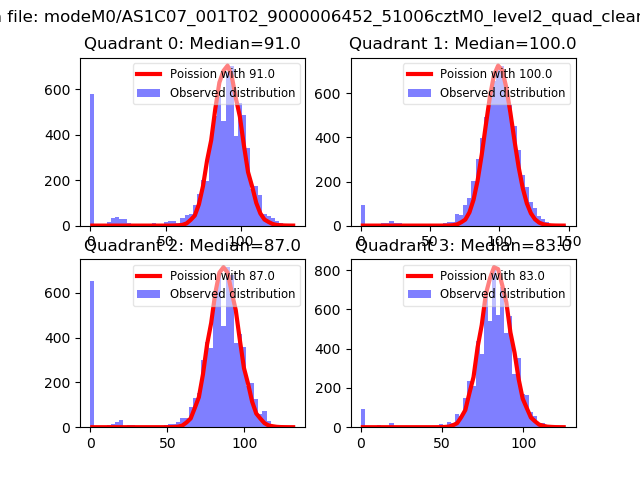 |
 |
| Quadrant-wise count rates Data is divided into 100 sec bins |
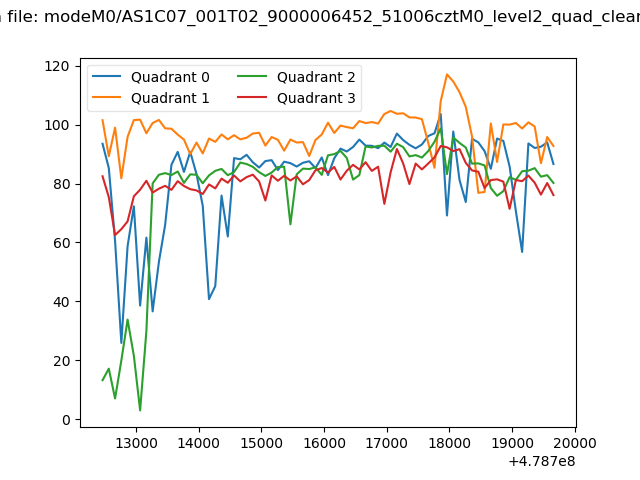 |
|
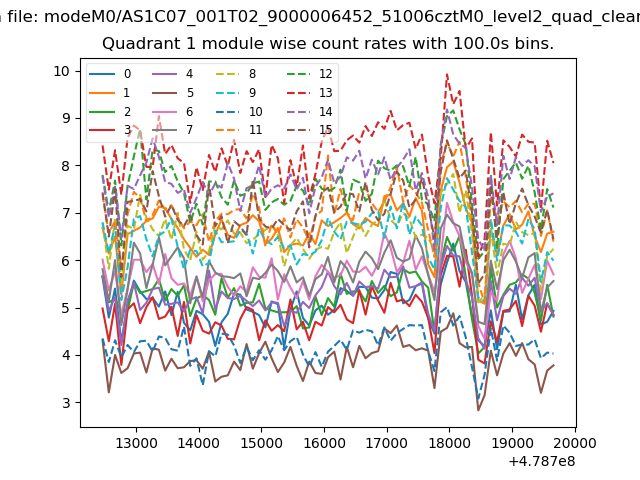
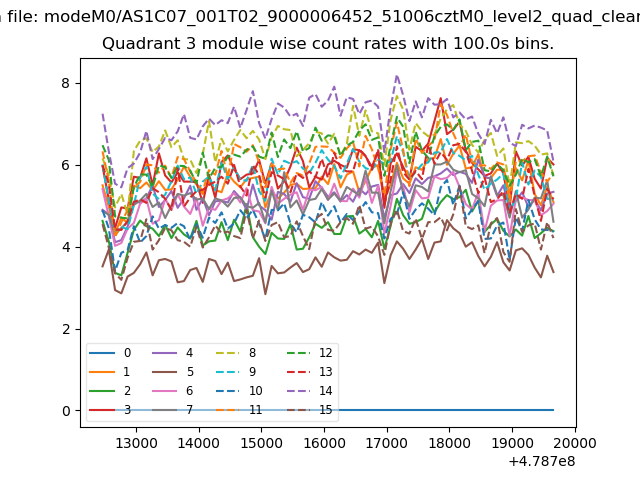
| Module-wise count rates for Quadrant A Data is divided into 100 sec bins |
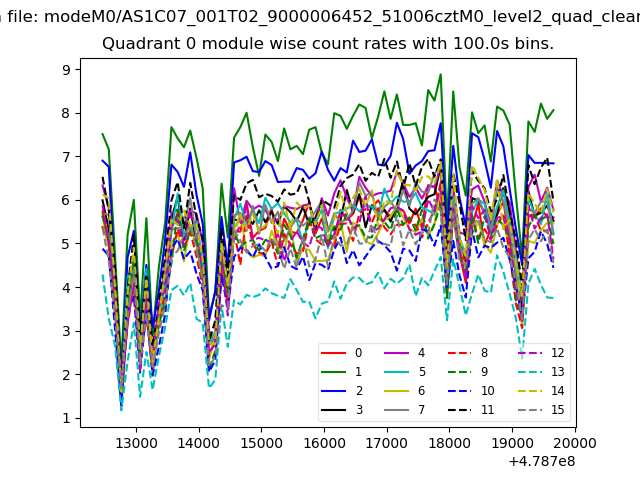 |
 |
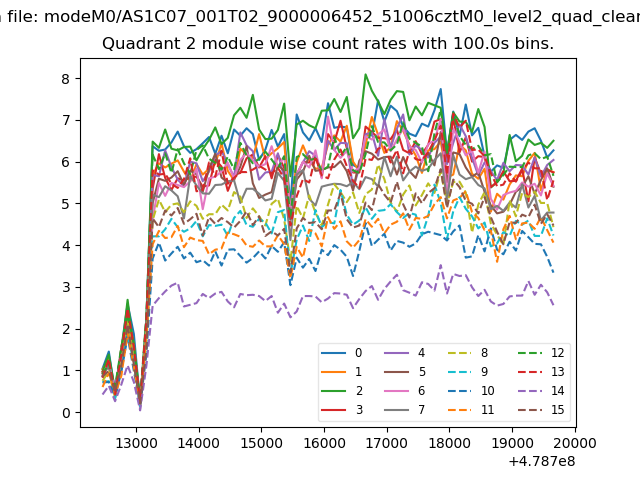
| Module-wise count rates for Quadrant B Data is divided into 100 sec bins |
 |
 |
| Module-wise count rates for Quadrant C Data is divided into 100 sec bins |
 |
 |
| Module-wise count rates for Quadrant D Data is divided into 100 sec bins |
 |
 |
| Parameter | Plot |
|---|---|
| CZT HV Monitor | 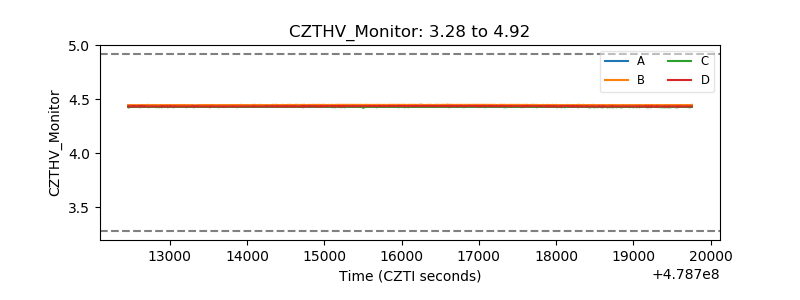 |
| D_VDD | 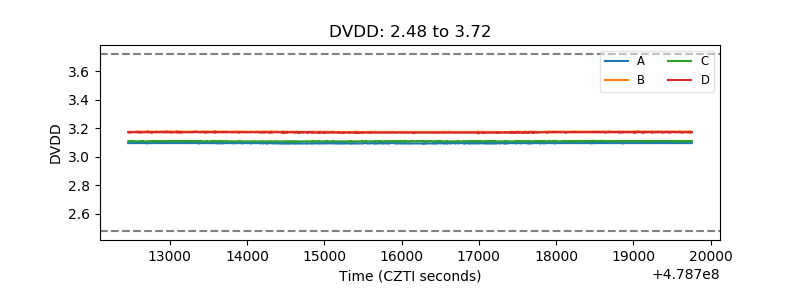 |
| Temperature 1 | 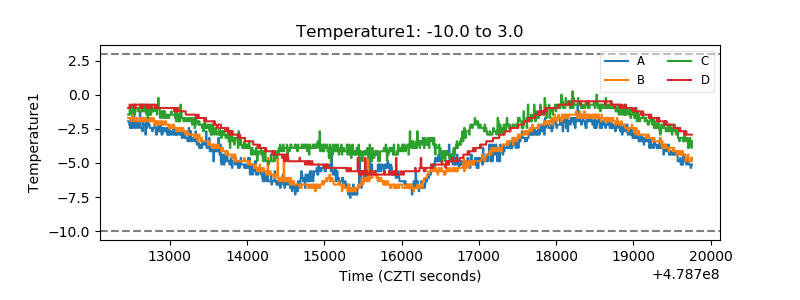 |
| Veto HV Monitor | 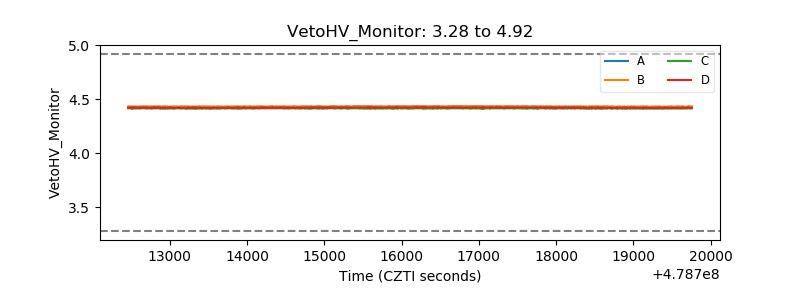 |
| Veto LLD | 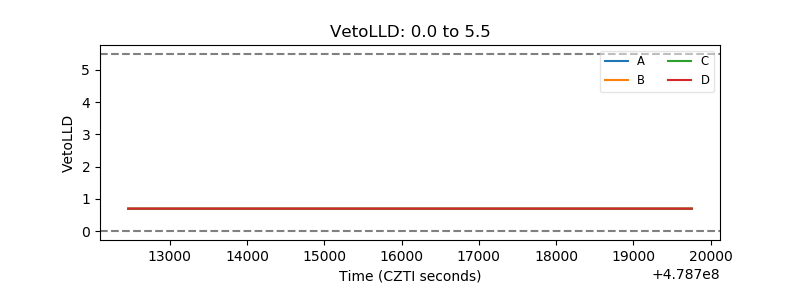 |
| Alpha Counter | 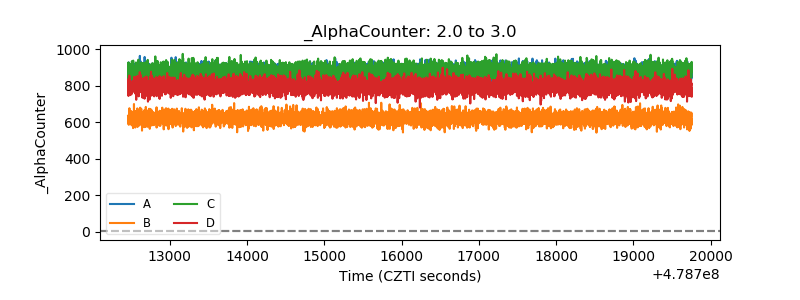 |
| _CPM_Rate | 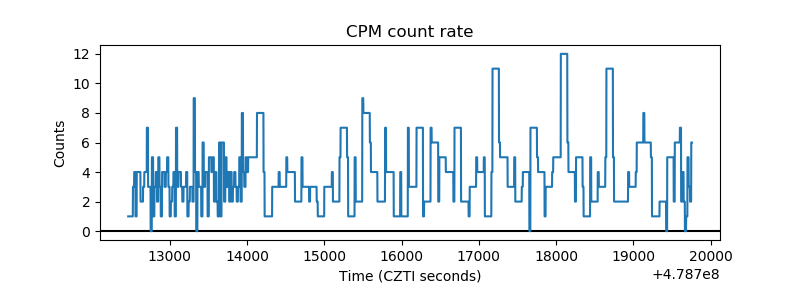 |
| CZT Counter | 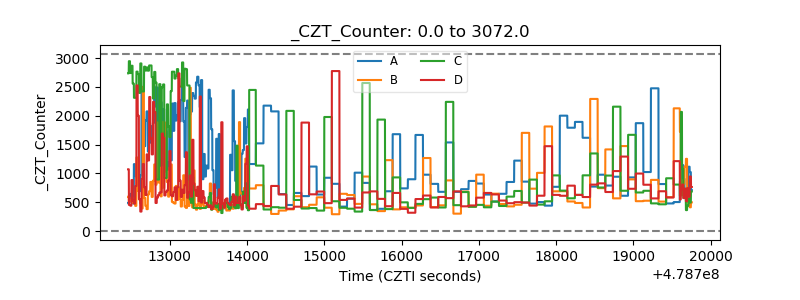 |
| +2.5 Volts monitor |  |
| +5 Volts monitor | 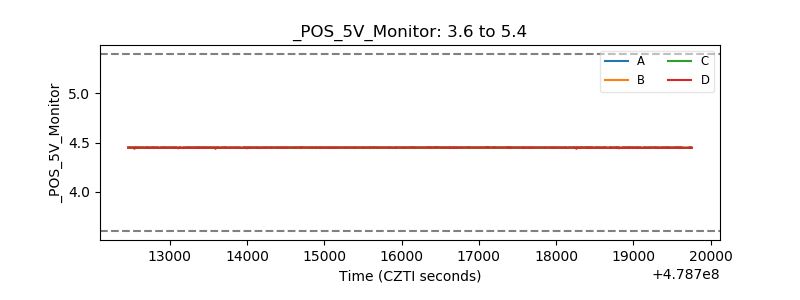 |
| _ROLL_ROT | 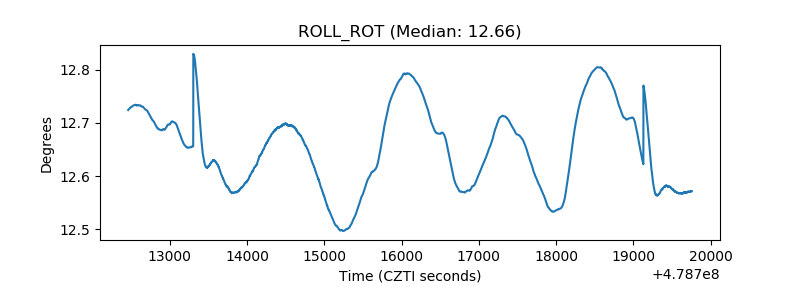 |
| _Roll_DEC | 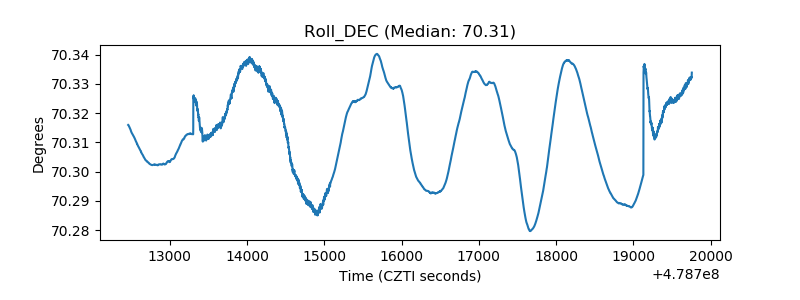 |
| _Roll_RA | 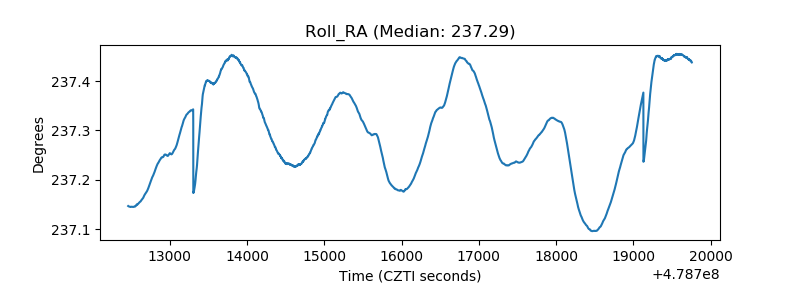 |
| Veto Counter | 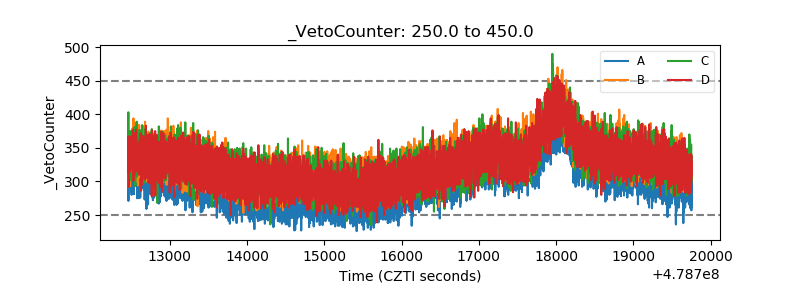 |