| Param | Original file | Final file |
|---|---|---|
| Filename | modeM0/AS1C07_001T02_9000006452_51007cztM0_level2.fits | modeM0/AS1C07_001T02_9000006452_51007cztM0_level2_quad_clean.evt |
| Size (bytes) | 780,200,640 | 107,015,040 |
| Size | 744.1 MB | 102.1 MB |
| Events in quadrant A | 7,614,670 | 667,601 |
| Events in quadrant B | 6,871,584 | 741,361 |
| Events in quadrant C | 6,280,417 | 668,546 |
| Events in quadrant D | 7,503,423 | 613,230 |
| Mode SS | |||
|---|---|---|---|
| Quadrant | BADHDUFLAG | Total packets | Discarded packets |
| A | 0 | 158 | 0 |
| B | 0 | 158 | 0 |
| C | 0 | 158 | 0 |
| D | 0 | 158 | 0 |
| Mode M0 | |||
|---|---|---|---|
| Quadrant | BADHDUFLAG | Total packets | Discarded packets |
| A | 0 | 28159 | 4 |
| B | 0 | 25903 | 0 |
| C | 0 | 24189 | 0 |
| D | 0 | 27825 | 0 |
| Quadrant | Total seconds | Saturated seconds | Saturation percentage |
|---|---|---|---|
| A | 7899 | 902 | 11.419167% |
| B | 7899 | 761 | 9.634131% |
| C | 7899 | 510 | 6.456513% |
| D | 7899 | 751 | 9.507533% |
Noise dominated data is calculated using 1-second bins in cleaned event files. If a bin has >2000 counts, and if more than 50% of those come from <1% of pixels, then it is considered to be noise-dominated and hence unusable.
| Quadrant | # 1 sec bins | Bins with >0 counts | Bins with >2000 counts | High rate bins dominated by noise | Noise dominated (total time) | Noise dominated (detector-on time) | Marked lightcurve |
|---|---|---|---|---|---|---|---|
| A | 7899 | 7899 | 656 | 656 | 8.30% | 8.30% | 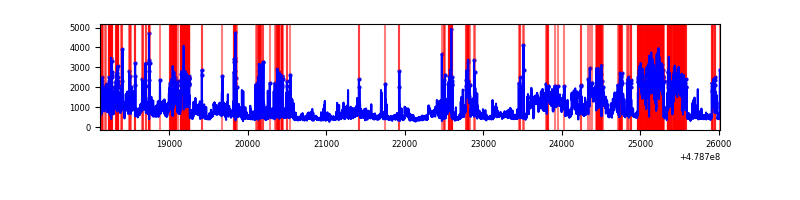 |
| B | 7899 | 7899 | 534 | 534 | 6.76% | 6.76% | 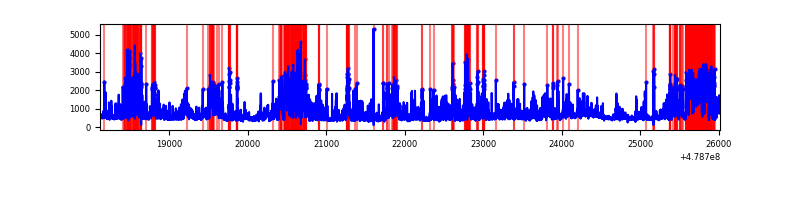 |
| C | 7899 | 7899 | 423 | 423 | 5.36% | 5.36% | 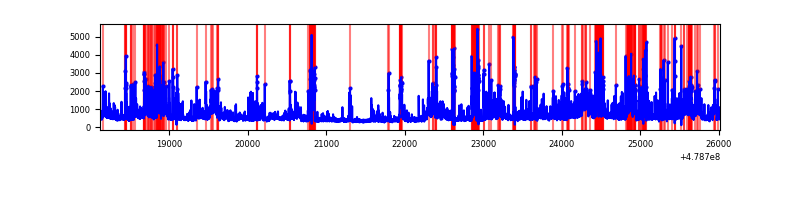 |
| D | 7899 | 7899 | 650 | 650 | 8.23% | 8.23% | 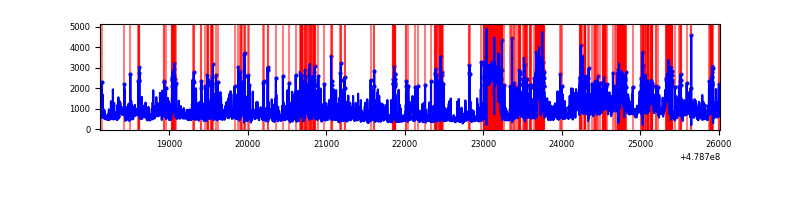 |
Top three noisy pixels from each quadrant. If the there are fewer than three noisy pixels in the level2.evt file, extra rows are filled as -1
| Pixel properties | Quadrant properties | ||||||
|---|---|---|---|---|---|---|---|
| Quadrant | DetID | PixID | Counts | Sigma | Mean | Median | Sigma |
| A | 10 | 253 | 2566379 | 12753.3 | 806 | 784 | 201.2 |
| A | 12 | 80 | 422365 | 2095.63 | 806 | 784 | 201.2 |
| A | 3 | 130 | 365537 | 1813.15 | 806 | 784 | 201.2 |
| B | 4 | 171 | 1112977 | 6435.96 | 808 | 781 | 172.8 |
| B | 15 | 32 | 639624 | 3696.8 | 808 | 781 | 172.8 |
| B | 12 | 32 | 409772 | 2366.71 | 808 | 781 | 172.8 |
| C | 15 | 1 | 795261 | 3611.49 | 793 | 786 | 220.0 |
| C | 15 | 147 | 574586 | 2608.36 | 793 | 786 | 220.0 |
| C | 15 | 224 | 316746 | 1436.28 | 793 | 786 | 220.0 |
| D | 7 | 126 | 1275645 | 5955.93 | 776 | 752 | 214.1 |
| D | 15 | 184 | 663393 | 3095.67 | 776 | 752 | 214.1 |
| D | 2 | 216 | 394475 | 1839.36 | 776 | 752 | 214.1 |
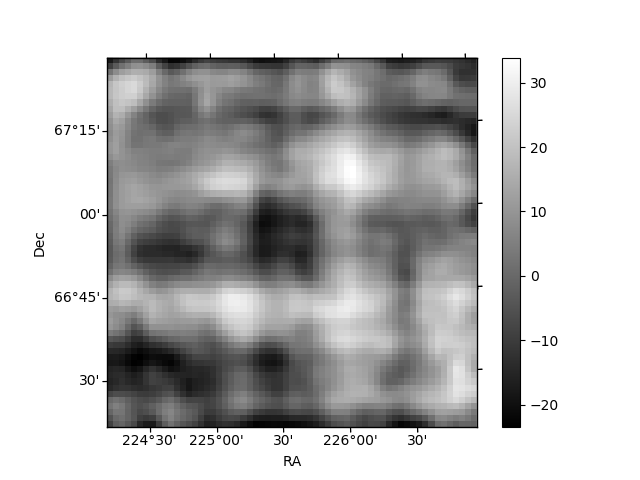
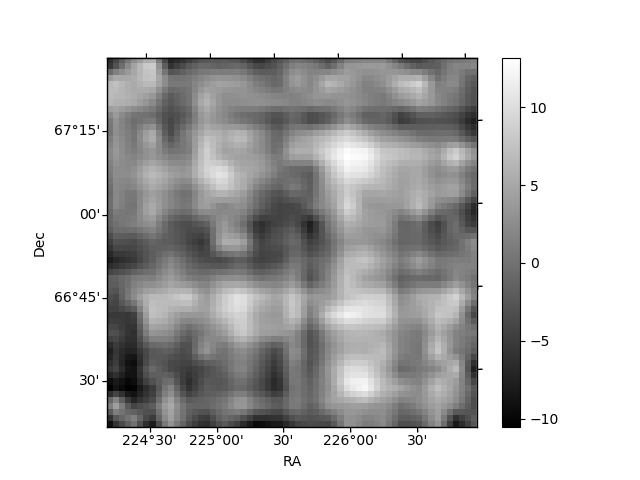
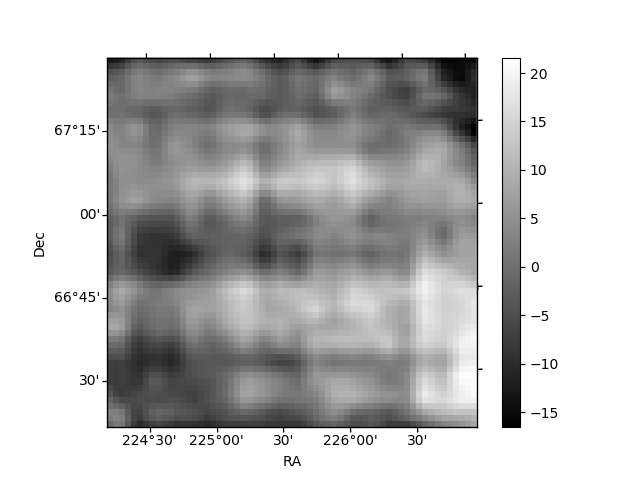
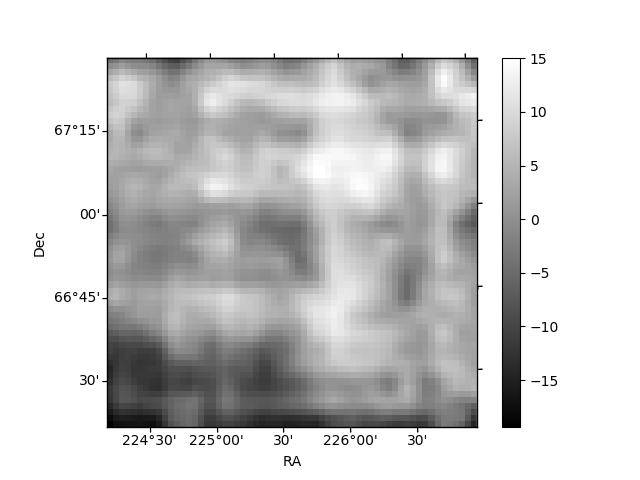
Histogram calculated using DETX and DETY for each event in the final _common_clean file
| Quadrant A | 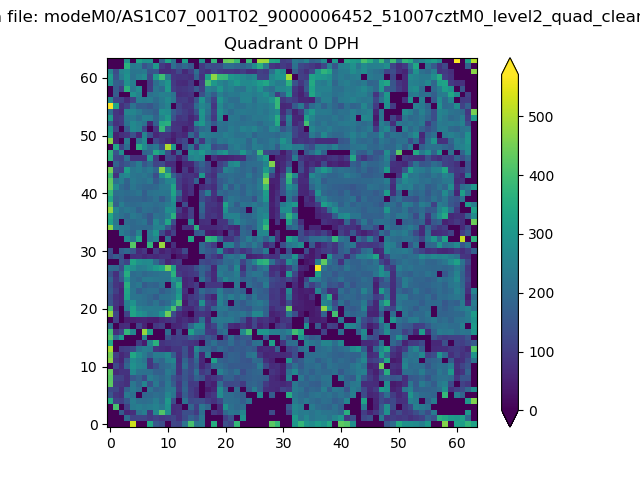 |
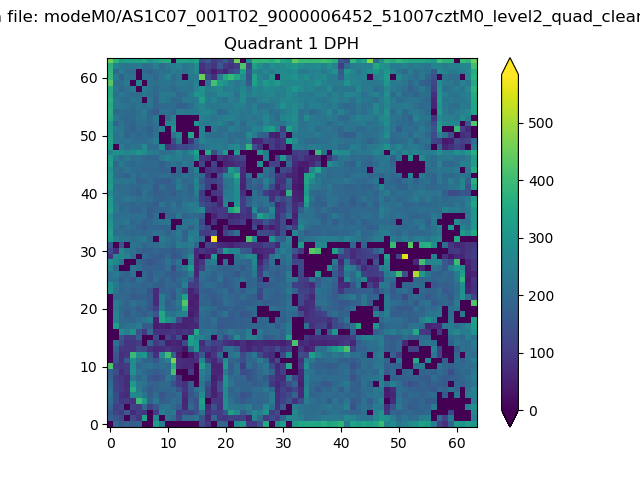 |
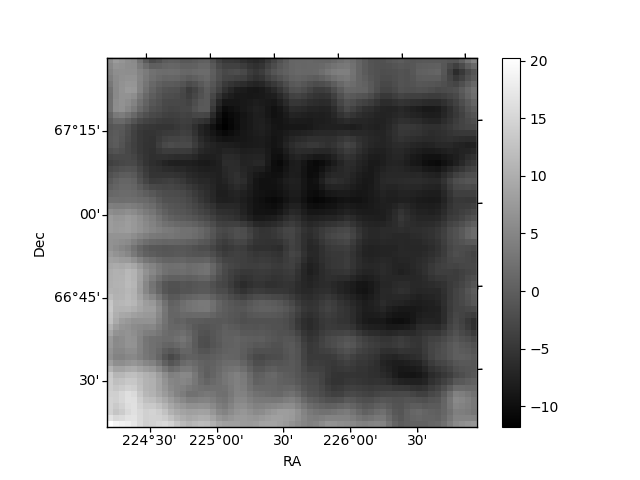
Quadrant B |
|---|---|---|---|
| Quadrant D | 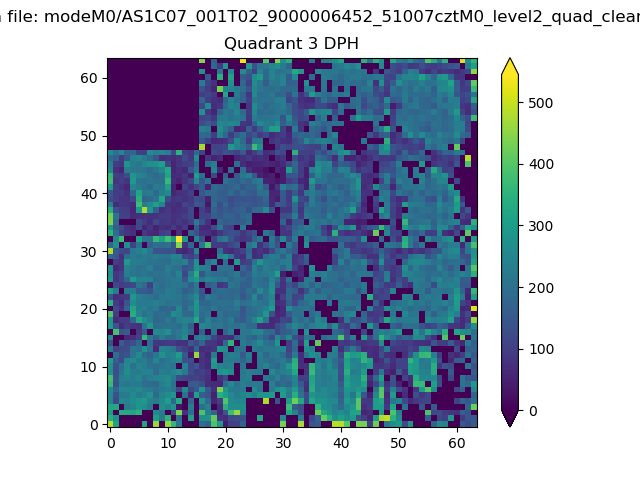 |
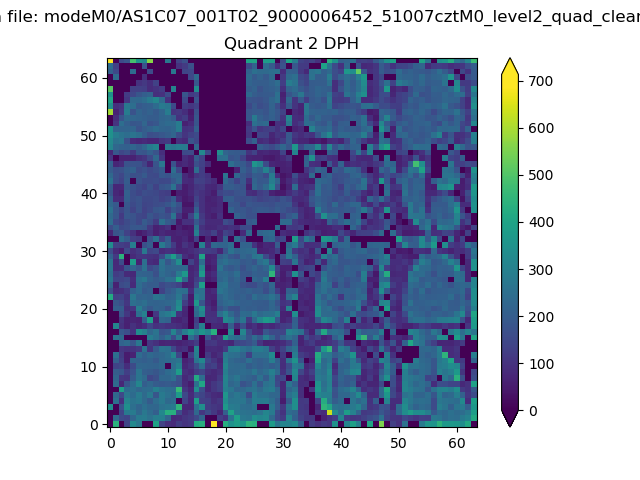 |
Quadrant C |
| Plot type | Count rate plots | Images |
|---|---|---|
| Comparison with Poisson distribution Blue bars denote a histogram of data divided into 1 sec bins. Red curve is a Poisson curve with rate = median count rate of data. |
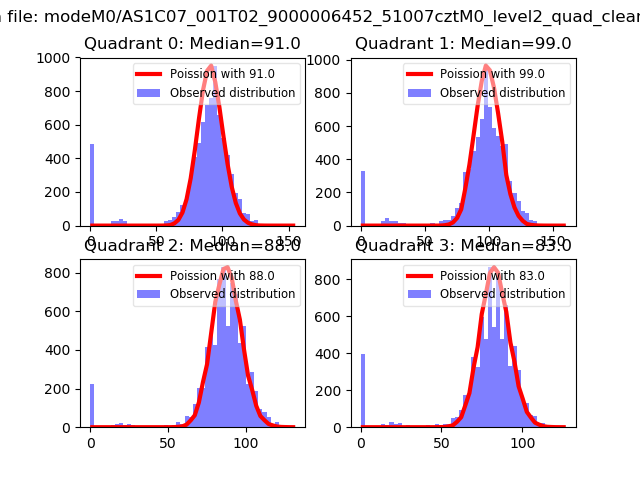 |
 |
| Quadrant-wise count rates Data is divided into 100 sec bins |
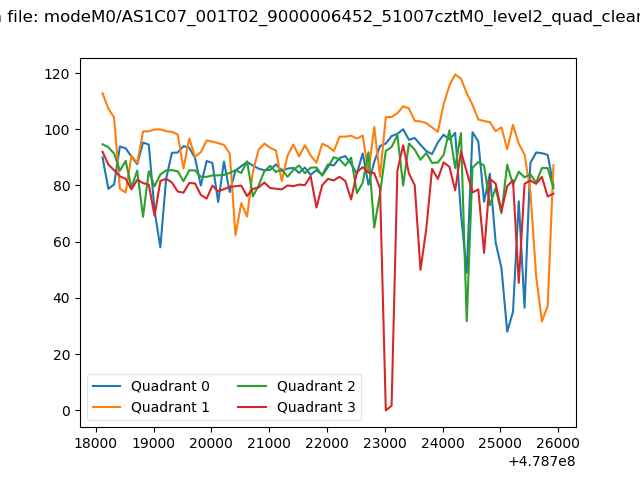 |
|
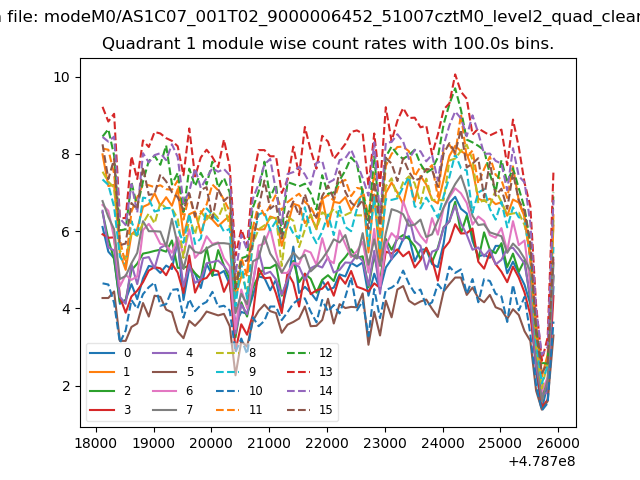
| Module-wise count rates for Quadrant A Data is divided into 100 sec bins |
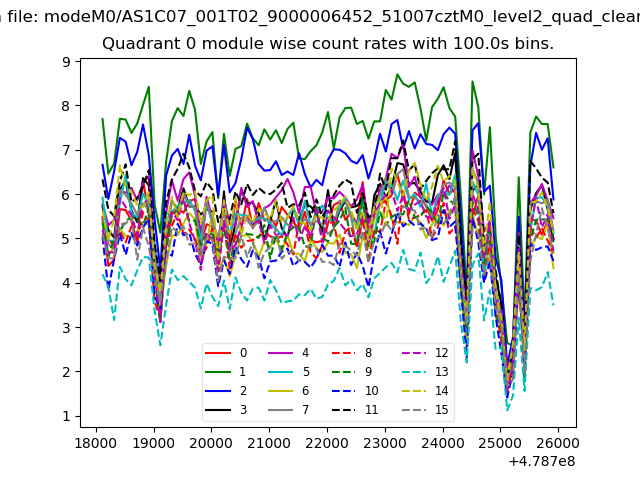 |
 |
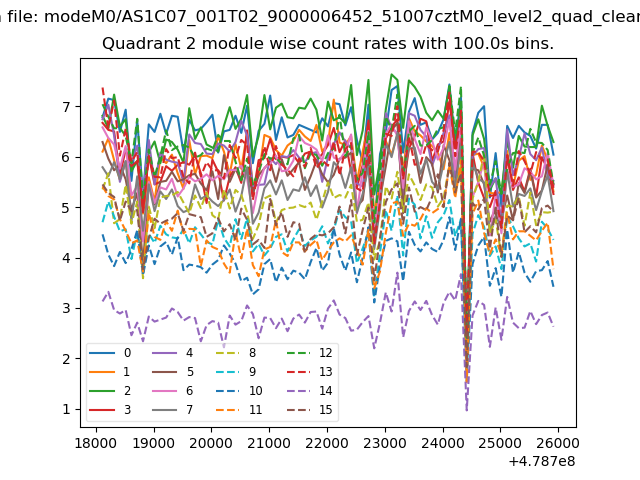
| Module-wise count rates for Quadrant B Data is divided into 100 sec bins |
 |
 |
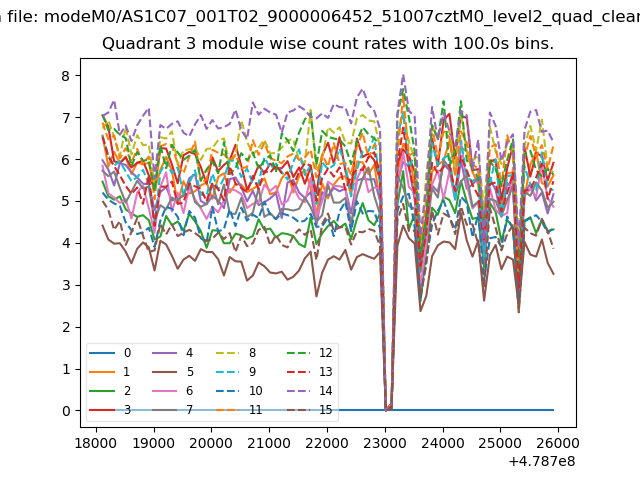
| Module-wise count rates for Quadrant C Data is divided into 100 sec bins |
 |
 |
| Module-wise count rates for Quadrant D Data is divided into 100 sec bins |
 |
 |
| Parameter | Plot |
|---|---|
| CZT HV Monitor | 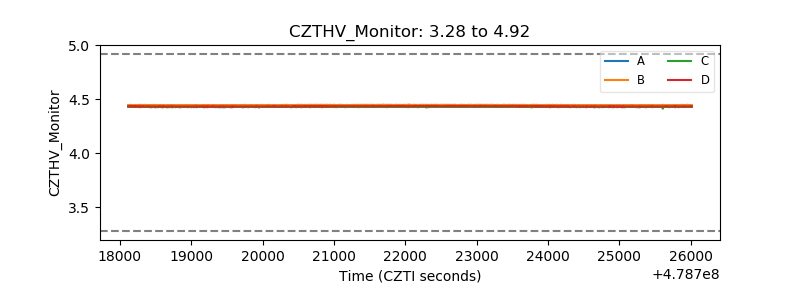 |
| D_VDD | 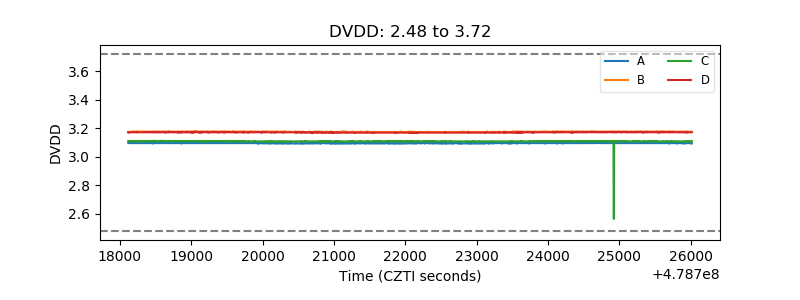 |
| Temperature 1 | 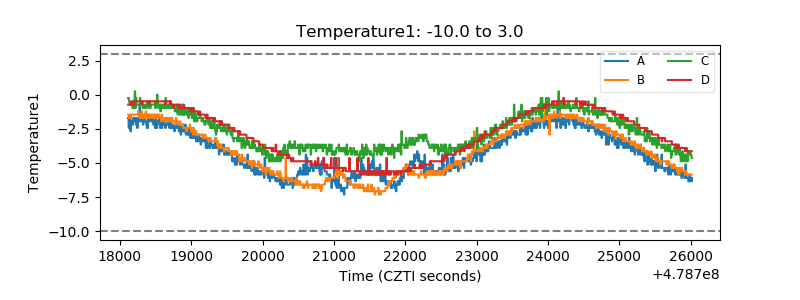 |
| Veto HV Monitor | 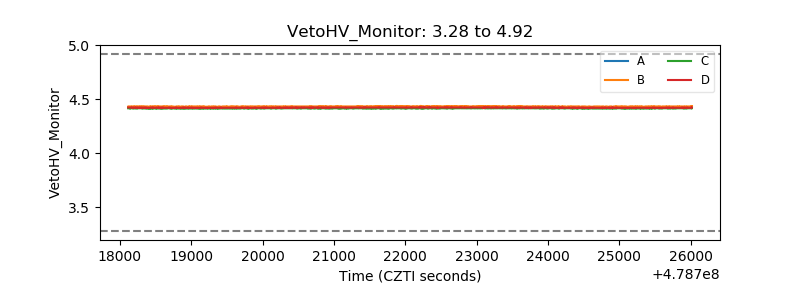 |
| Veto LLD | 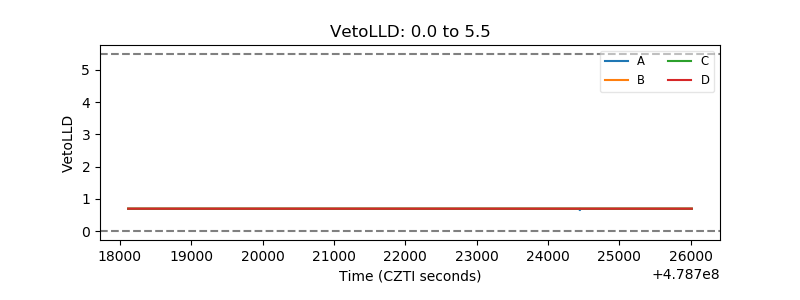 |
| Alpha Counter | 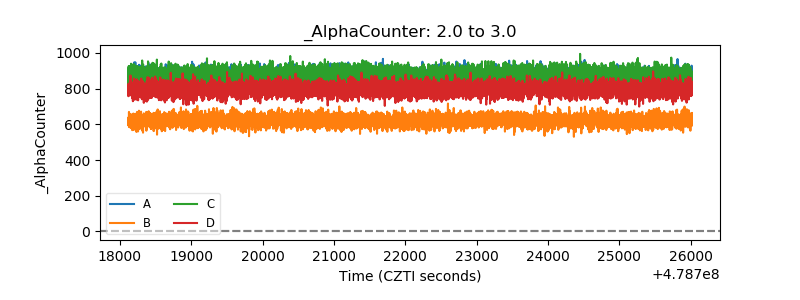 |
| _CPM_Rate | 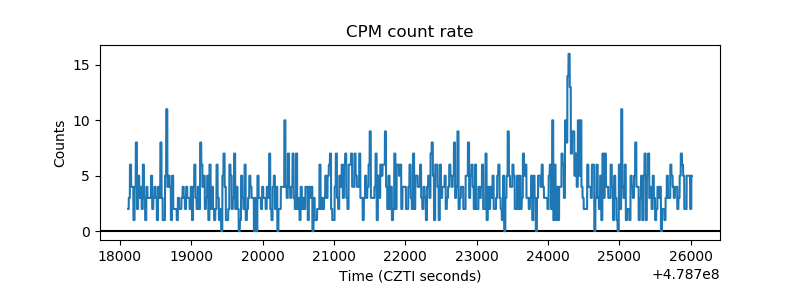 |
| CZT Counter | 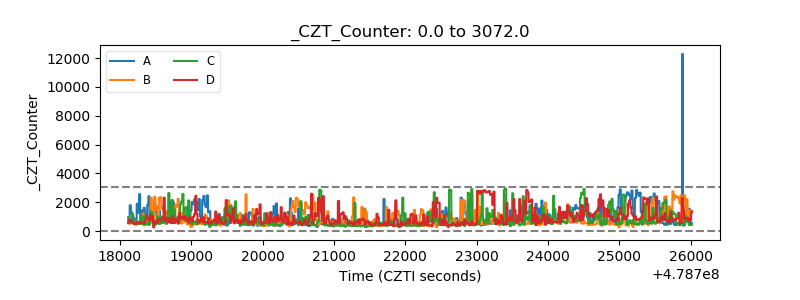 |
| +2.5 Volts monitor | 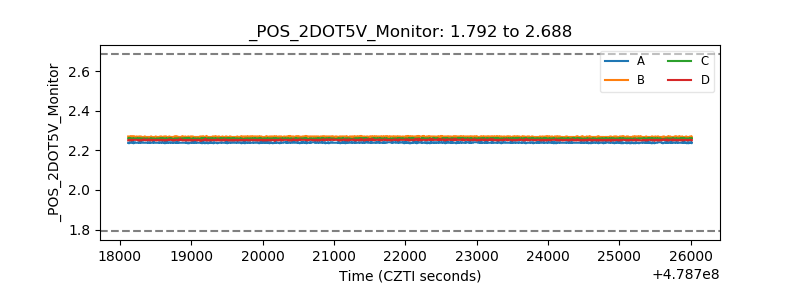 |
| +5 Volts monitor | 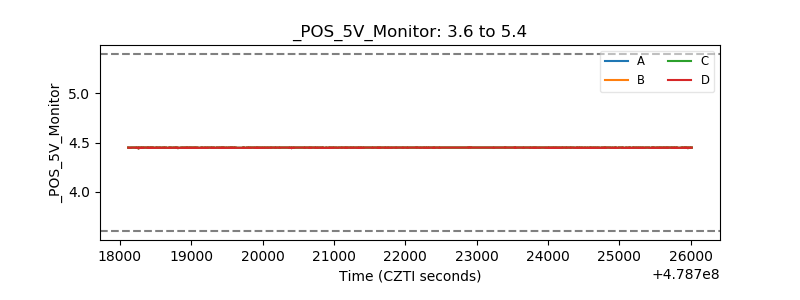 |
| _ROLL_ROT | 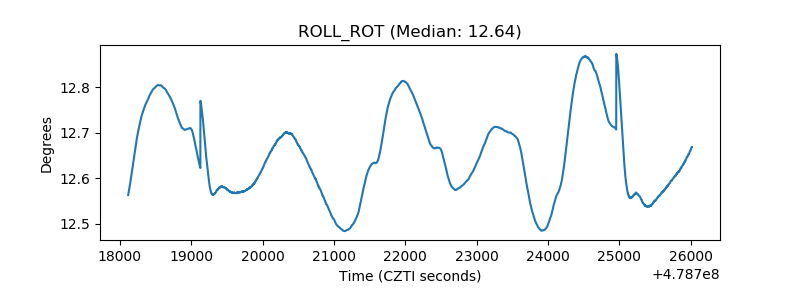 |
| _Roll_DEC |  |
| _Roll_RA | 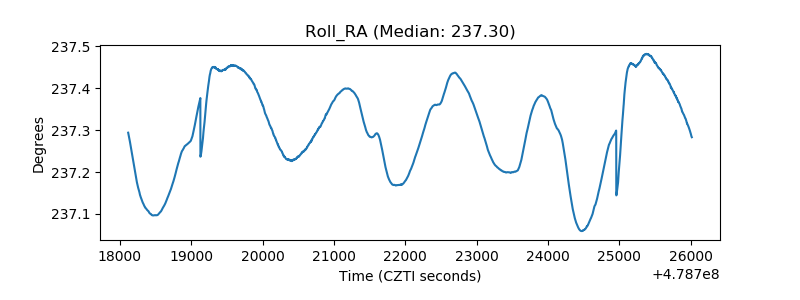 |
| Veto Counter | 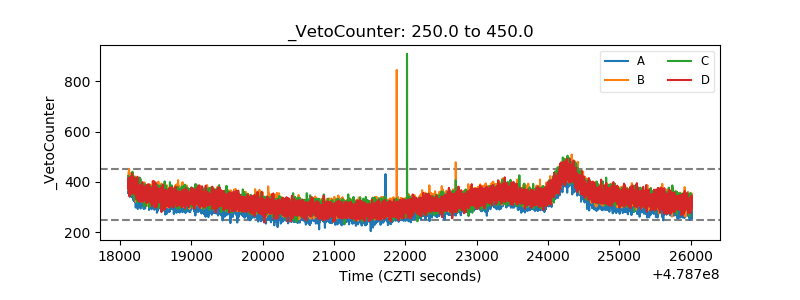 |