| Param | Original file | Final file |
|---|---|---|
| Filename | modeM0/AS1C07_001T02_9000006452_51011cztM0_level2.fits | modeM0/AS1C07_001T02_9000006452_51011cztM0_level2_quad_clean.evt |
| Size (bytes) | 611,789,760 | 100,054,080 |
| Size | 583.4 MB | 95.4 MB |
| Events in quadrant A | 5,243,495 | 638,050 |
| Events in quadrant B | 4,500,345 | 718,207 |
| Events in quadrant C | 8,269,490 | 553,387 |
| Events in quadrant D | 4,064,242 | 608,602 |
| Mode SS | |||
|---|---|---|---|
| Quadrant | BADHDUFLAG | Total packets | Discarded packets |
| A | 0 | 152 | 0 |
| B | 0 | 152 | 0 |
| C | 0 | 152 | 0 |
| D | 0 | 152 | 0 |
| Mode M9 | |||
|---|---|---|---|
| Quadrant | BADHDUFLAG | Total packets | Discarded packets |
| A | 0 | 15 | 0 |
| B | 0 | 15 | 0 |
| C | 0 | 15 | 0 |
| D | 0 | 15 | 0 |
| Mode M0 | |||
|---|---|---|---|
| Quadrant | BADHDUFLAG | Total packets | Discarded packets |
| A | 0 | 20639 | 2 |
| B | 0 | 18670 | 2 |
| C | 0 | 29658 | 2 |
| D | 0 | 17496 | 2 |
| Quadrant | Total seconds | Saturated seconds | Saturation percentage |
|---|---|---|---|
| A | 7338 | 422 | 5.750886% |
| B | 7339 | 214 | 2.915929% |
| C | 7339 | 1373 | 18.708271% |
| D | 7339 | 127 | 1.730481% |
Noise dominated data is calculated using 1-second bins in cleaned event files. If a bin has >2000 counts, and if more than 50% of those come from <1% of pixels, then it is considered to be noise-dominated and hence unusable.
| Quadrant | # 1 sec bins | Bins with >0 counts | Bins with >2000 counts | High rate bins dominated by noise | Noise dominated (total time) | Noise dominated (detector-on time) | Marked lightcurve |
|---|---|---|---|---|---|---|---|
| A | 8878 | 7340 | 317 | 317 | 3.57% | 4.32% | 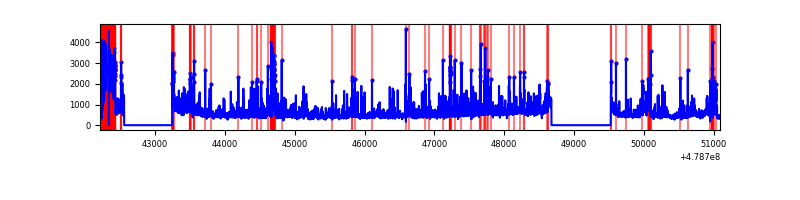 |
| B | 8879 | 7341 | 65 | 65 | 0.73% | 0.89% | 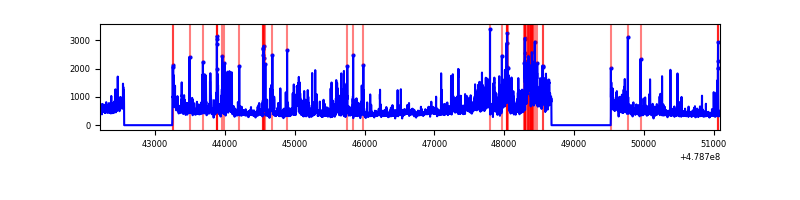 |
| C | 8879 | 7341 | 1145 | 1145 | 12.90% | 15.60% | 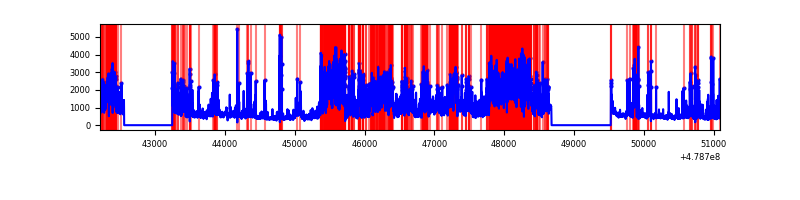 |
| D | 8879 | 7341 | 100 | 100 | 1.13% | 1.36% | 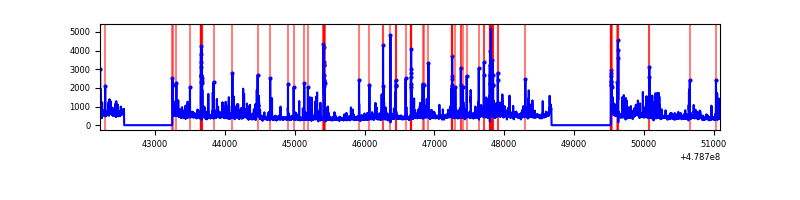 |
Top three noisy pixels from each quadrant. If the there are fewer than three noisy pixels in the level2.evt file, extra rows are filled as -1
| Pixel properties | Quadrant properties | ||||||
|---|---|---|---|---|---|---|---|
| Quadrant | DetID | PixID | Counts | Sigma | Mean | Median | Sigma |
| A | 14 | 254 | 662333 | 3582.14 | 742 | 726 | 184.7 |
| A | 15 | 239 | 471037 | 2546.4 | 742 | 726 | 184.7 |
| A | 10 | 253 | 286335 | 1546.37 | 742 | 726 | 184.7 |
| B | 4 | 171 | 495888 | 3059.4 | 758 | 731 | 161.8 |
| B | 4 | 81 | 343964 | 2120.71 | 758 | 731 | 161.8 |
| B | 12 | 32 | 163777 | 1007.4 | 758 | 731 | 161.8 |
| C | 4 | 12 | 2377339 | 12055.66 | 696 | 689 | 197.1 |
| C | 0 | 209 | 1209775 | 6133.14 | 696 | 689 | 197.1 |
| C | 15 | 158 | 391833 | 1984.1 | 696 | 689 | 197.1 |
| D | 2 | 216 | 193347 | 942.25 | 735 | 708 | 204.4 |
| D | 2 | 120 | 152708 | 743.47 | 735 | 708 | 204.4 |
| D | 10 | 181 | 137359 | 668.4 | 735 | 708 | 204.4 |
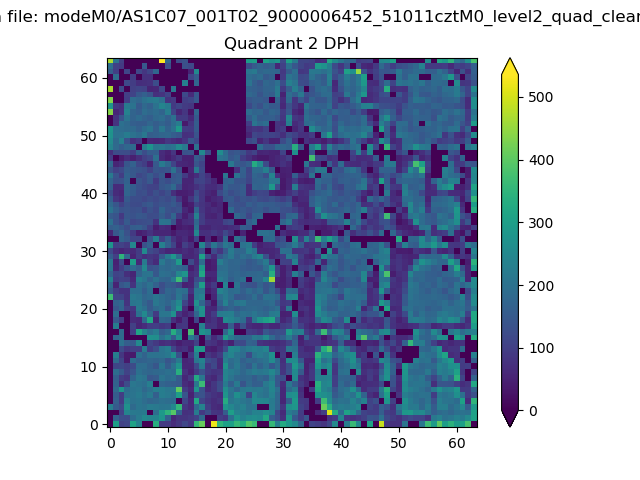
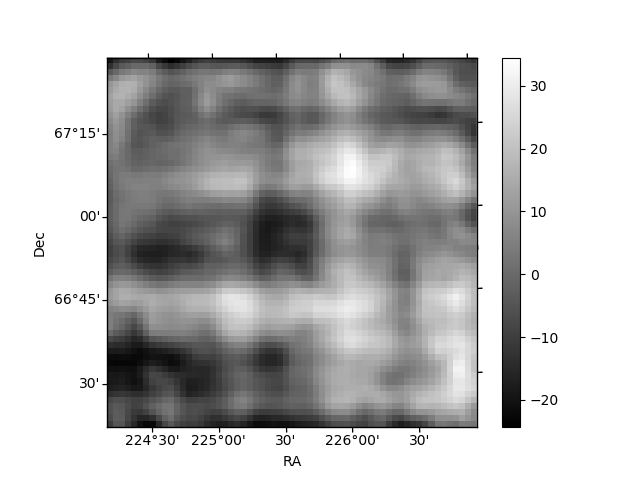
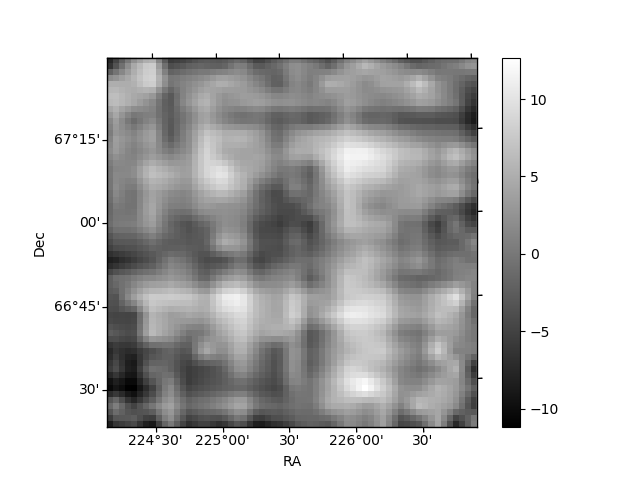
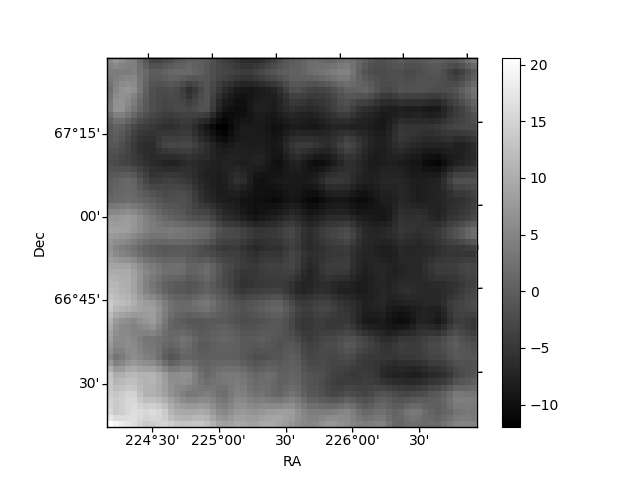
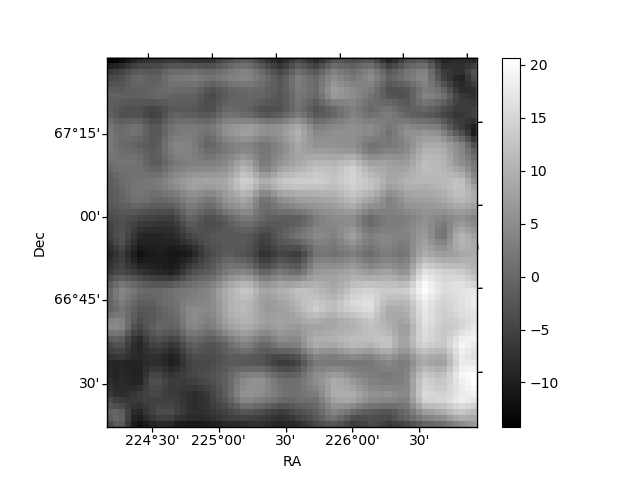
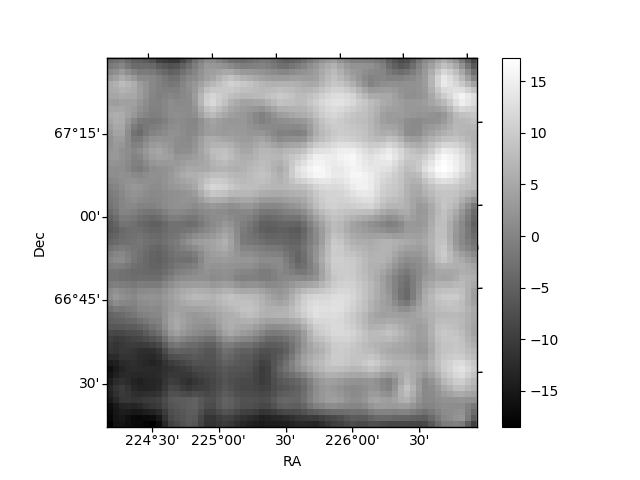
Histogram calculated using DETX and DETY for each event in the final _common_clean file
| Quadrant A | 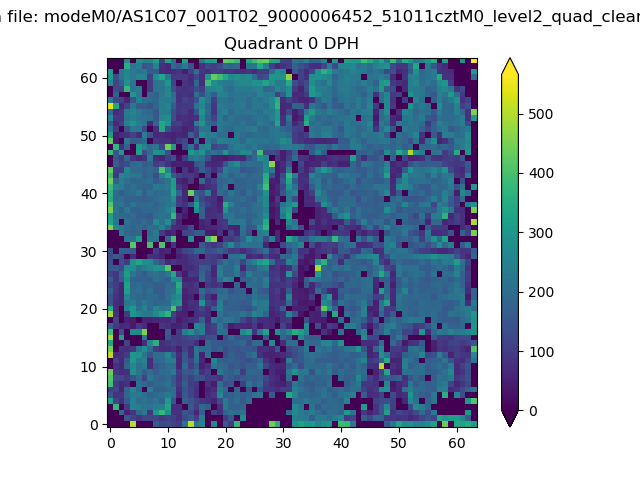 |
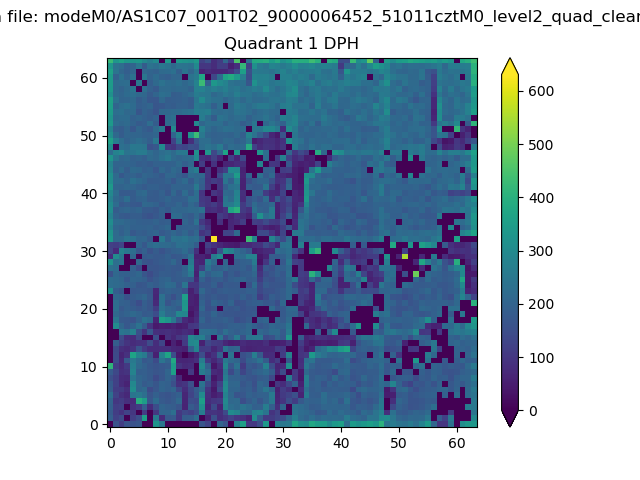 |
Quadrant B |
|---|---|---|---|
| Quadrant D | 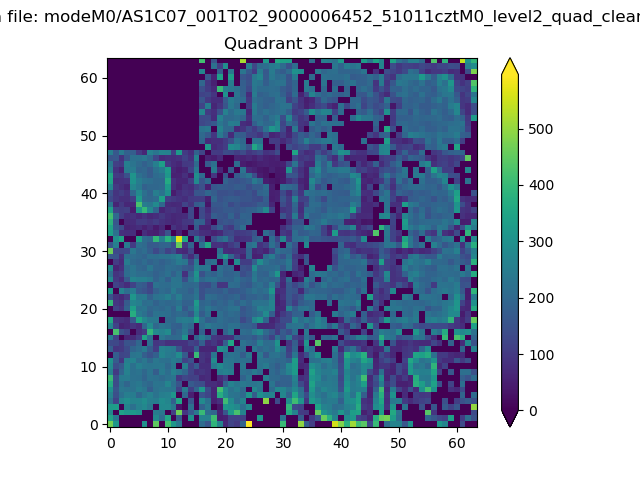 |
 |
Quadrant C |
| Plot type | Count rate plots | Images |
|---|---|---|
| Comparison with Poisson distribution Blue bars denote a histogram of data divided into 1 sec bins. Red curve is a Poisson curve with rate = median count rate of data. |
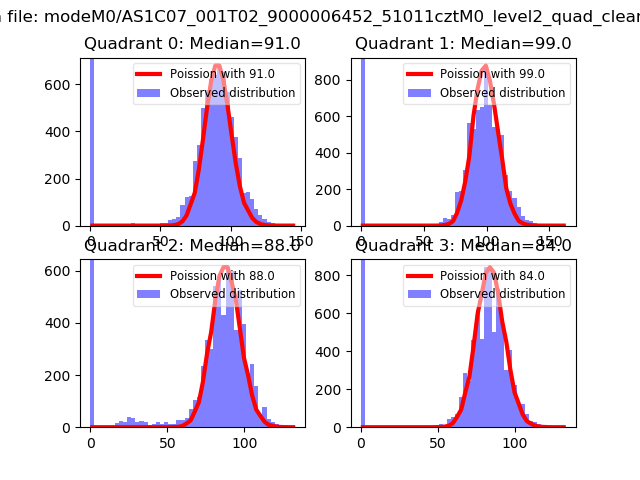 |
 |
| Quadrant-wise count rates Data is divided into 100 sec bins |
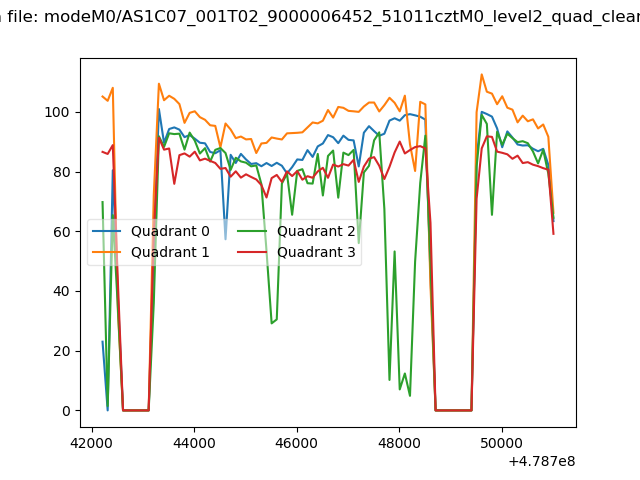 |
|
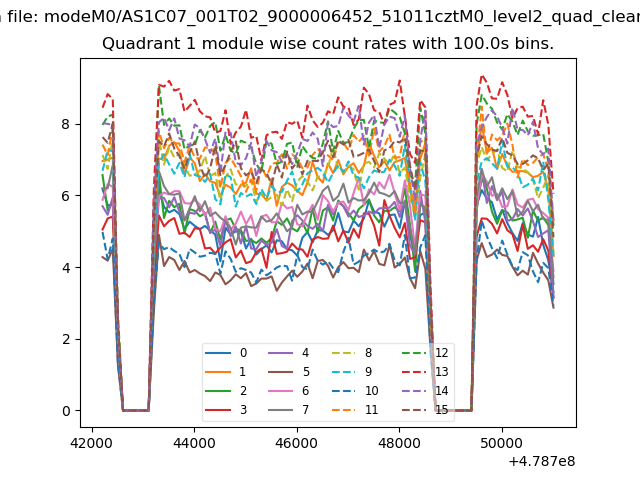
| Module-wise count rates for Quadrant A Data is divided into 100 sec bins |
 |
 |
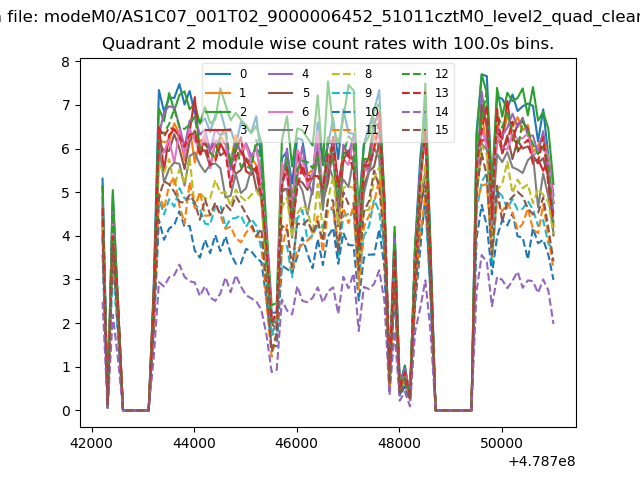
| Module-wise count rates for Quadrant B Data is divided into 100 sec bins |
 |
 |
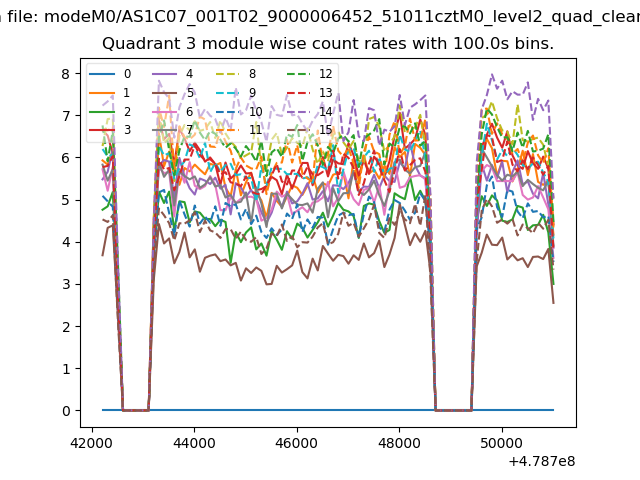
| Module-wise count rates for Quadrant C Data is divided into 100 sec bins |
 |
 |
| Module-wise count rates for Quadrant D Data is divided into 100 sec bins |
 |
 |
| Parameter | Plot |
|---|---|
| CZT HV Monitor | 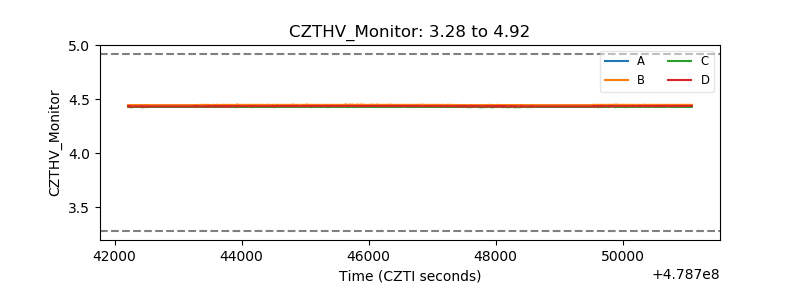 |
| D_VDD | 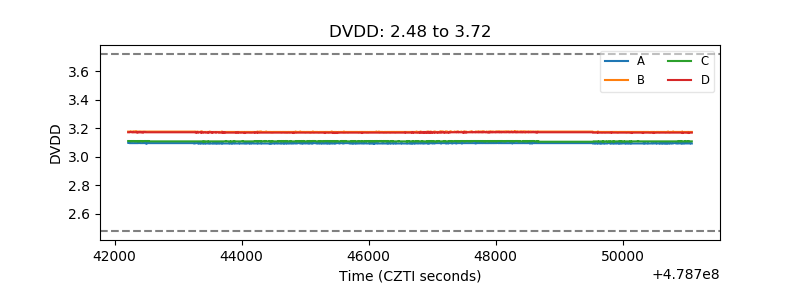 |
| Temperature 1 | 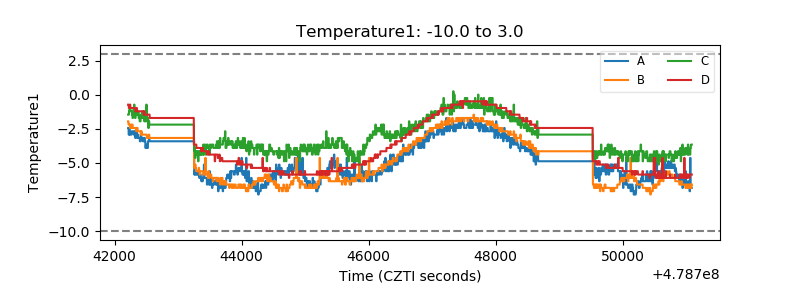 |
| Veto HV Monitor | 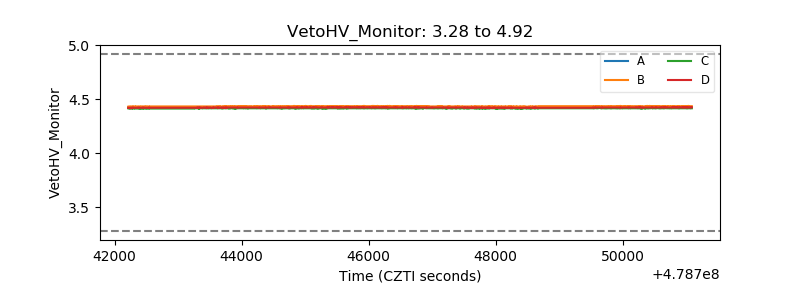 |
| Veto LLD | 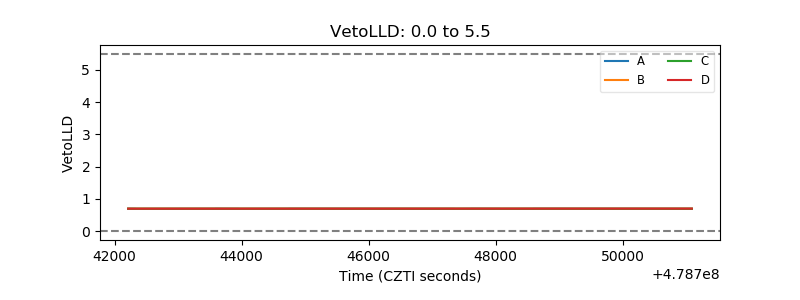 |
| Alpha Counter | 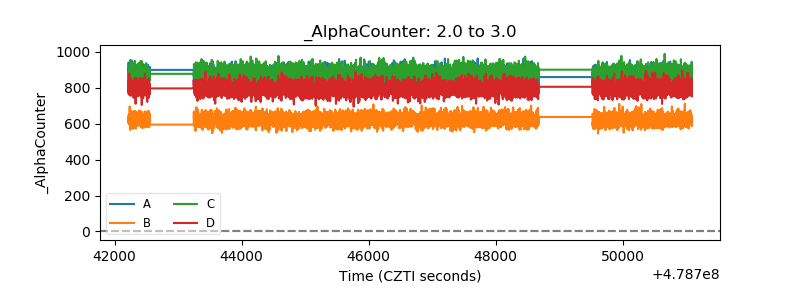 |
| _CPM_Rate | 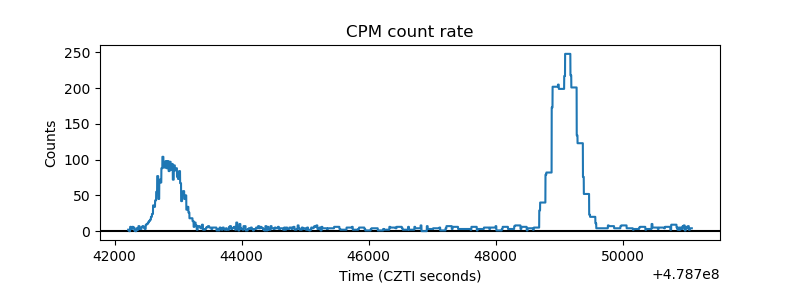 |
| CZT Counter | 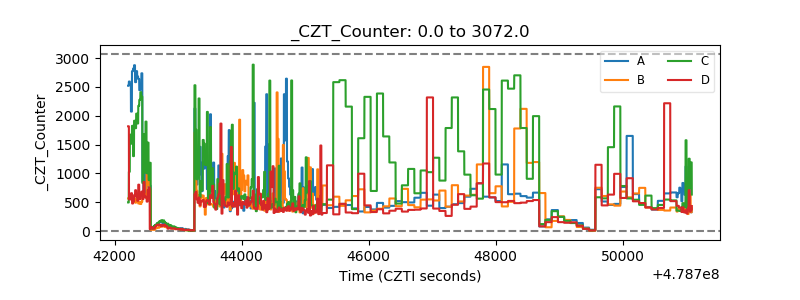 |
| +2.5 Volts monitor | 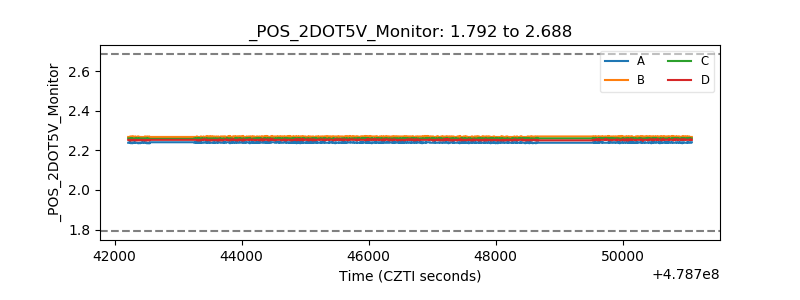 |
| +5 Volts monitor | 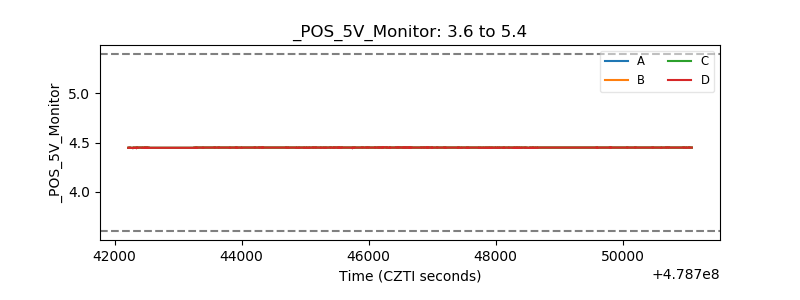 |
| _ROLL_ROT | 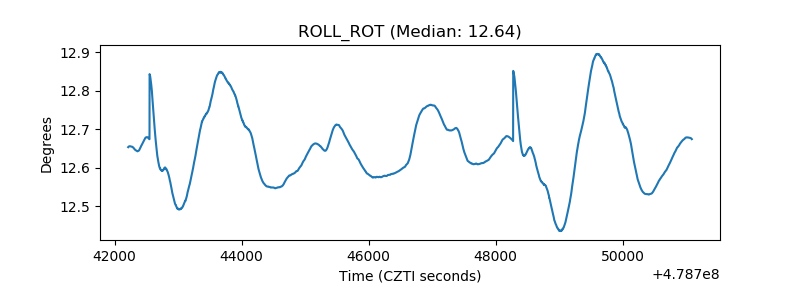 |
| _Roll_DEC | 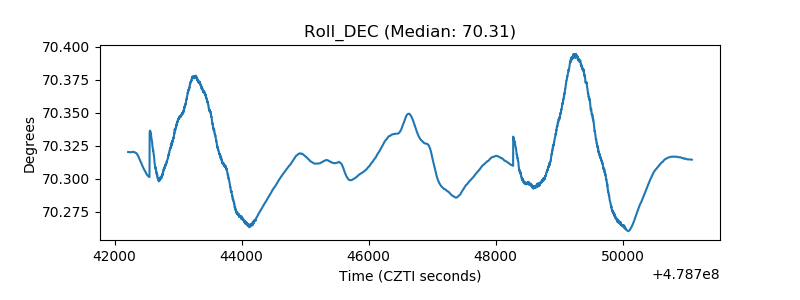 |
| _Roll_RA | 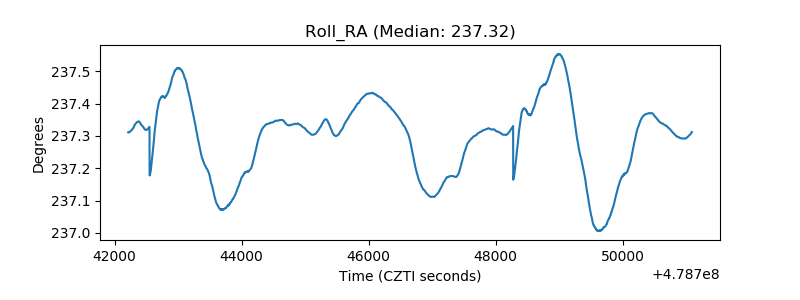 |
| Veto Counter | 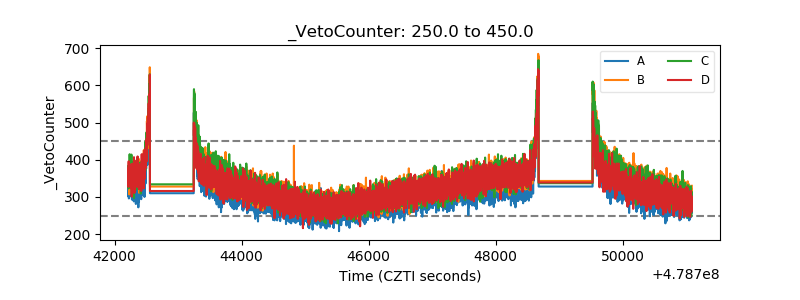 |