| Param | Original file | Final file |
|---|---|---|
| Filename | modeM0/AS1C07_001T02_9000006452_51013cztM0_level2.fits | modeM0/AS1C07_001T02_9000006452_51013cztM0_level2_quad_clean.evt |
| Size (bytes) | 505,468,800 | 101,505,600 |
| Size | 482.1 MB | 96.8 MB |
| Events in quadrant A | 4,862,336 | 646,373 |
| Events in quadrant B | 3,900,174 | 715,514 |
| Events in quadrant C | 5,192,216 | 612,727 |
| Events in quadrant D | 4,199,280 | 599,203 |
| Mode SS | |||
|---|---|---|---|
| Quadrant | BADHDUFLAG | Total packets | Discarded packets |
| A | 0 | 150 | 0 |
| B | 0 | 150 | 0 |
| C | 0 | 150 | 0 |
| D | 0 | 150 | 0 |
| Mode M9 | |||
|---|---|---|---|
| Quadrant | BADHDUFLAG | Total packets | Discarded packets |
| A | 0 | 18 | 0 |
| B | 0 | 18 | 0 |
| C | 0 | 18 | 0 |
| D | 0 | 18 | 0 |
| Mode M0 | |||
|---|---|---|---|
| Quadrant | BADHDUFLAG | Total packets | Discarded packets |
| A | 0 | 19356 | 2 |
| B | 0 | 16914 | 8 |
| C | 0 | 20531 | 2 |
| D | 0 | 17617 | 2 |
| Quadrant | Total seconds | Saturated seconds | Saturation percentage |
|---|---|---|---|
| A | 7167 | 294 | 4.102135% |
| B | 7167 | 176 | 2.455700% |
| C | 7167 | 478 | 6.669457% |
| D | 7167 | 152 | 2.120832% |
Noise dominated data is calculated using 1-second bins in cleaned event files. If a bin has >2000 counts, and if more than 50% of those come from <1% of pixels, then it is considered to be noise-dominated and hence unusable.
| Quadrant | # 1 sec bins | Bins with >0 counts | Bins with >2000 counts | High rate bins dominated by noise | Noise dominated (total time) | Noise dominated (detector-on time) | Marked lightcurve |
|---|---|---|---|---|---|---|---|
| A | 9052 | 7168 | 189 | 189 | 2.09% | 2.64% | 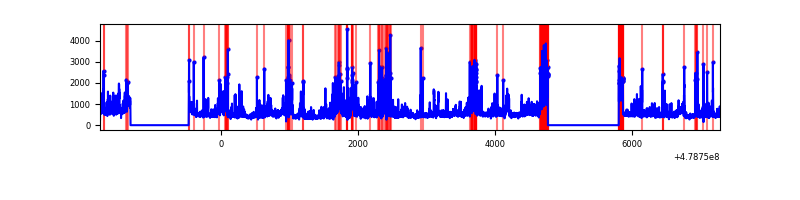 |
| B | 9052 | 7169 | 51 | 51 | 0.56% | 0.71% | 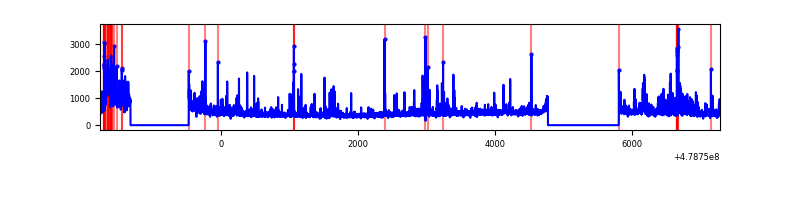 |
| C | 9052 | 7169 | 336 | 336 | 3.71% | 4.69% | 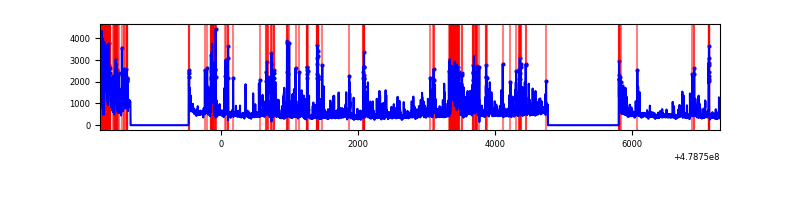 |
| D | 9052 | 7169 | 116 | 116 | 1.28% | 1.62% | 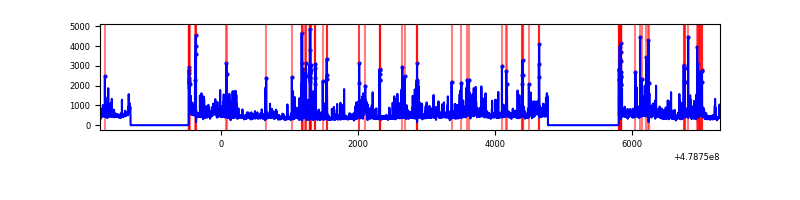 |
Top three noisy pixels from each quadrant. If the there are fewer than three noisy pixels in the level2.evt file, extra rows are filled as -1
| Pixel properties | Quadrant properties | ||||||
|---|---|---|---|---|---|---|---|
| Quadrant | DetID | PixID | Counts | Sigma | Mean | Median | Sigma |
| A | 14 | 254 | 644811 | 3518.58 | 736 | 718 | 183.1 |
| A | 5 | 240 | 191384 | 1041.58 | 736 | 718 | 183.1 |
| A | 12 | 80 | 182601 | 993.6 | 736 | 718 | 183.1 |
| B | 4 | 81 | 289451 | 1817.99 | 742 | 717 | 158.8 |
| B | 4 | 171 | 249814 | 1568.42 | 742 | 717 | 158.8 |
| B | 12 | 32 | 86133 | 537.81 | 742 | 717 | 158.8 |
| C | 15 | 158 | 443604 | 2230.01 | 712 | 707 | 198.6 |
| C | 4 | 12 | 435636 | 2189.89 | 712 | 707 | 198.6 |
| C | 13 | 3 | 419667 | 2109.48 | 712 | 707 | 198.6 |
| D | 8 | 176 | 224021 | 1127.47 | 714 | 690 | 198.1 |
| D | 2 | 216 | 194400 | 977.93 | 714 | 690 | 198.1 |
| D | 2 | 249 | 159385 | 801.16 | 714 | 690 | 198.1 |
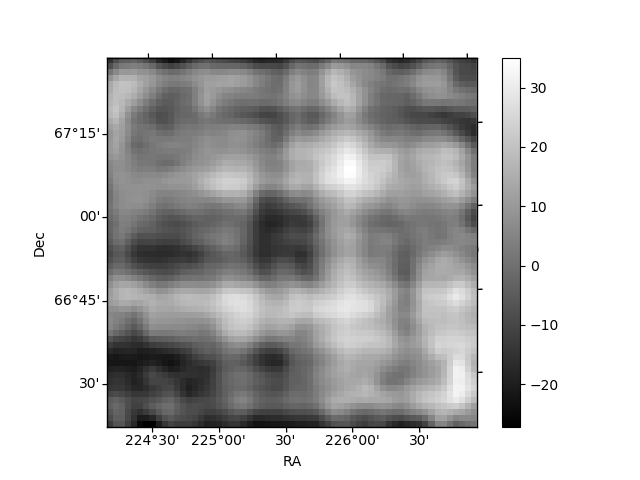
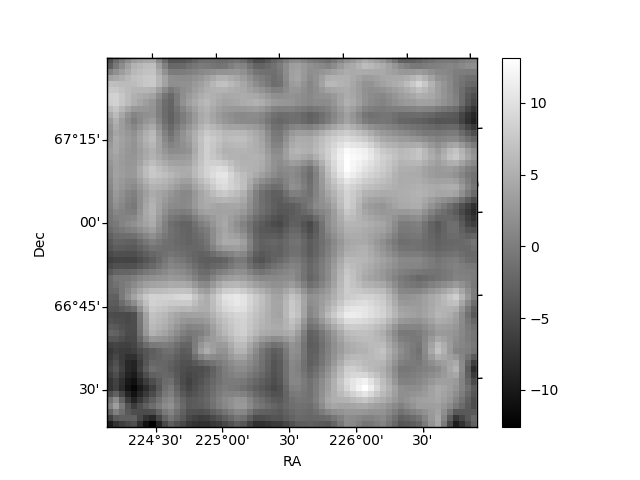
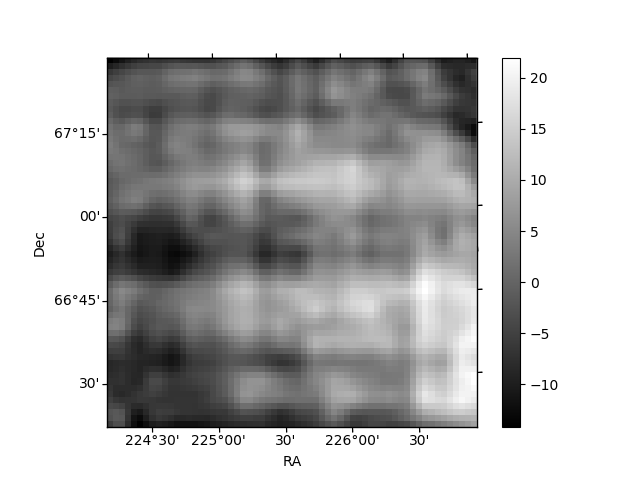
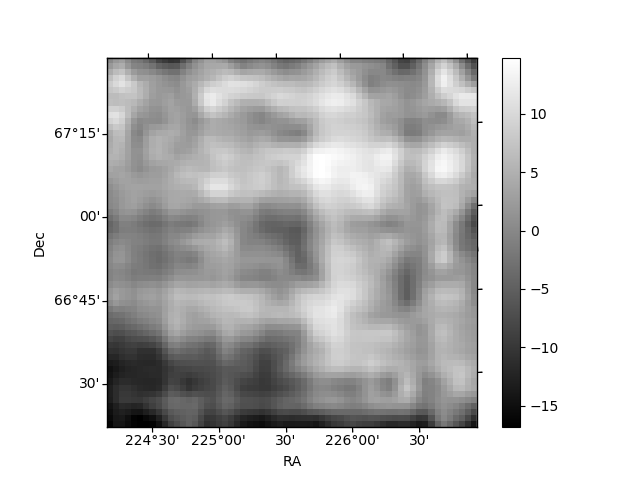
Histogram calculated using DETX and DETY for each event in the final _common_clean file
| Quadrant A | 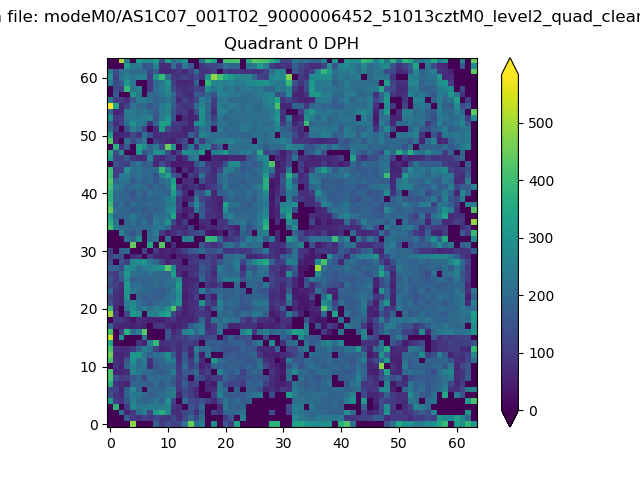 |
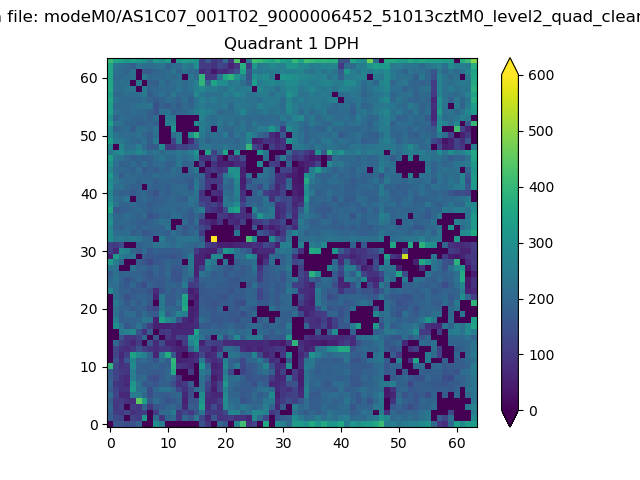 |
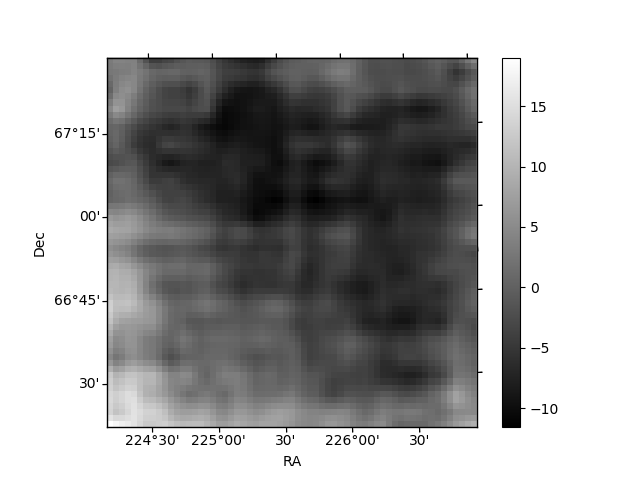
Quadrant B |
|---|---|---|---|
| Quadrant D | 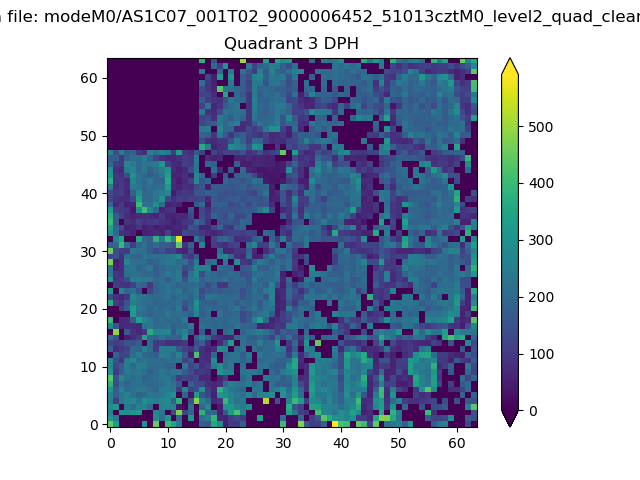 |
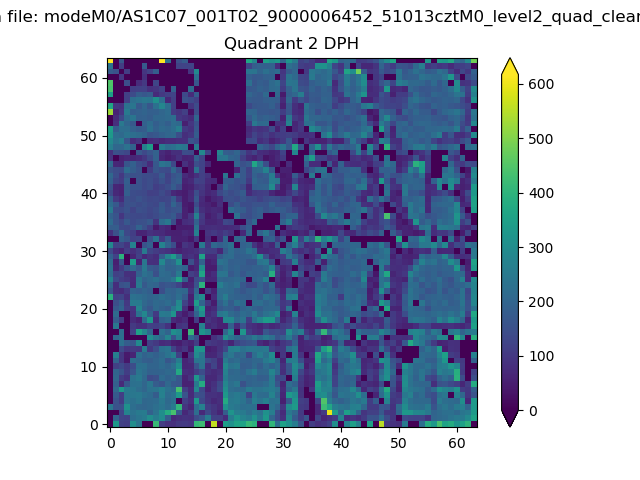 |
Quadrant C |
| Plot type | Count rate plots | Images |
|---|---|---|
| Comparison with Poisson distribution Blue bars denote a histogram of data divided into 1 sec bins. Red curve is a Poisson curve with rate = median count rate of data. |
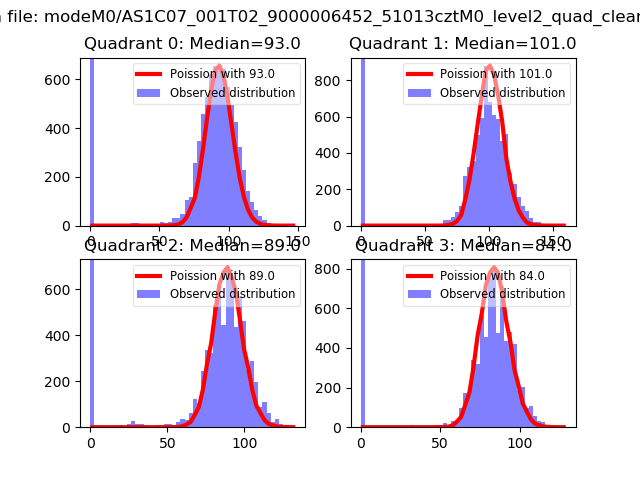 |
 |
| Quadrant-wise count rates Data is divided into 100 sec bins |
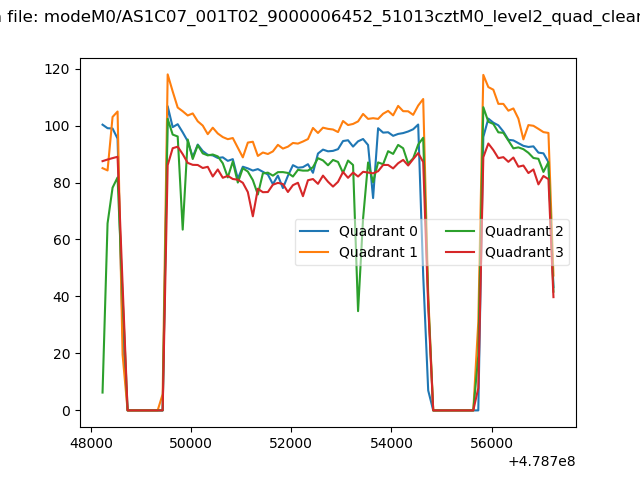 |
|
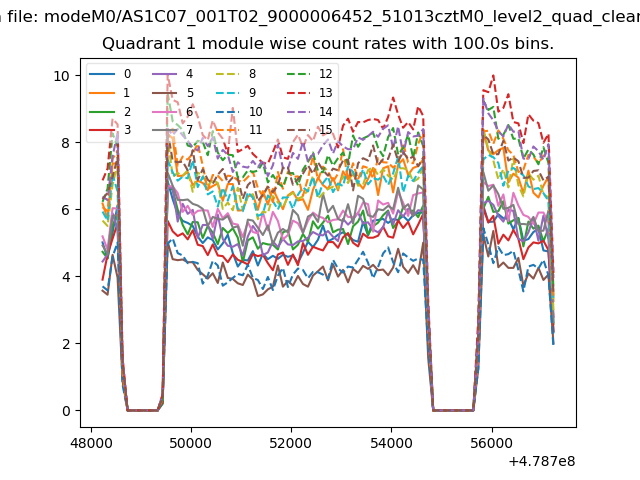
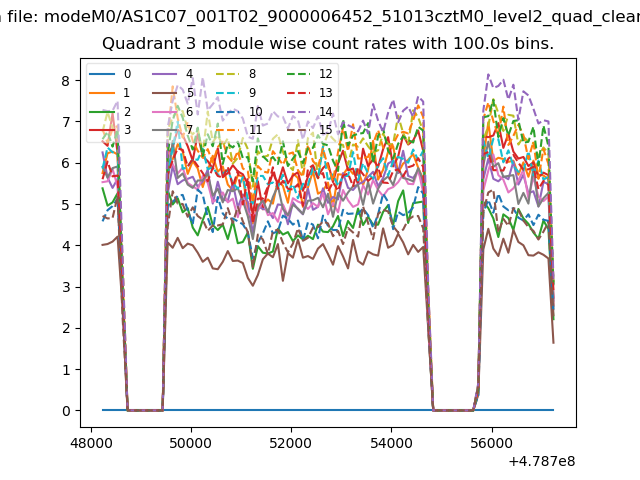
| Module-wise count rates for Quadrant A Data is divided into 100 sec bins |
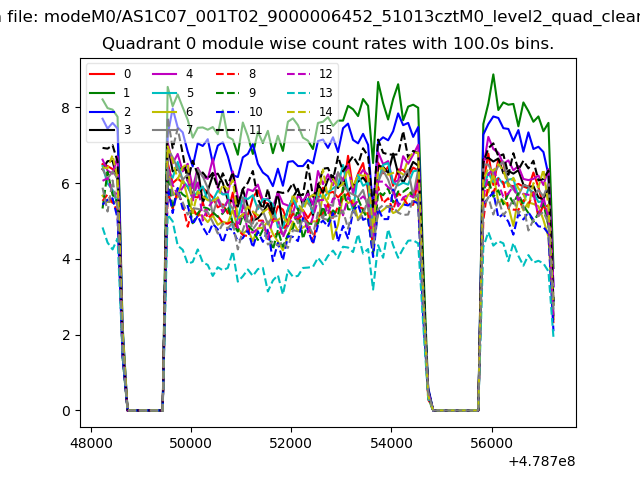 |
 |
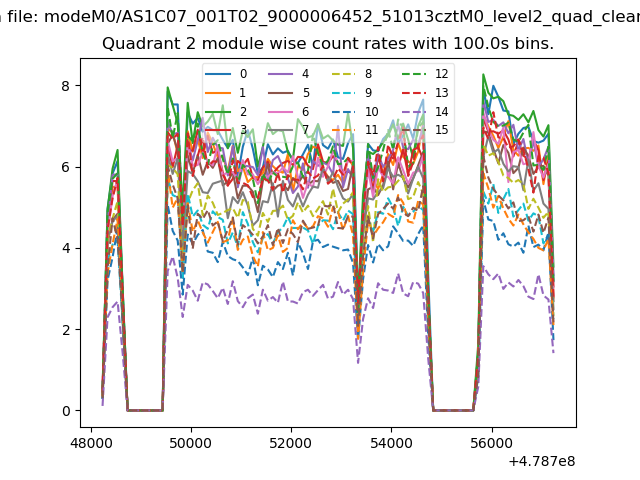
| Module-wise count rates for Quadrant B Data is divided into 100 sec bins |
 |
 |
| Module-wise count rates for Quadrant C Data is divided into 100 sec bins |
 |
 |
| Module-wise count rates for Quadrant D Data is divided into 100 sec bins |
 |
 |
| Parameter | Plot |
|---|---|
| CZT HV Monitor | 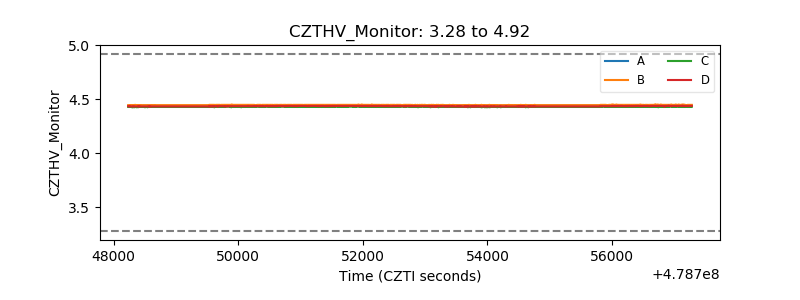 |
| D_VDD | 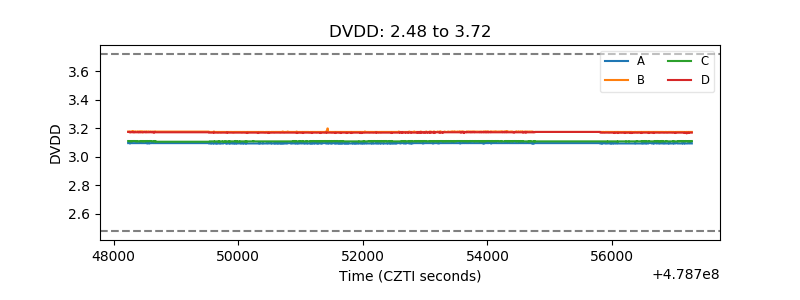 |
| Temperature 1 | 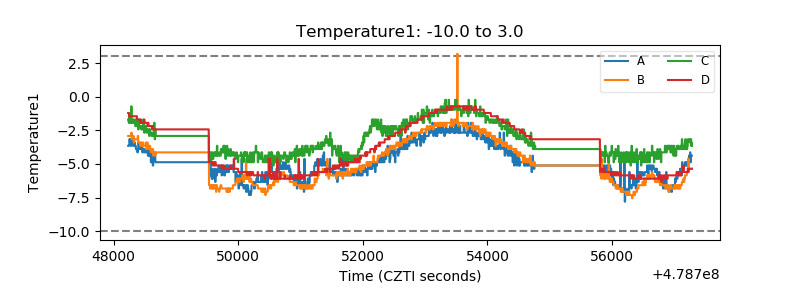 |
| Veto HV Monitor | 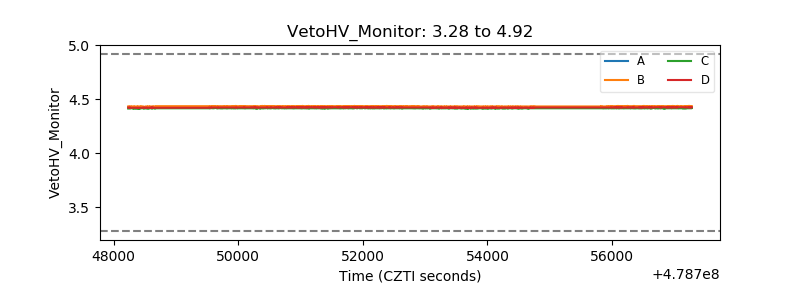 |
| Veto LLD | 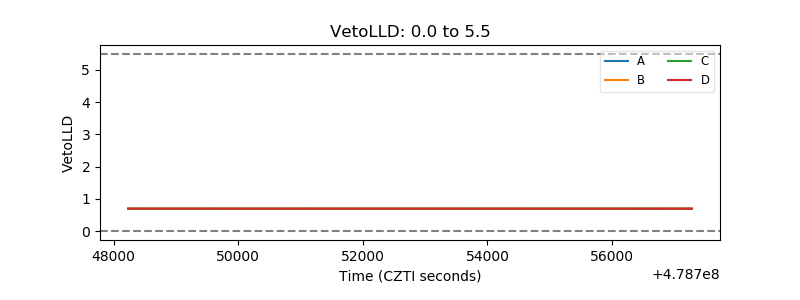 |
| Alpha Counter | 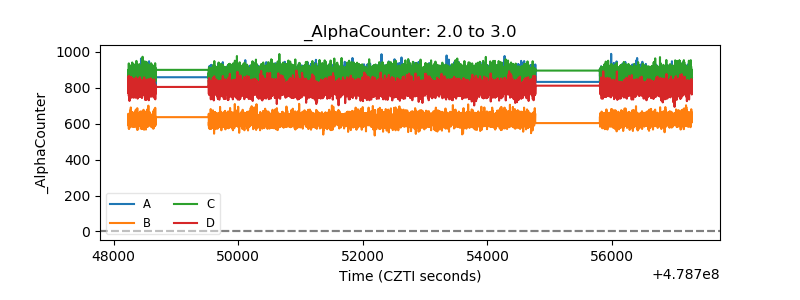 |
| _CPM_Rate | 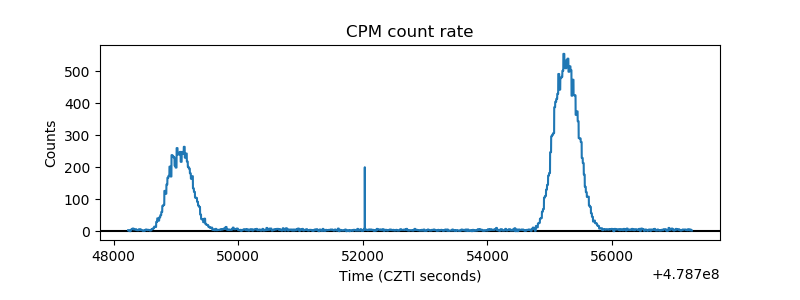 |
| CZT Counter | 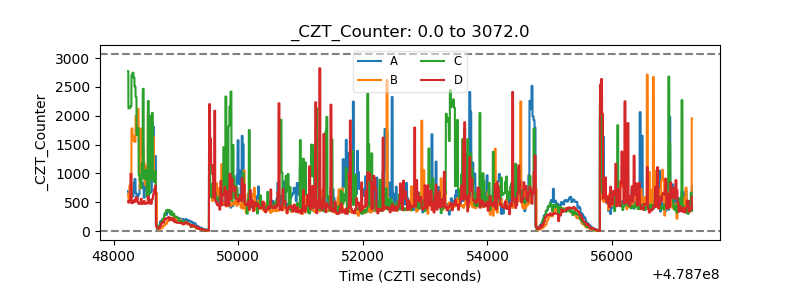 |
| +2.5 Volts monitor | 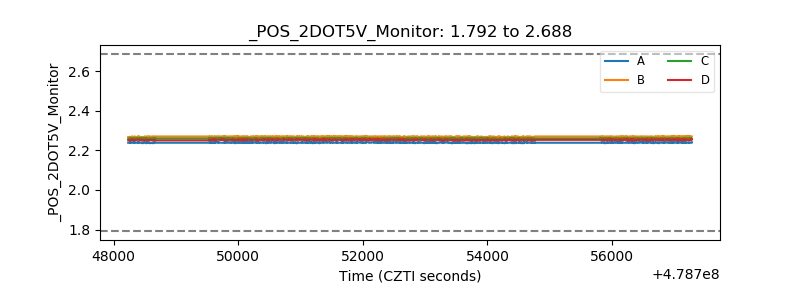 |
| +5 Volts monitor | 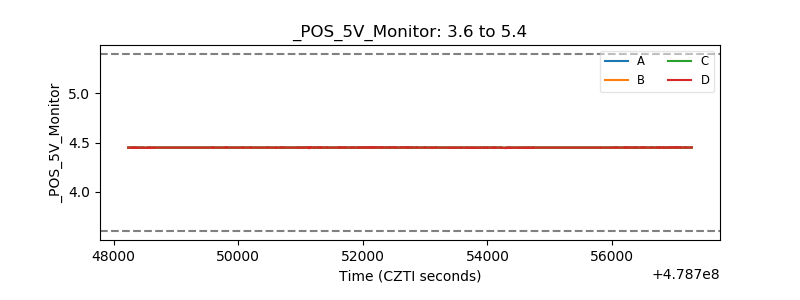 |
| _ROLL_ROT | 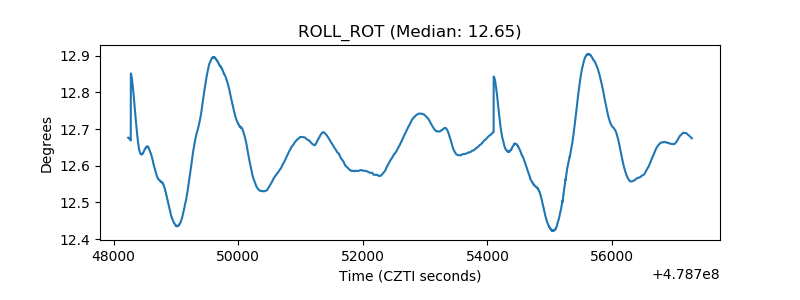 |
| _Roll_DEC | 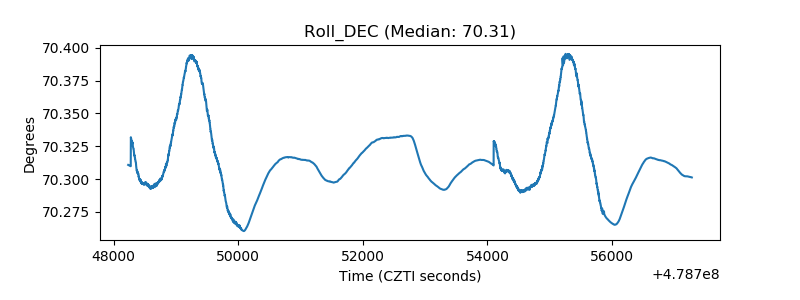 |
| _Roll_RA | 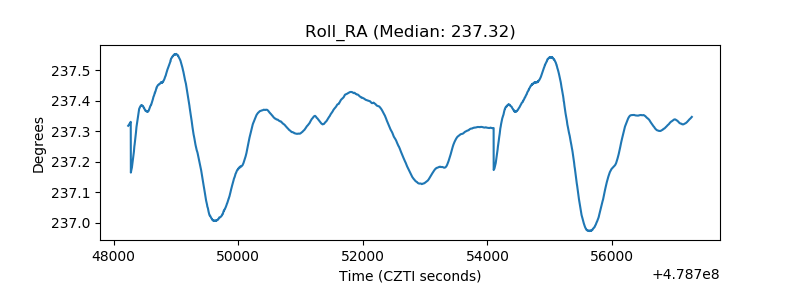 |
| Veto Counter | 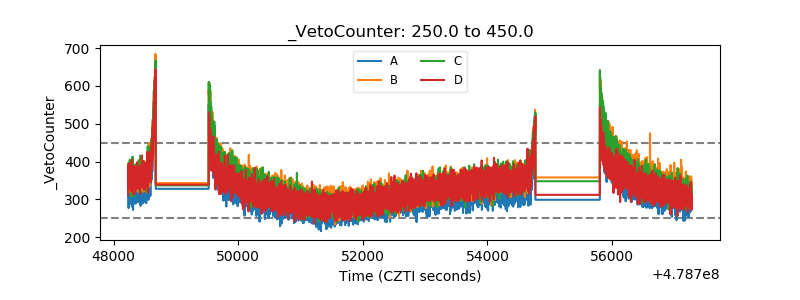 |