| Param | Original file | Final file |
|---|---|---|
| Filename | modeM0/AS1C07_001T02_9000006452_51015cztM0_level2.fits | modeM0/AS1C07_001T02_9000006452_51015cztM0_level2_quad_clean.evt |
| Size (bytes) | 877,890,240 | 157,582,080 |
| Size | 837.2 MB | 150.3 MB |
| Events in quadrant A | 9,663,478 | 1,003,698 |
| Events in quadrant B | 6,581,450 | 1,144,512 |
| Events in quadrant C | 8,464,575 | 920,211 |
| Events in quadrant D | 6,924,507 | 931,343 |
| Mode SS | |||
|---|---|---|---|
| Quadrant | BADHDUFLAG | Total packets | Discarded packets |
| A | 0 | 228 | 0 |
| B | 0 | 228 | 0 |
| C | 0 | 228 | 0 |
| D | 0 | 228 | 0 |
| Mode M9 | |||
|---|---|---|---|
| Quadrant | BADHDUFLAG | Total packets | Discarded packets |
| A | 0 | 22 | 0 |
| B | 0 | 22 | 0 |
| C | 0 | 22 | 0 |
| D | 0 | 22 | 0 |
| Mode M0 | |||
|---|---|---|---|
| Quadrant | BADHDUFLAG | Total packets | Discarded packets |
| A | 0 | 36475 | 2 |
| B | 0 | 27523 | 2 |
| C | 0 | 33028 | 4 |
| D | 0 | 28602 | 2 |
| Quadrant | Total seconds | Saturated seconds | Saturation percentage |
|---|---|---|---|
| A | 11144 | 869 | 7.797918% |
| B | 11145 | 300 | 2.691790% |
| C | 11144 | 1147 | 10.292534% |
| D | 11144 | 382 | 3.427854% |
Noise dominated data is calculated using 1-second bins in cleaned event files. If a bin has >2000 counts, and if more than 50% of those come from <1% of pixels, then it is considered to be noise-dominated and hence unusable.
| Quadrant | # 1 sec bins | Bins with >0 counts | Bins with >2000 counts | High rate bins dominated by noise | Noise dominated (total time) | Noise dominated (detector-on time) | Marked lightcurve |
|---|---|---|---|---|---|---|---|
| A | 13365 | 11146 | 712 | 712 | 5.33% | 6.39% | 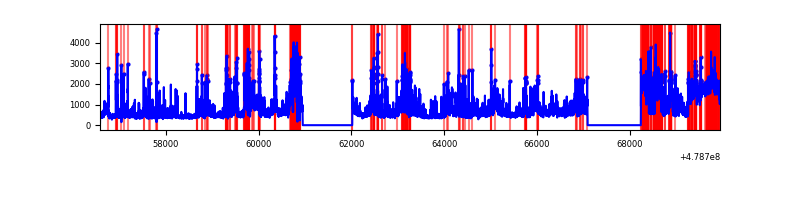 |
| B | 13366 | 11147 | 121 | 121 | 0.91% | 1.09% | 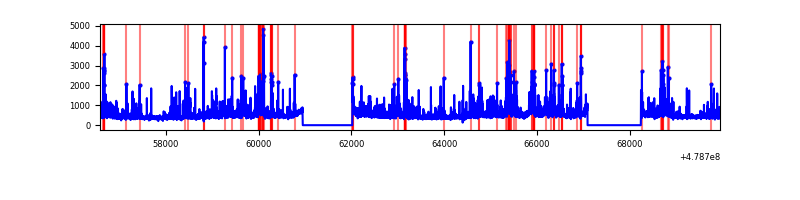 |
| C | 13366 | 11147 | 794 | 794 | 5.94% | 7.12% | 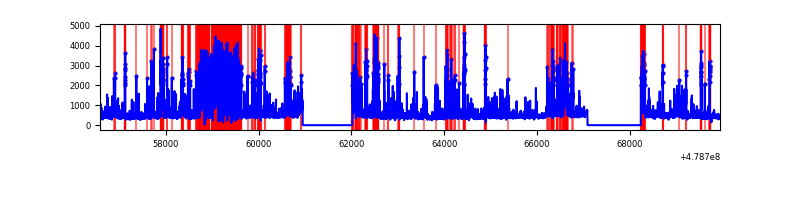 |
| D | 13365 | 11146 | 249 | 249 | 1.86% | 2.23% | 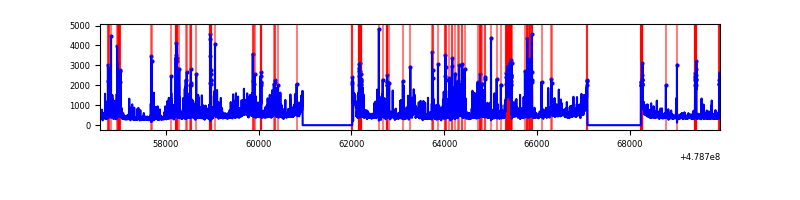 |
Top three noisy pixels from each quadrant. If the there are fewer than three noisy pixels in the level2.evt file, extra rows are filled as -1
| Pixel properties | Quadrant properties | ||||||
|---|---|---|---|---|---|---|---|
| Quadrant | DetID | PixID | Counts | Sigma | Mean | Median | Sigma |
| A | 12 | 80 | 2020850 | 7085.9 | 1148 | 1122 | 285.0 |
| A | 14 | 254 | 1269072 | 4448.41 | 1148 | 1122 | 285.0 |
| A | 12 | 3 | 582328 | 2039.07 | 1148 | 1122 | 285.0 |
| B | 4 | 81 | 549672 | 2257.29 | 1152 | 1114 | 243.0 |
| B | 4 | 171 | 471080 | 1933.88 | 1152 | 1114 | 243.0 |
| B | 0 | 172 | 165794 | 677.65 | 1152 | 1114 | 243.0 |
| C | 0 | 177 | 1751392 | 5867.59 | 1070 | 1061 | 298.3 |
| C | 15 | 229 | 440756 | 1473.98 | 1070 | 1061 | 298.3 |
| C | 4 | 5 | 350561 | 1171.62 | 1070 | 1061 | 298.3 |
| D | 8 | 176 | 957821 | 3113.46 | 1106 | 1064 | 307.3 |
| D | 2 | 216 | 344504 | 1117.61 | 1106 | 1064 | 307.3 |
| D | 15 | 108 | 254421 | 824.47 | 1106 | 1064 | 307.3 |
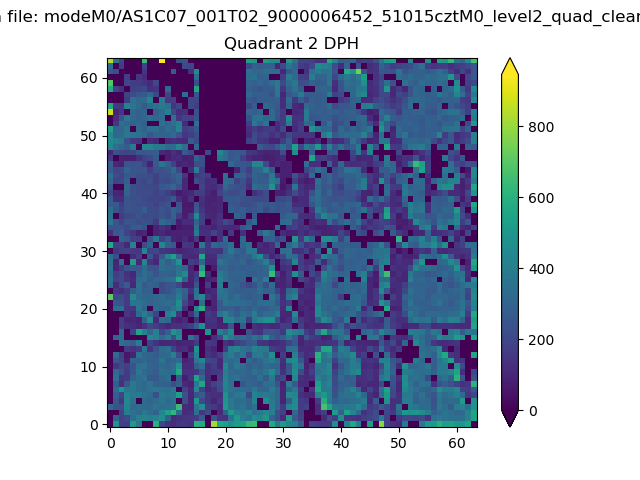
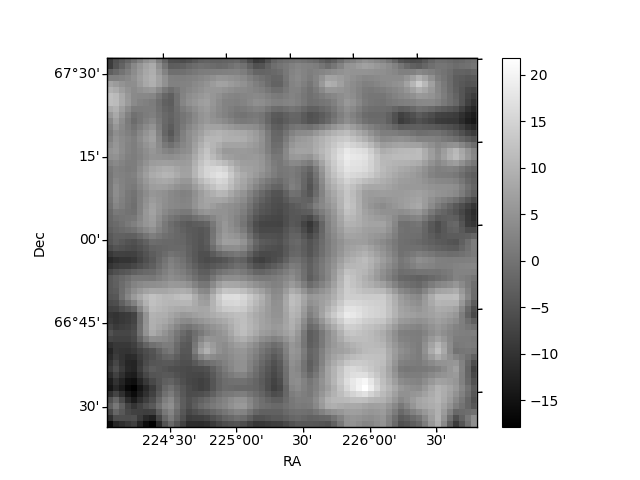
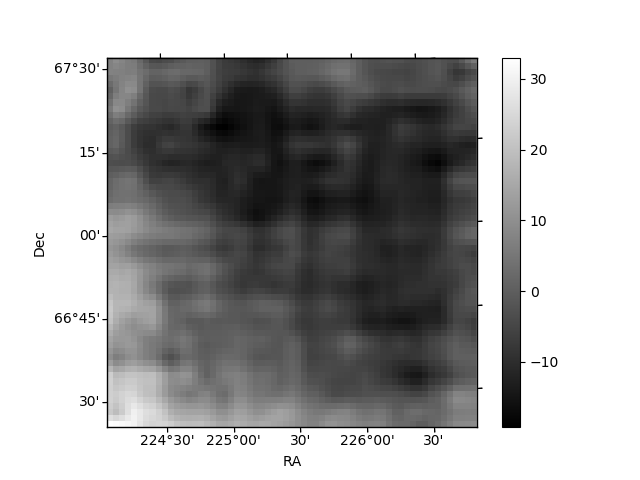
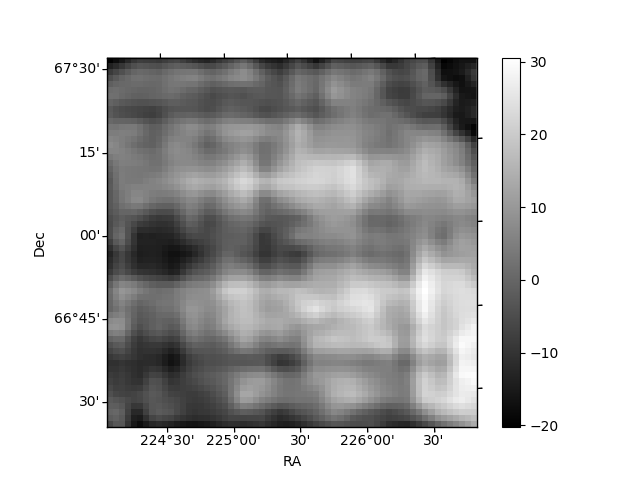
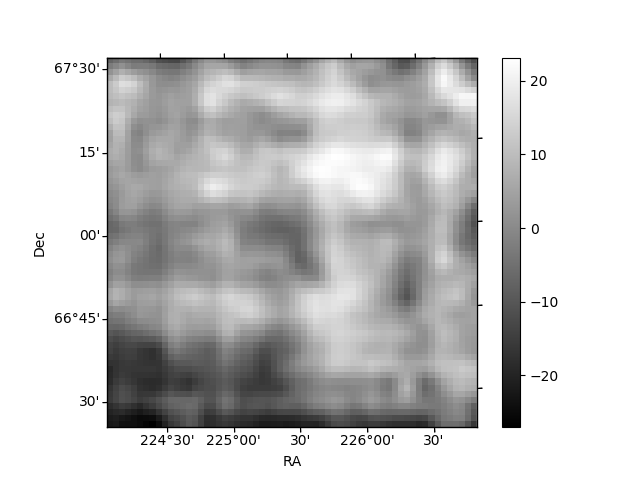
Histogram calculated using DETX and DETY for each event in the final _common_clean file
| Quadrant A | 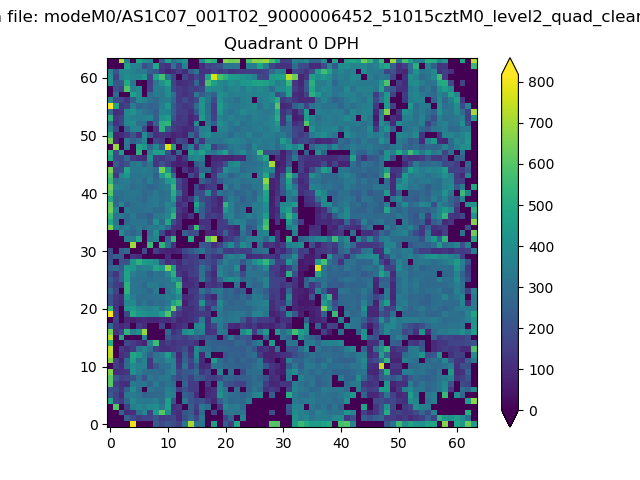 |
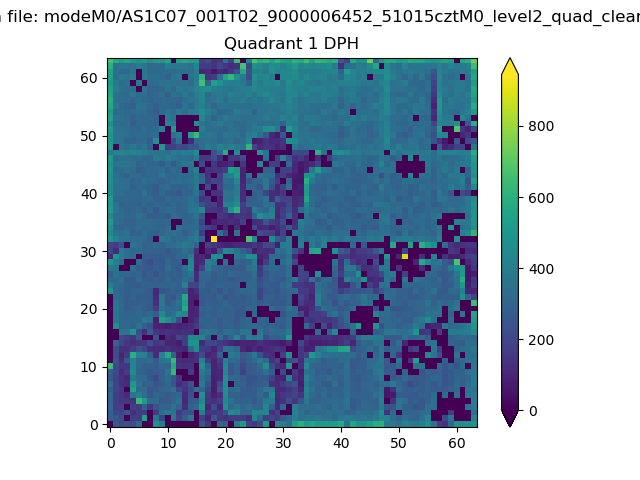 |
Quadrant B |
|---|---|---|---|
| Quadrant D | 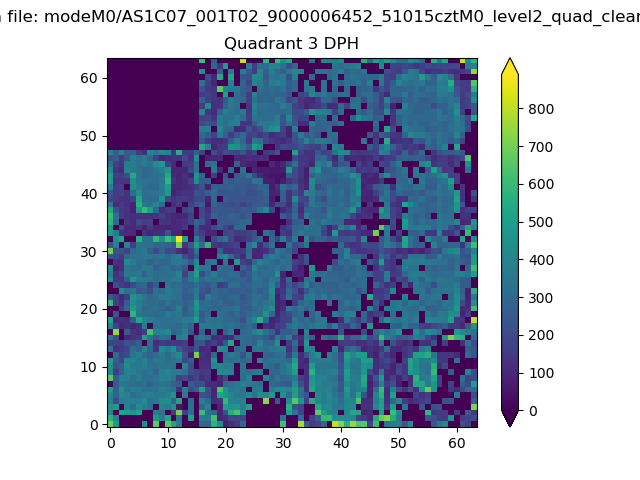 |
 |
Quadrant C |
| Plot type | Count rate plots | Images |
|---|---|---|
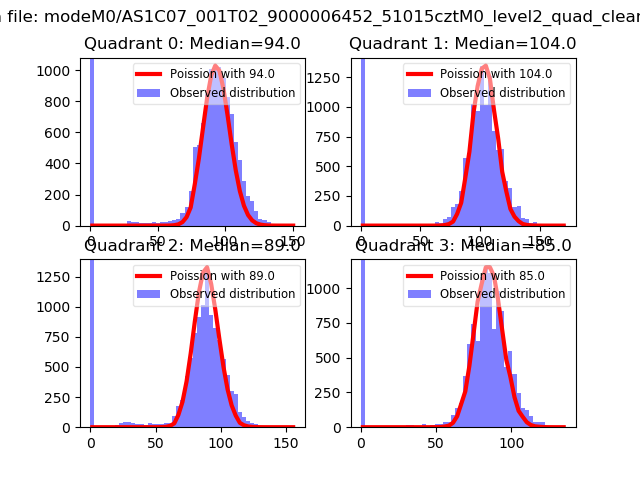
| Comparison with Poisson distribution Blue bars denote a histogram of data divided into 1 sec bins. Red curve is a Poisson curve with rate = median count rate of data. |
 |
 |
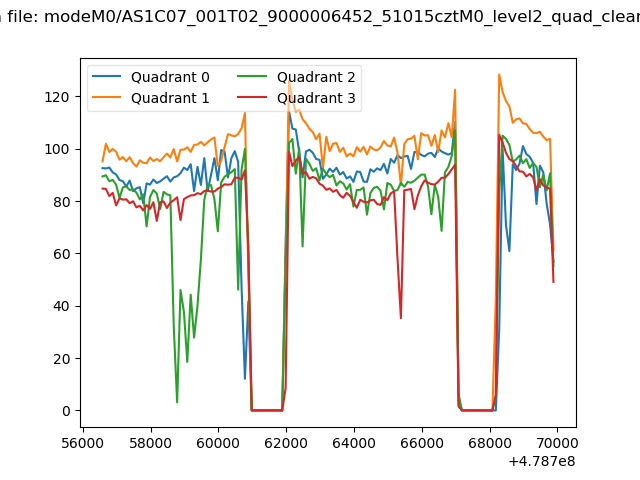
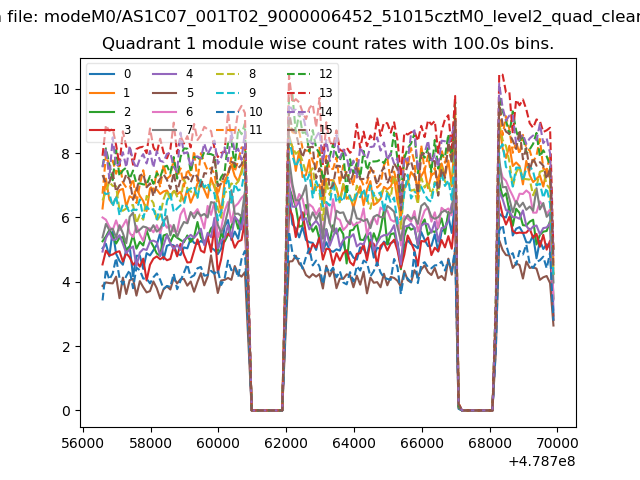
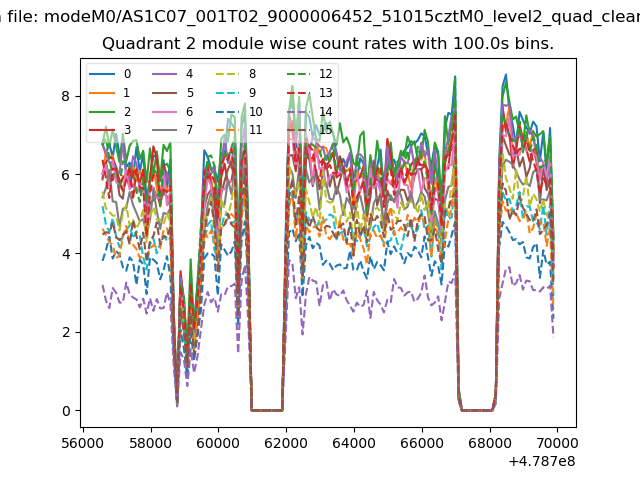
| Quadrant-wise count rates Data is divided into 100 sec bins |
 |
|
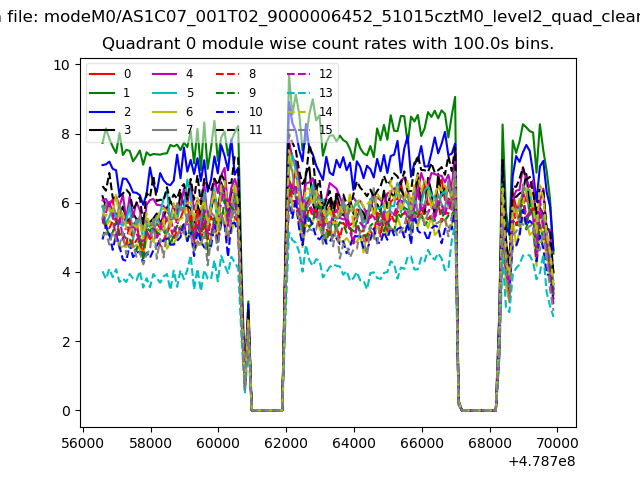
| Module-wise count rates for Quadrant A Data is divided into 100 sec bins |
 |
 |
| Module-wise count rates for Quadrant B Data is divided into 100 sec bins |
 |
 |
| Module-wise count rates for Quadrant C Data is divided into 100 sec bins |
 |
 |
| Module-wise count rates for Quadrant D Data is divided into 100 sec bins |
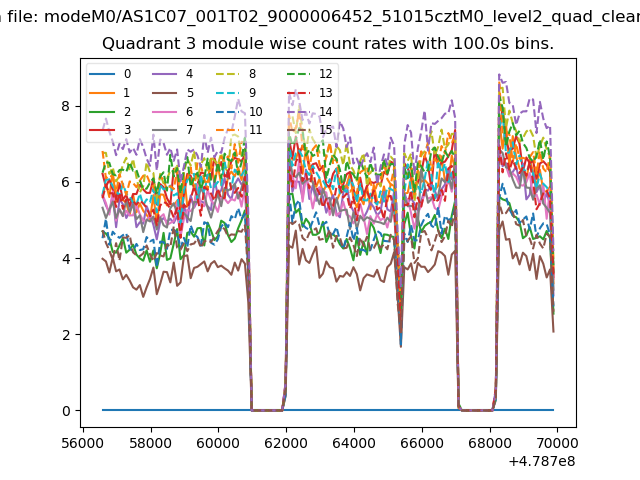 |
 |
| Parameter | Plot |
|---|---|
| CZT HV Monitor | 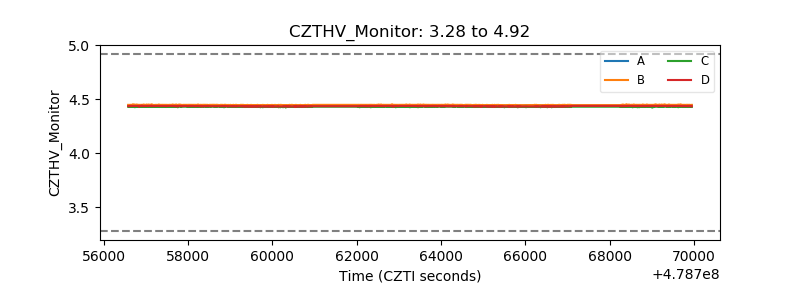 |
| D_VDD | 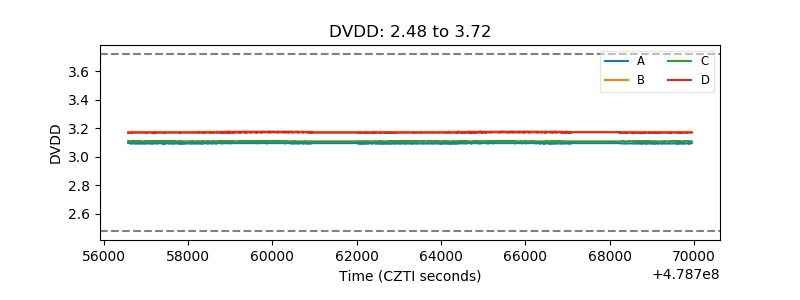 |
| Temperature 1 | 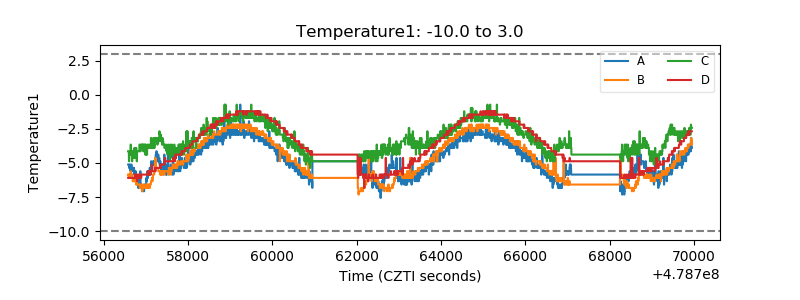 |
| Veto HV Monitor | 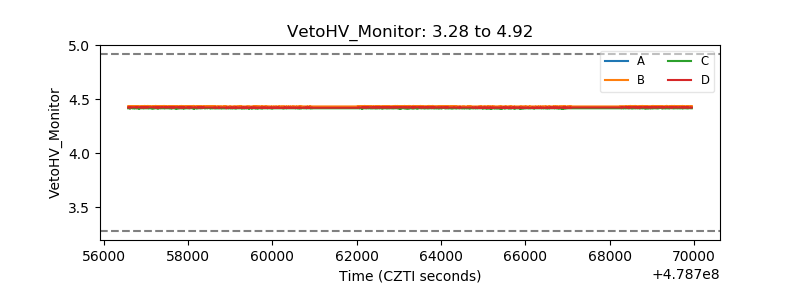 |
| Veto LLD | 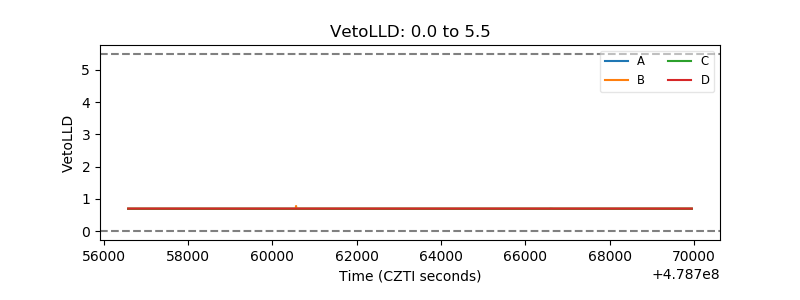 |
| Alpha Counter | 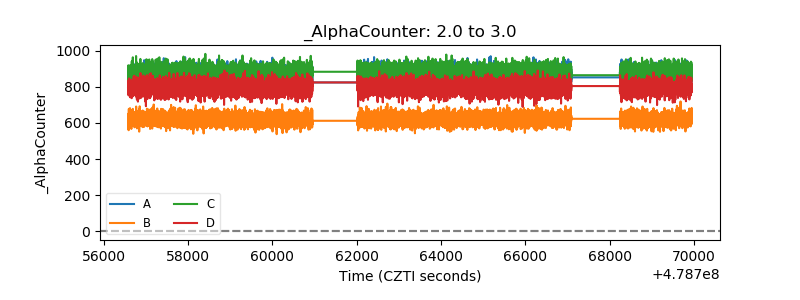 |
| _CPM_Rate | 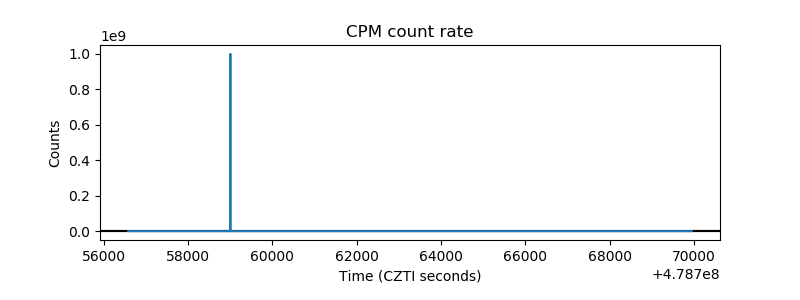 |
| CZT Counter | 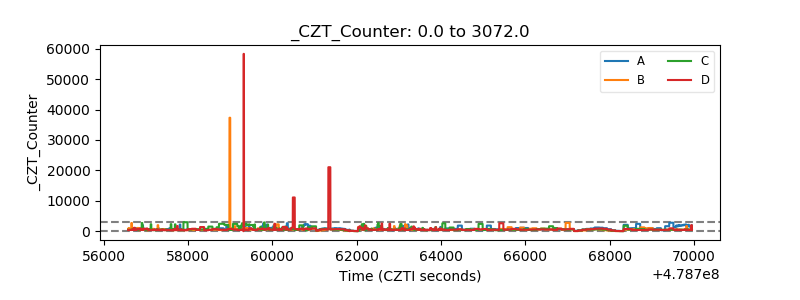 |
| +2.5 Volts monitor | 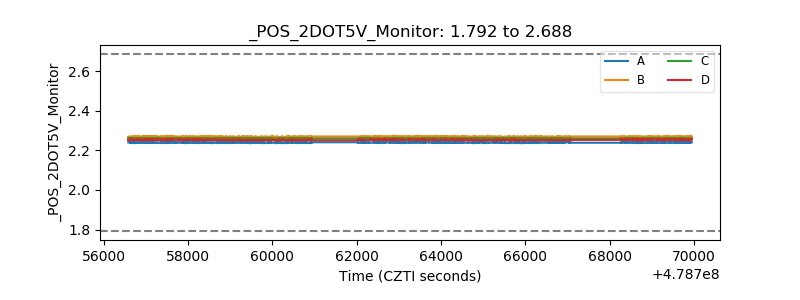 |
| +5 Volts monitor | 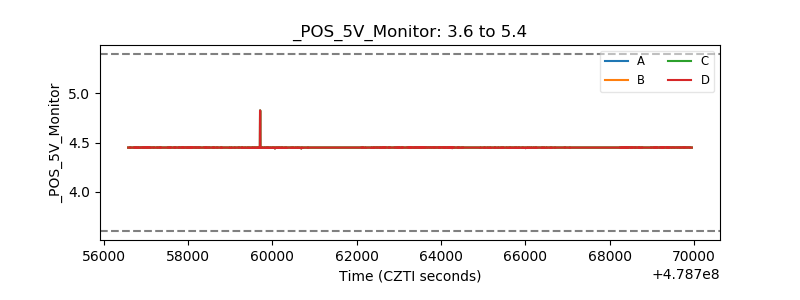 |
| _ROLL_ROT | 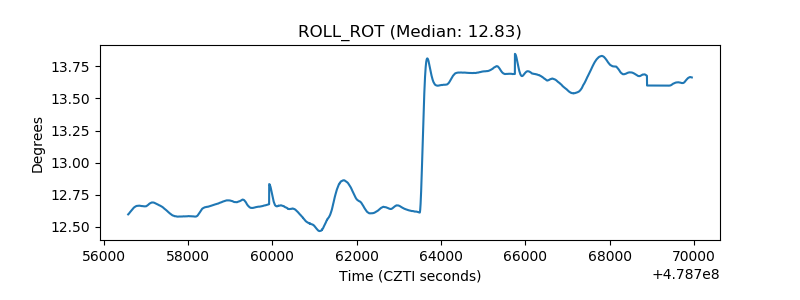 |
| _Roll_DEC | 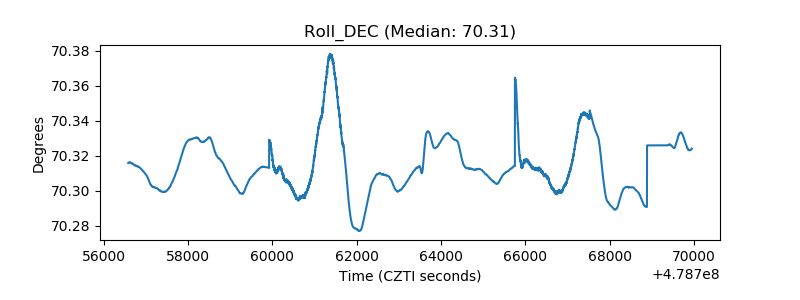 |
| _Roll_RA | 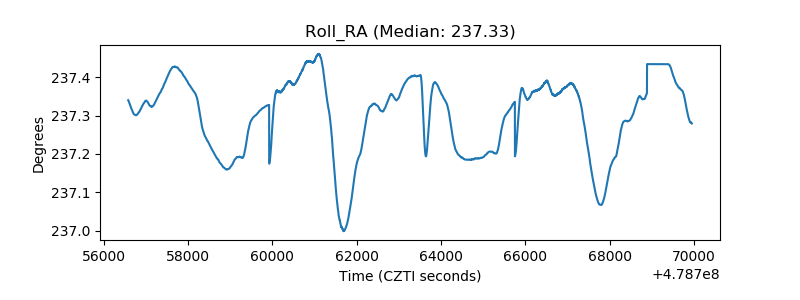 |
| Veto Counter | 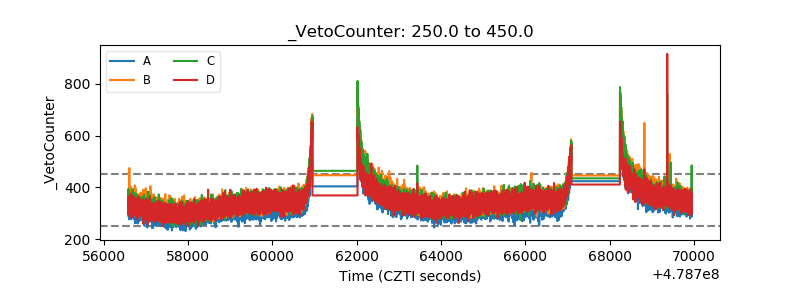 |