| Param | Original file | Final file |
|---|---|---|
| Filename | modeM0/AS1C07_001T02_9000006452_51016cztM0_level2.fits | modeM0/AS1C07_001T02_9000006452_51016cztM0_level2_quad_clean.evt |
| Size (bytes) | 565,588,800 | 89,265,600 |
| Size | 539.4 MB | 85.1 MB |
| Events in quadrant A | 8,105,989 | 531,579 |
| Events in quadrant B | 3,685,913 | 657,732 |
| Events in quadrant C | 4,687,021 | 537,080 |
| Events in quadrant D | 3,973,788 | 540,864 |
| Mode SS | |||
|---|---|---|---|
| Quadrant | BADHDUFLAG | Total packets | Discarded packets |
| A | 0 | 128 | 0 |
| B | 0 | 128 | 0 |
| C | 0 | 128 | 0 |
| D | 0 | 128 | 0 |
| Mode M9 | |||
|---|---|---|---|
| Quadrant | BADHDUFLAG | Total packets | Discarded packets |
| A | 0 | 11 | 0 |
| B | 0 | 11 | 0 |
| C | 0 | 11 | 0 |
| D | 0 | 11 | 0 |
| Mode M0 | |||
|---|---|---|---|
| Quadrant | BADHDUFLAG | Total packets | Discarded packets |
| A | 0 | 28404 | 1 |
| B | 0 | 15303 | 1 |
| C | 0 | 18233 | 1 |
| D | 0 | 16330 | 1 |
| Quadrant | Total seconds | Saturated seconds | Saturation percentage |
|---|---|---|---|
| A | 6235 | 1212 | 19.438653% |
| B | 6235 | 188 | 3.015237% |
| C | 6235 | 652 | 10.457097% |
| D | 6236 | 238 | 3.816549% |
Noise dominated data is calculated using 1-second bins in cleaned event files. If a bin has >2000 counts, and if more than 50% of those come from <1% of pixels, then it is considered to be noise-dominated and hence unusable.
| Quadrant | # 1 sec bins | Bins with >0 counts | Bins with >2000 counts | High rate bins dominated by noise | Noise dominated (total time) | Noise dominated (detector-on time) | Marked lightcurve |
|---|---|---|---|---|---|---|---|
| A | 7360 | 6236 | 1165 | 1165 | 15.83% | 18.68% | 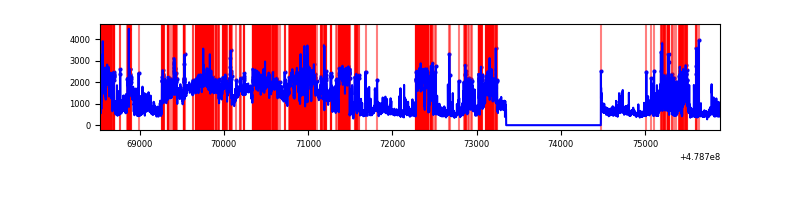 |
| B | 7360 | 6236 | 53 | 53 | 0.72% | 0.85% | 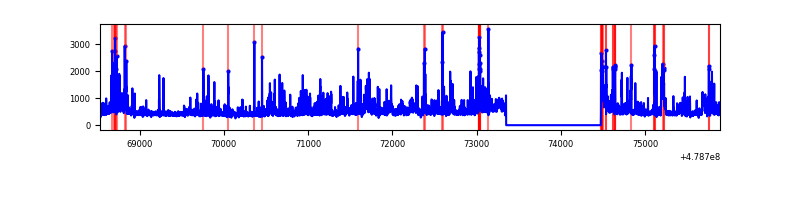 |
| C | 7359 | 6235 | 529 | 529 | 7.19% | 8.48% | 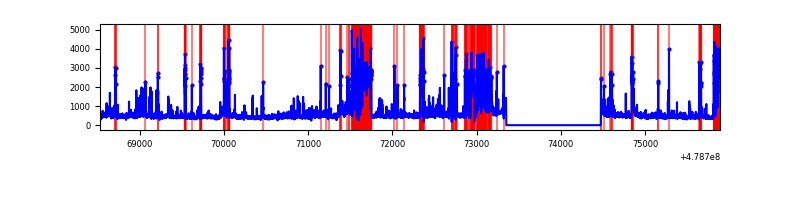 |
| D | 7361 | 6237 | 169 | 169 | 2.30% | 2.71% | 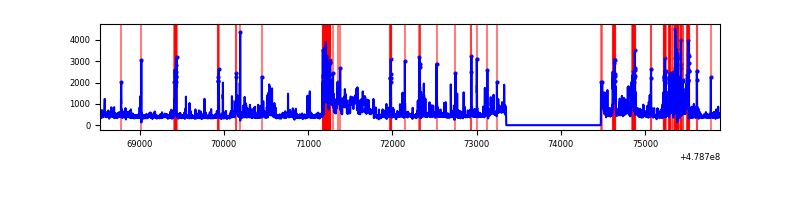 |
Top three noisy pixels from each quadrant. If the there are fewer than three noisy pixels in the level2.evt file, extra rows are filled as -1
| Pixel properties | Quadrant properties | ||||||
|---|---|---|---|---|---|---|---|
| Quadrant | DetID | PixID | Counts | Sigma | Mean | Median | Sigma |
| A | 12 | 80 | 4035587 | 25390.92 | 644 | 629 | 158.9 |
| A | 12 | 3 | 731071 | 4596.48 | 644 | 629 | 158.9 |
| A | 5 | 240 | 124432 | 779.06 | 644 | 629 | 158.9 |
| B | 4 | 171 | 234982 | 1679.44 | 656 | 633 | 139.5 |
| B | 4 | 206 | 158380 | 1130.48 | 656 | 633 | 139.5 |
| B | 4 | 81 | 147311 | 1051.15 | 656 | 633 | 139.5 |
| C | 15 | 1 | 768200 | 4536.24 | 606 | 600 | 169.2 |
| C | 15 | 147 | 336915 | 1987.5 | 606 | 600 | 169.2 |
| C | 13 | 3 | 243191 | 1433.63 | 606 | 600 | 169.2 |
| D | 2 | 216 | 498141 | 2741.68 | 638 | 614 | 181.5 |
| D | 7 | 39 | 278390 | 1530.72 | 638 | 614 | 181.5 |
| D | 8 | 176 | 175290 | 962.57 | 638 | 614 | 181.5 |
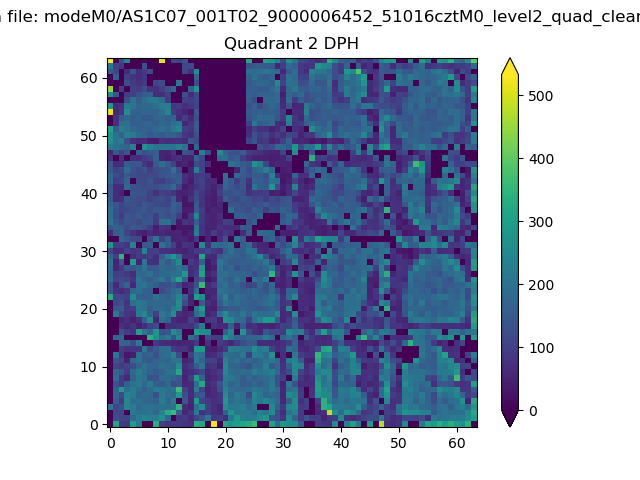
Histogram calculated using DETX and DETY for each event in the final _common_clean file
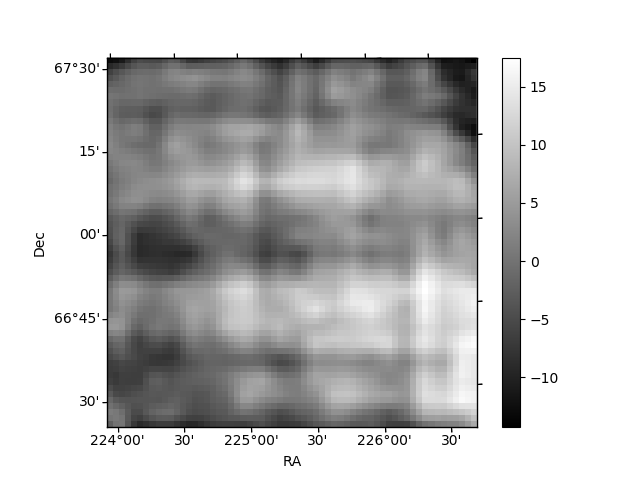
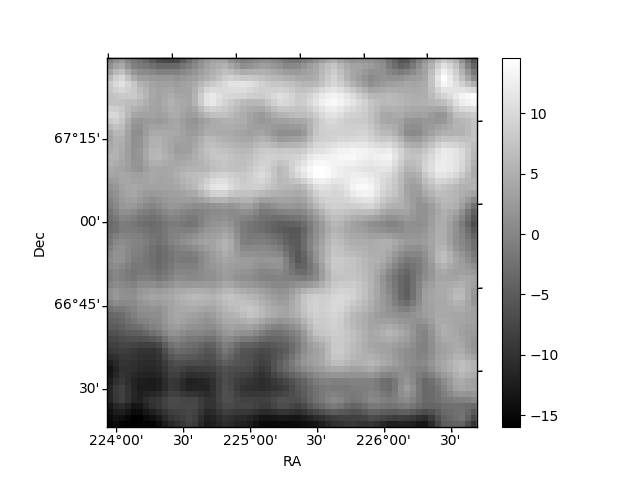
| Quadrant A | 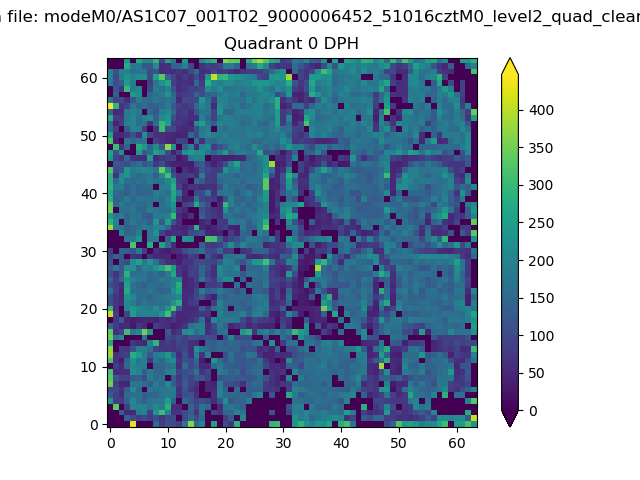 |
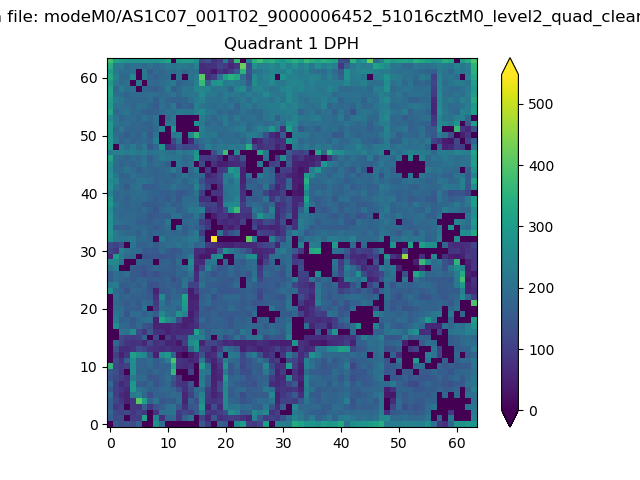 |
Quadrant B |
|---|---|---|---|
| Quadrant D | 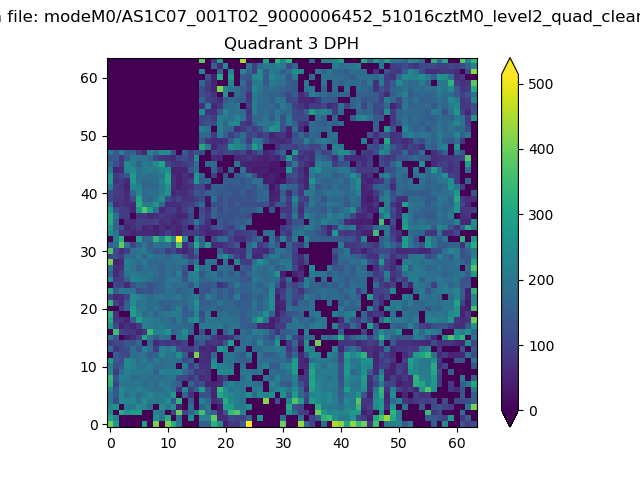 |
 |
Quadrant C |
| Plot type | Count rate plots | Images |
|---|---|---|
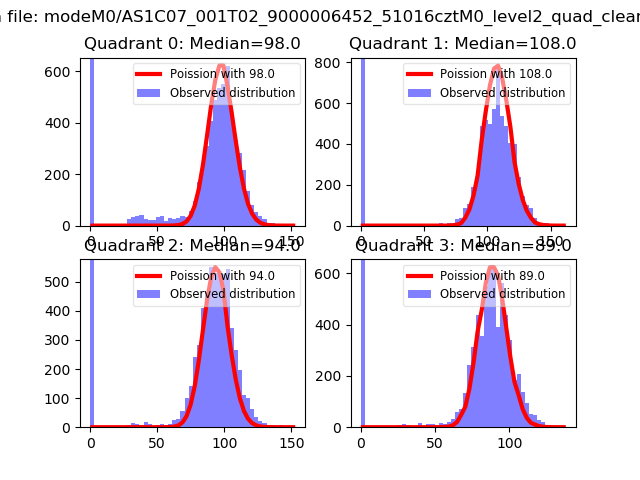
| Comparison with Poisson distribution Blue bars denote a histogram of data divided into 1 sec bins. Red curve is a Poisson curve with rate = median count rate of data. |
 |
 |
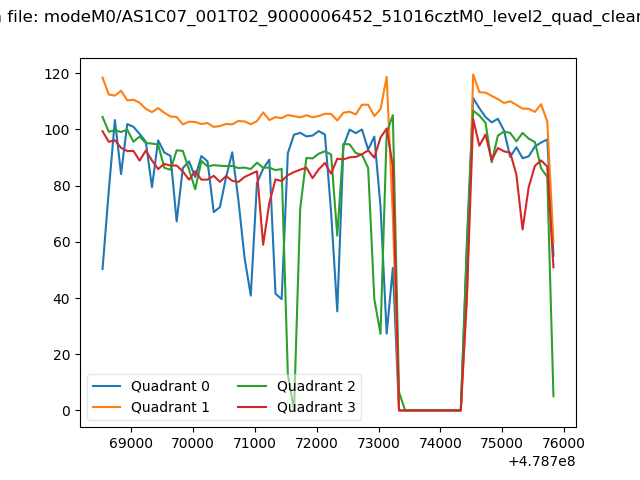
| Quadrant-wise count rates Data is divided into 100 sec bins |
 |
|
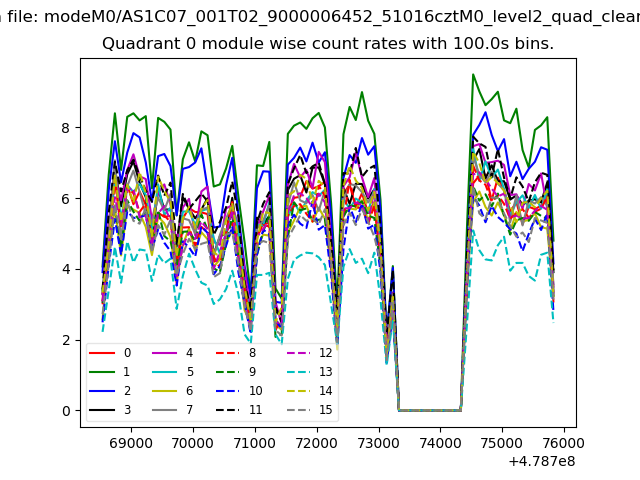
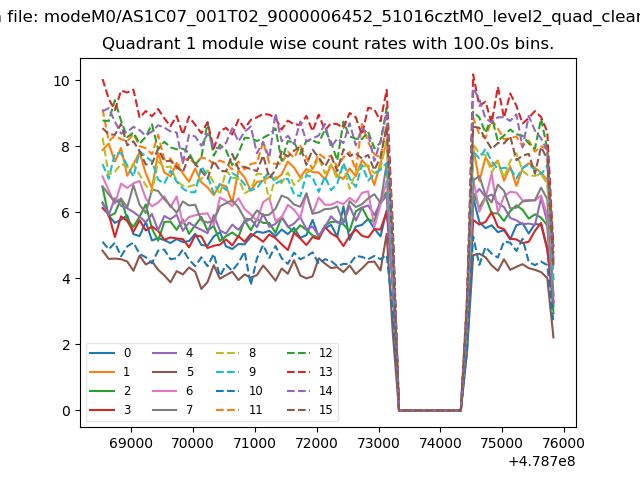
| Module-wise count rates for Quadrant A Data is divided into 100 sec bins |
 |
 |
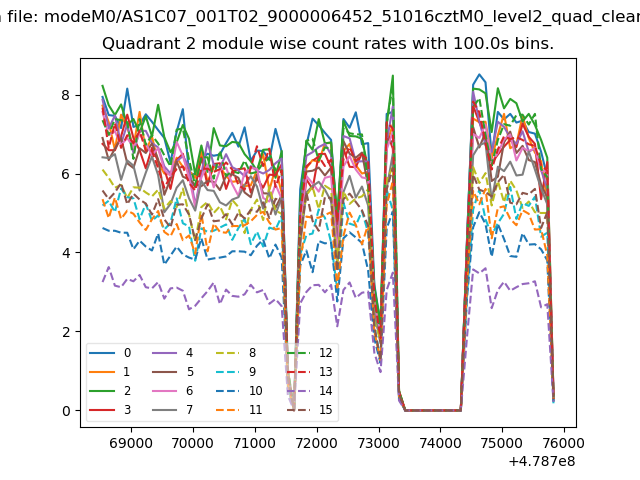
| Module-wise count rates for Quadrant B Data is divided into 100 sec bins |
 |
 |
| Module-wise count rates for Quadrant C Data is divided into 100 sec bins |
 |
 |
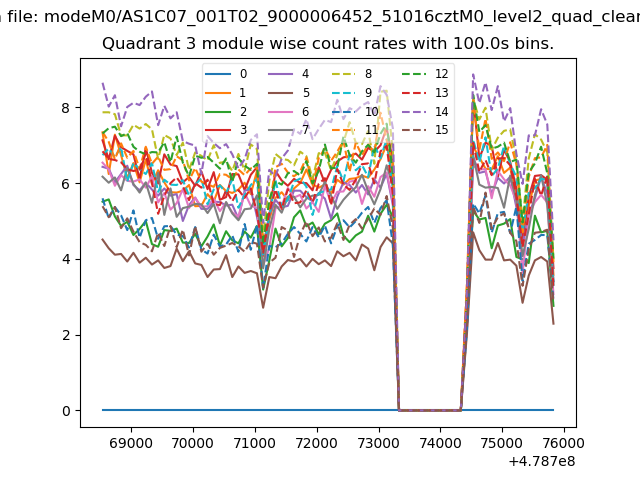
| Module-wise count rates for Quadrant D Data is divided into 100 sec bins |
 |
 |
| Parameter | Plot |
|---|---|
| CZT HV Monitor | 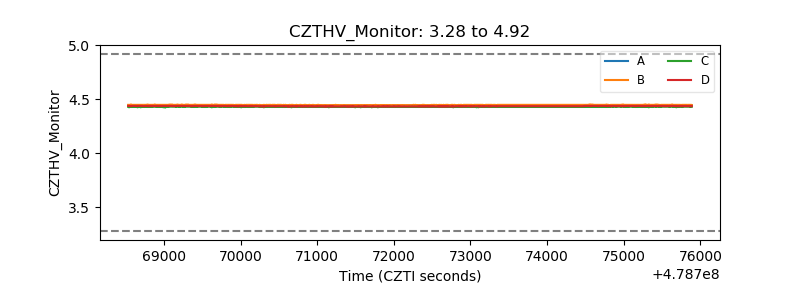 |
| D_VDD | 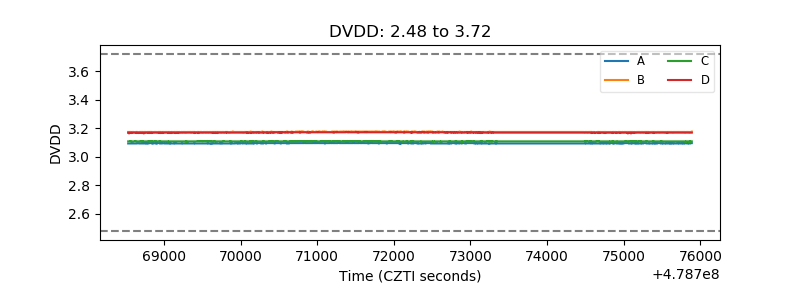 |
| Temperature 1 | 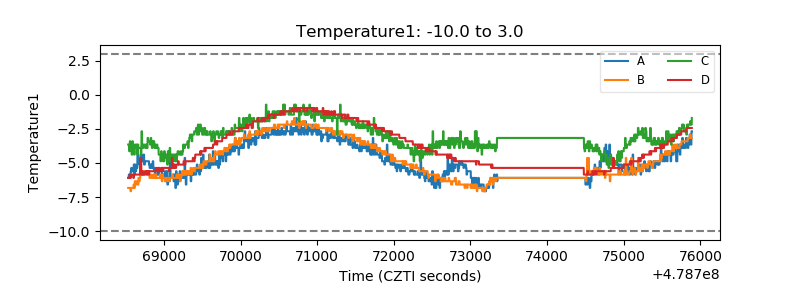 |
| Veto HV Monitor | 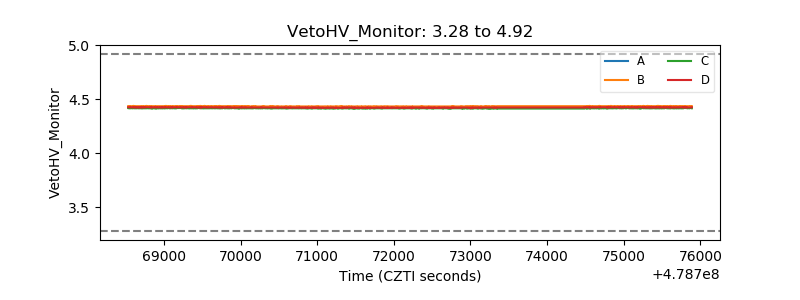 |
| Veto LLD | 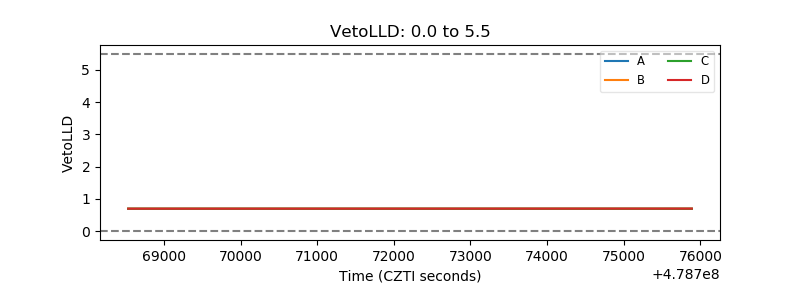 |
| Alpha Counter | 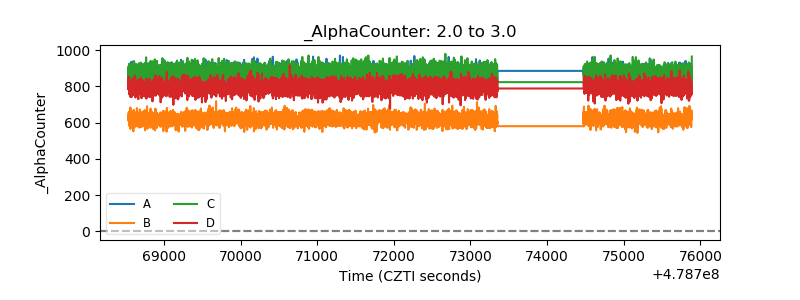 |
| _CPM_Rate | 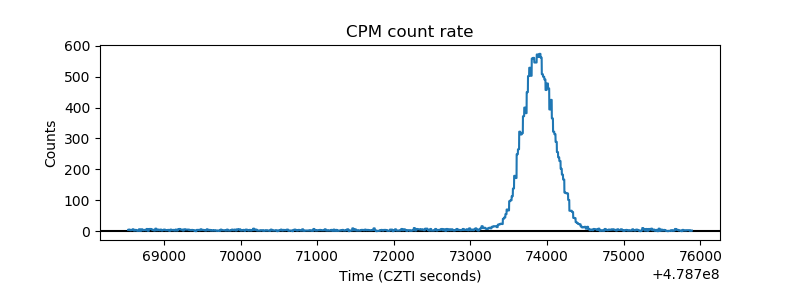 |
| CZT Counter | 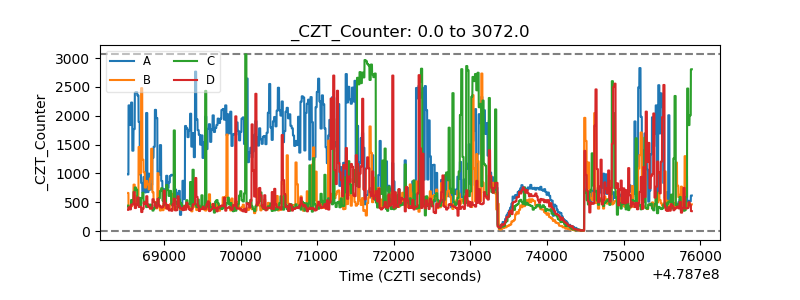 |
| +2.5 Volts monitor | 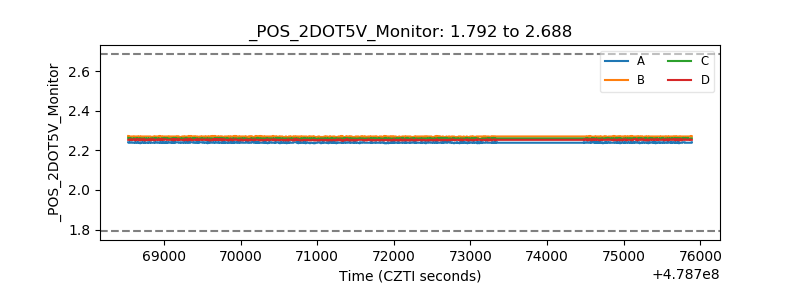 |
| +5 Volts monitor | 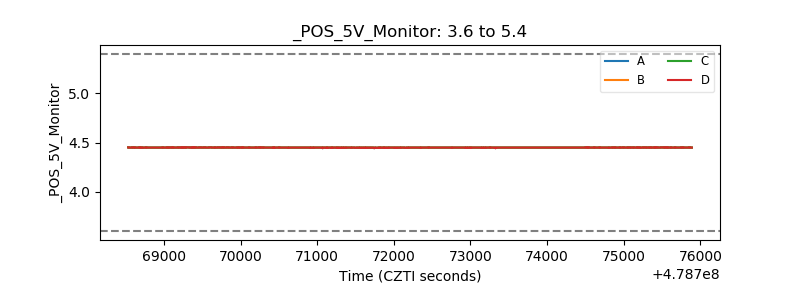 |
| _ROLL_ROT | 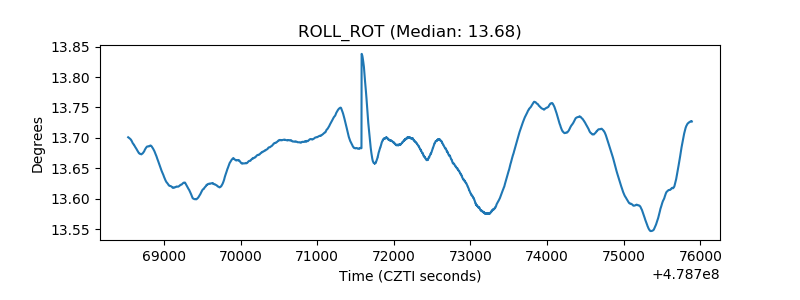 |
| _Roll_DEC | 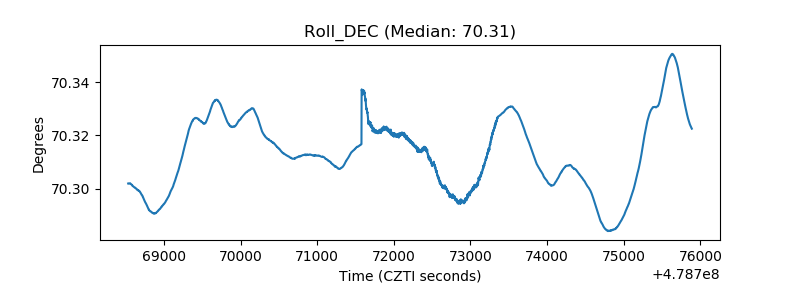 |
| _Roll_RA | 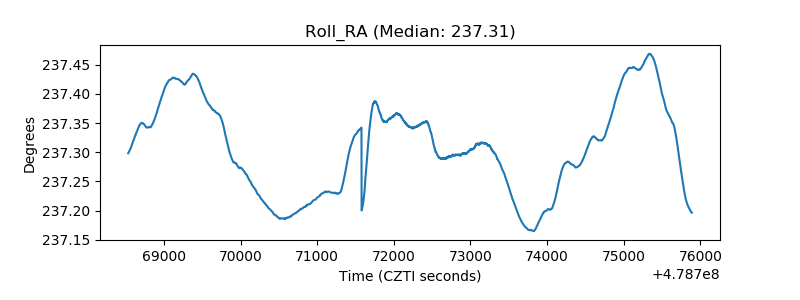 |
| Veto Counter | 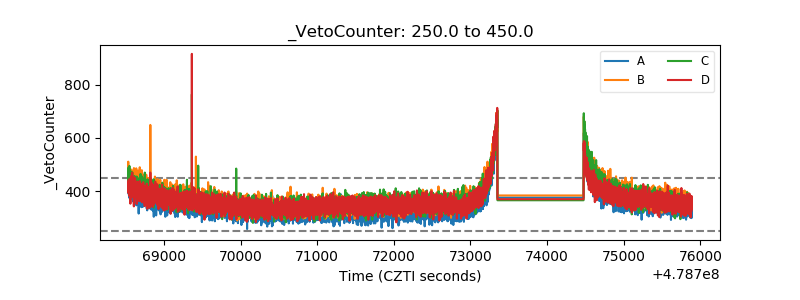 |