| Param | Original file | Final file |
|---|---|---|
| Filename | modeM0/AS1C07_001T02_9000006452_51017cztM0_level2.fits | modeM0/AS1C07_001T02_9000006452_51017cztM0_level2_quad_clean.evt |
| Size (bytes) | 521,815,680 | 96,289,920 |
| Size | 497.6 MB | 91.8 MB |
| Events in quadrant A | 4,649,926 | 631,920 |
| Events in quadrant B | 4,921,281 | 672,294 |
| Events in quadrant C | 4,594,824 | 589,658 |
| Events in quadrant D | 4,638,681 | 562,695 |
| Mode SS | |||
|---|---|---|---|
| Quadrant | BADHDUFLAG | Total packets | Discarded packets |
| A | 0 | 132 | 0 |
| B | 0 | 132 | 0 |
| C | 0 | 132 | 0 |
| D | 0 | 132 | 0 |
| Mode M9 | |||
|---|---|---|---|
| Quadrant | BADHDUFLAG | Total packets | Discarded packets |
| A | 0 | 11 | 0 |
| B | 0 | 12 | 0 |
| C | 0 | 12 | 0 |
| D | 0 | 12 | 0 |
| Mode M0 | |||
|---|---|---|---|
| Quadrant | BADHDUFLAG | Total packets | Discarded packets |
| A | 0 | 18250 | 2 |
| B | 0 | 19106 | 2 |
| C | 0 | 18243 | 2 |
| D | 0 | 18305 | 2 |
| Quadrant | Total seconds | Saturated seconds | Saturation percentage |
|---|---|---|---|
| A | 6589 | 235 | 3.566550% |
| B | 6588 | 396 | 6.010929% |
| C | 6588 | 462 | 7.012750% |
| D | 6588 | 304 | 4.614451% |
Noise dominated data is calculated using 1-second bins in cleaned event files. If a bin has >2000 counts, and if more than 50% of those come from <1% of pixels, then it is considered to be noise-dominated and hence unusable.
| Quadrant | # 1 sec bins | Bins with >0 counts | Bins with >2000 counts | High rate bins dominated by noise | Noise dominated (total time) | Noise dominated (detector-on time) | Marked lightcurve |
|---|---|---|---|---|---|---|---|
| A | 7649 | 6590 | 98 | 98 | 1.28% | 1.49% | 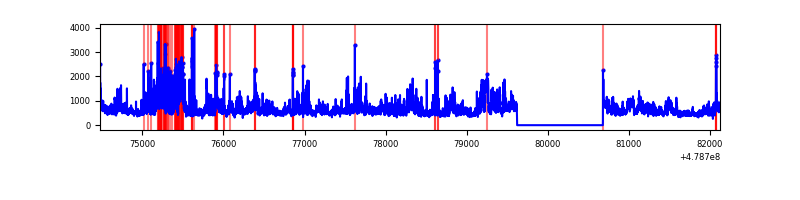 |
| B | 7648 | 6589 | 175 | 175 | 2.29% | 2.66% | 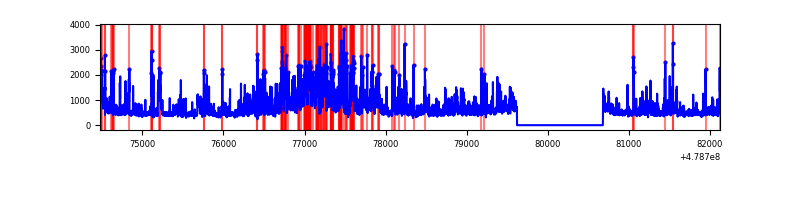 |
| C | 7648 | 6589 | 325 | 325 | 4.25% | 4.93% | 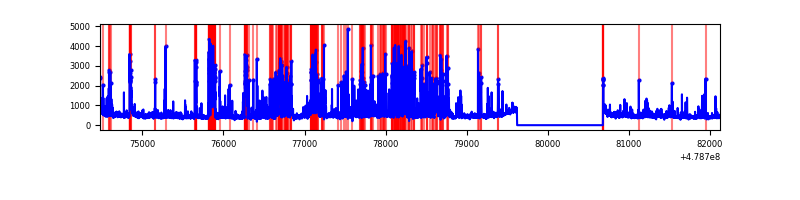 |
| D | 7648 | 6589 | 210 | 210 | 2.75% | 3.19% | 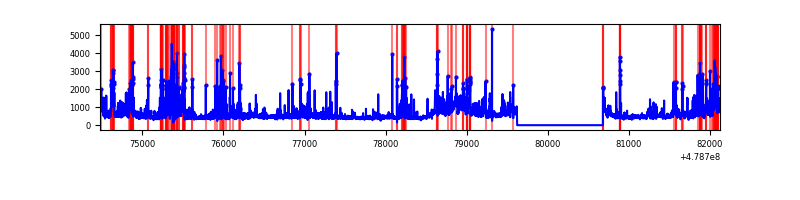 |
Top three noisy pixels from each quadrant. If the there are fewer than three noisy pixels in the level2.evt file, extra rows are filled as -1
| Pixel properties | Quadrant properties | ||||||
|---|---|---|---|---|---|---|---|
| Quadrant | DetID | PixID | Counts | Sigma | Mean | Median | Sigma |
| A | 12 | 3 | 633206 | 3612.99 | 707 | 689 | 175.1 |
| A | 12 | 80 | 403993 | 2303.71 | 707 | 689 | 175.1 |
| A | 14 | 254 | 159960 | 909.77 | 707 | 689 | 175.1 |
| B | 4 | 81 | 686287 | 4699.87 | 690 | 667 | 145.9 |
| B | 4 | 171 | 418460 | 2863.94 | 690 | 667 | 145.9 |
| B | 0 | 172 | 250456 | 1712.28 | 690 | 667 | 145.9 |
| C | 0 | 177 | 675563 | 3695.66 | 666 | 659 | 182.6 |
| C | 13 | 3 | 355347 | 1942.21 | 666 | 659 | 182.6 |
| C | 15 | 229 | 215561 | 1176.76 | 666 | 659 | 182.6 |
| D | 2 | 216 | 528502 | 2791.71 | 673 | 649 | 189.1 |
| D | 6 | 42 | 440158 | 2324.48 | 673 | 649 | 189.1 |
| D | 8 | 176 | 248351 | 1310.05 | 673 | 649 | 189.1 |
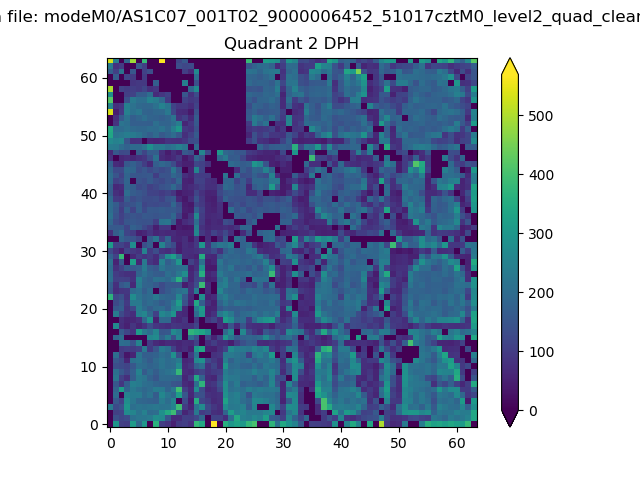
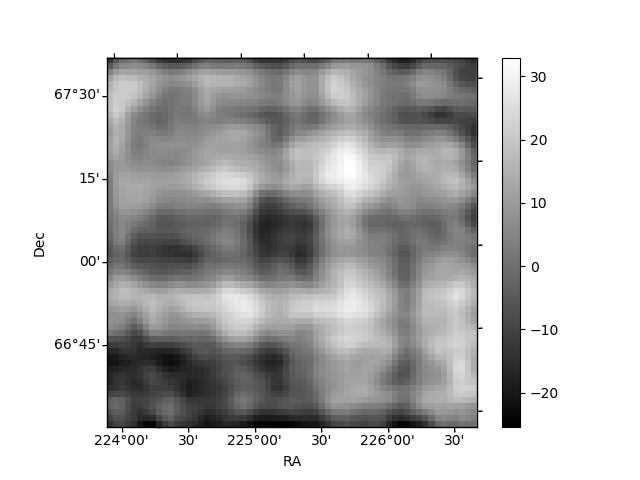
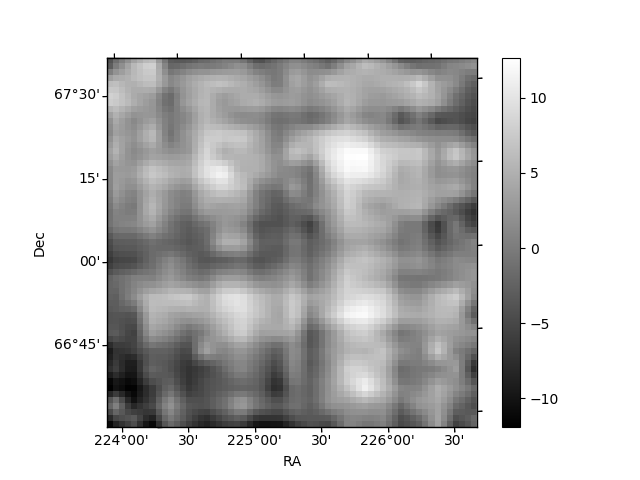
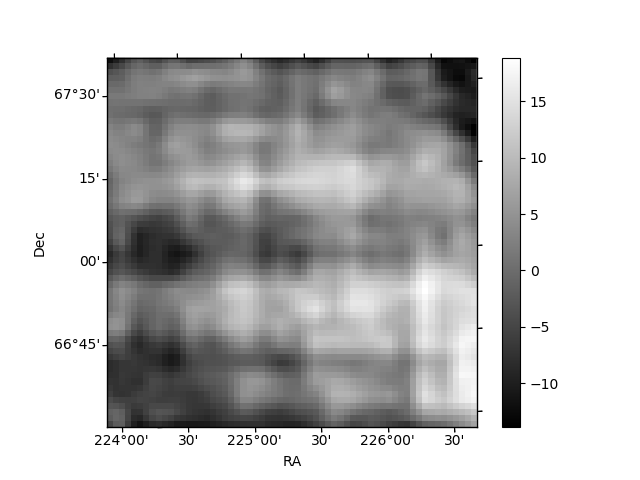
Histogram calculated using DETX and DETY for each event in the final _common_clean file
| Quadrant A | 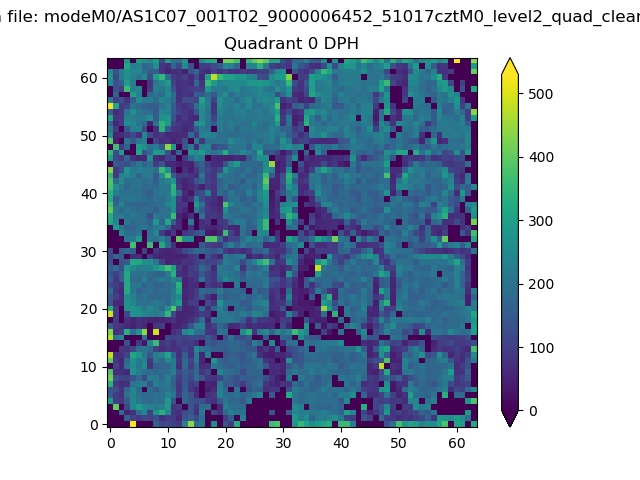 |
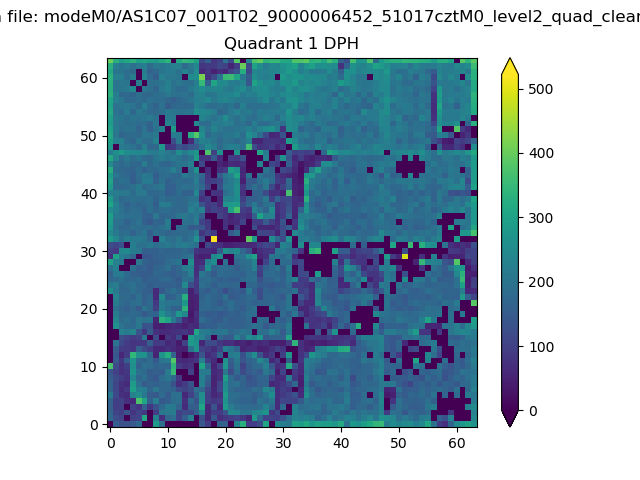 |
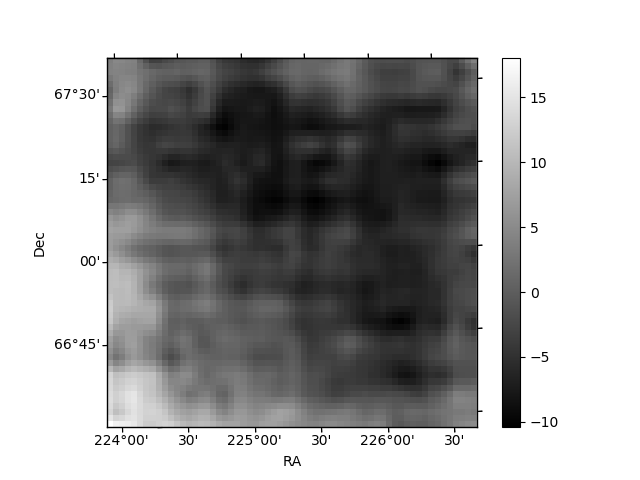
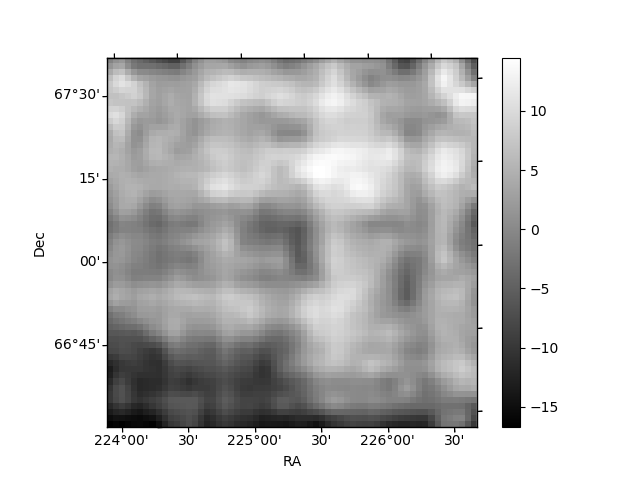
Quadrant B |
|---|---|---|---|
| Quadrant D | 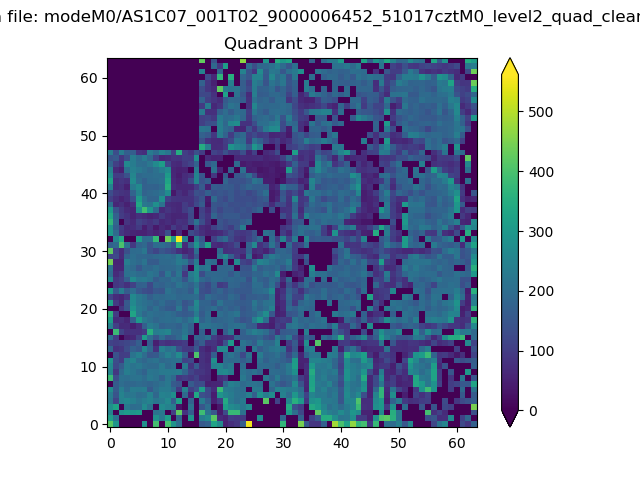 |
 |
Quadrant C |
| Plot type | Count rate plots | Images |
|---|---|---|
| Comparison with Poisson distribution Blue bars denote a histogram of data divided into 1 sec bins. Red curve is a Poisson curve with rate = median count rate of data. |
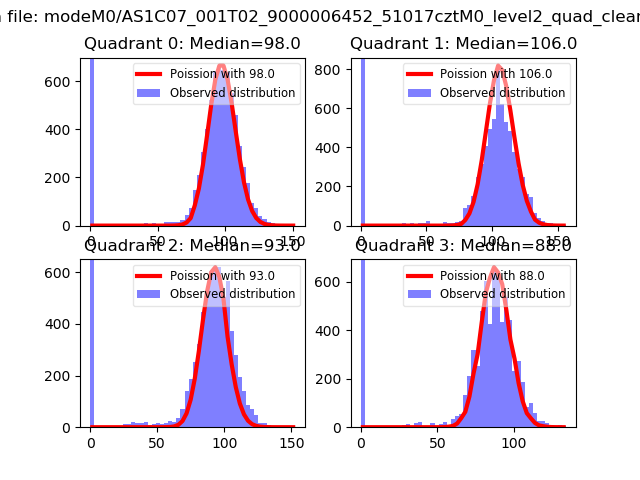 |
 |
| Quadrant-wise count rates Data is divided into 100 sec bins |
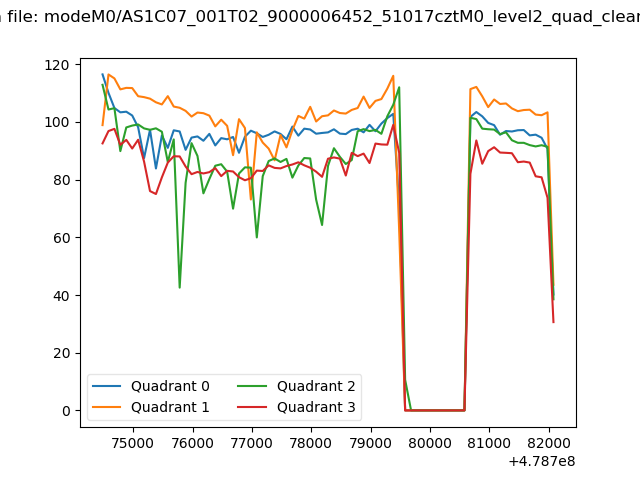 |
|
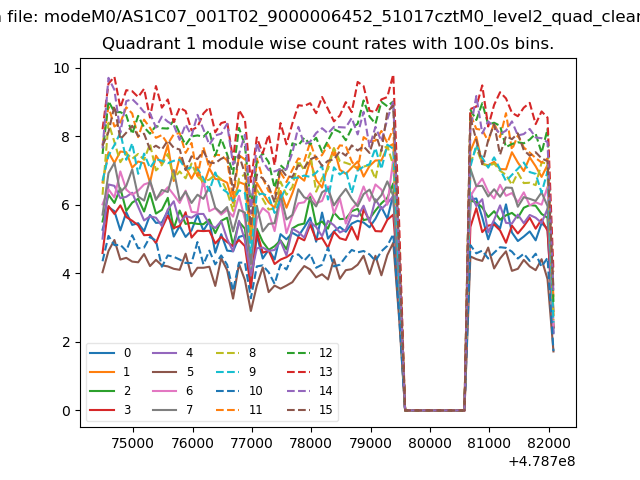
| Module-wise count rates for Quadrant A Data is divided into 100 sec bins |
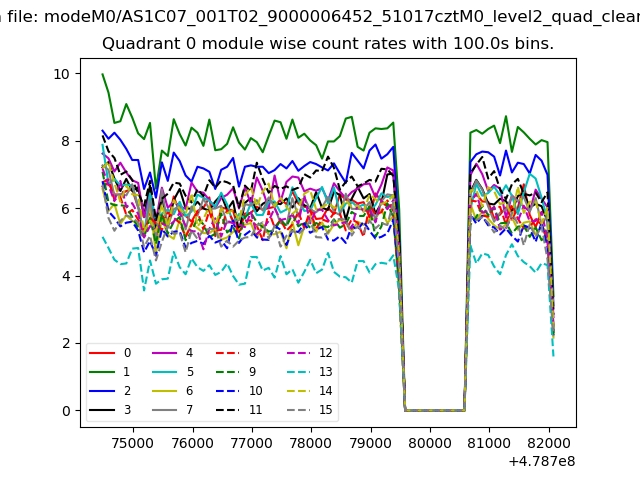 |
 |
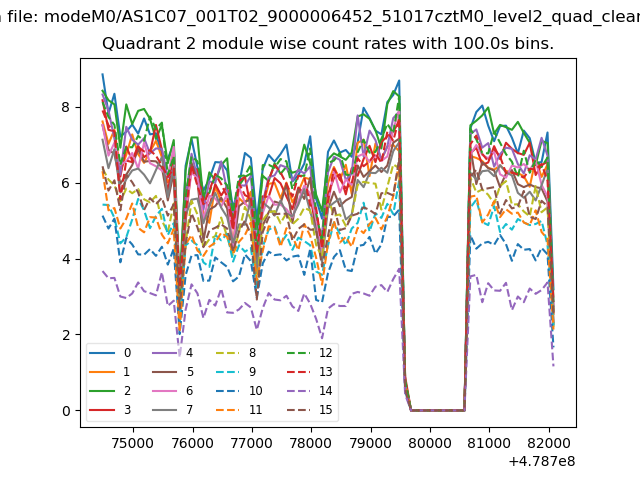
| Module-wise count rates for Quadrant B Data is divided into 100 sec bins |
 |
 |
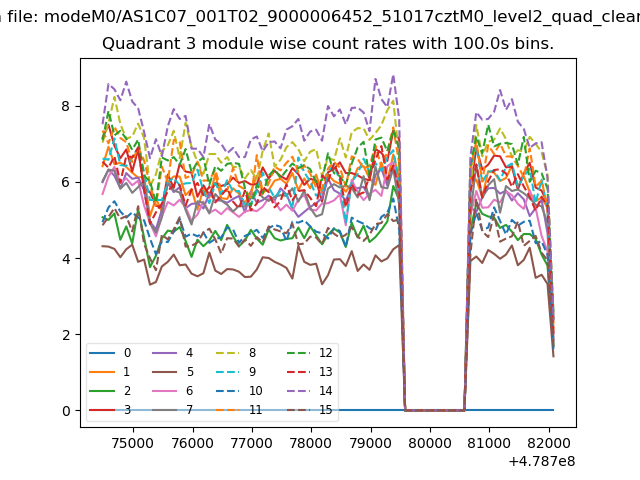
| Module-wise count rates for Quadrant C Data is divided into 100 sec bins |
 |
 |
| Module-wise count rates for Quadrant D Data is divided into 100 sec bins |
 |
 |
| Parameter | Plot |
|---|---|
| CZT HV Monitor | 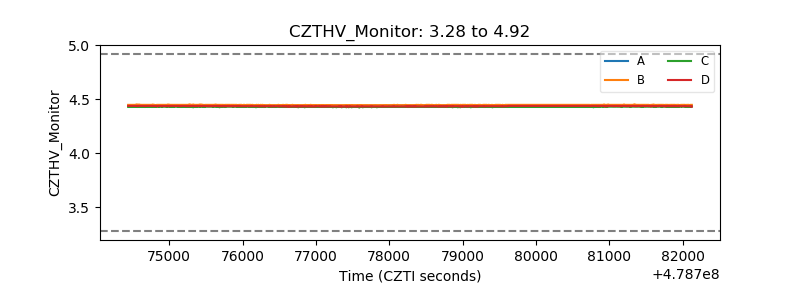 |
| D_VDD | 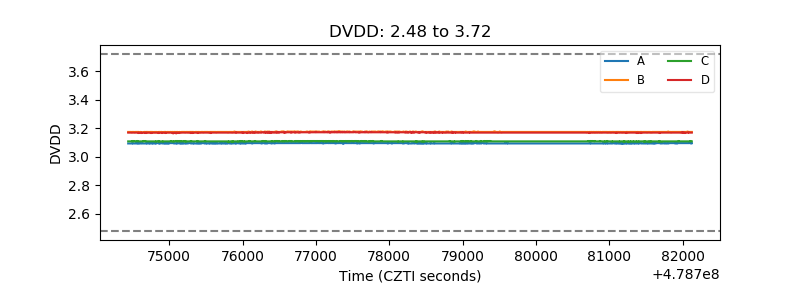 |
| Temperature 1 | 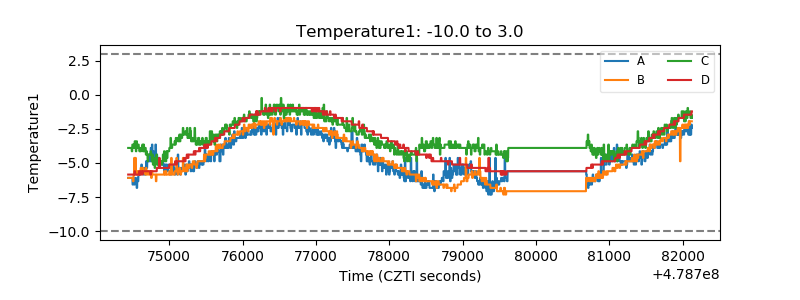 |
| Veto HV Monitor | 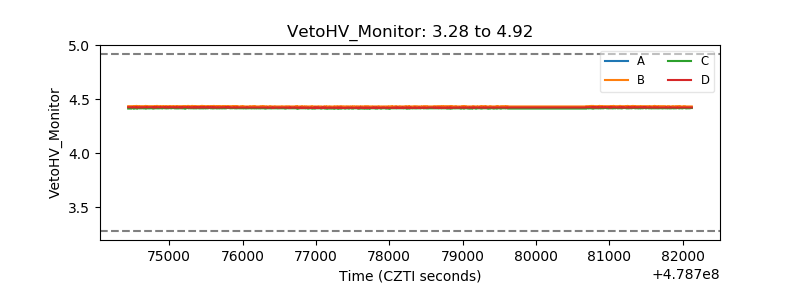 |
| Veto LLD | 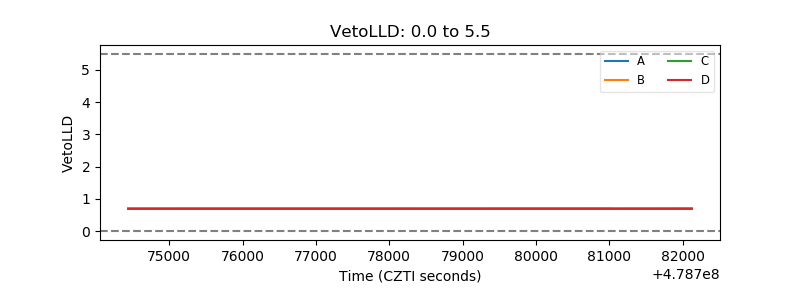 |
| Alpha Counter | 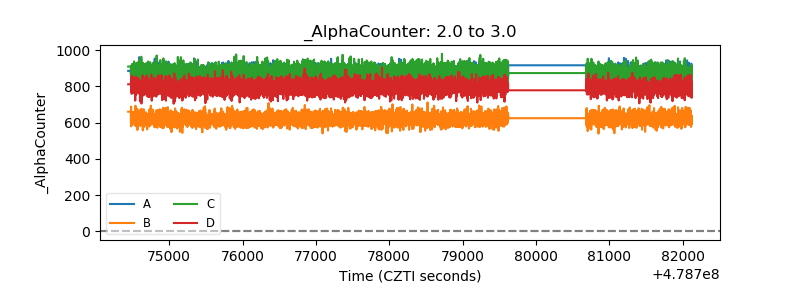 |
| _CPM_Rate | 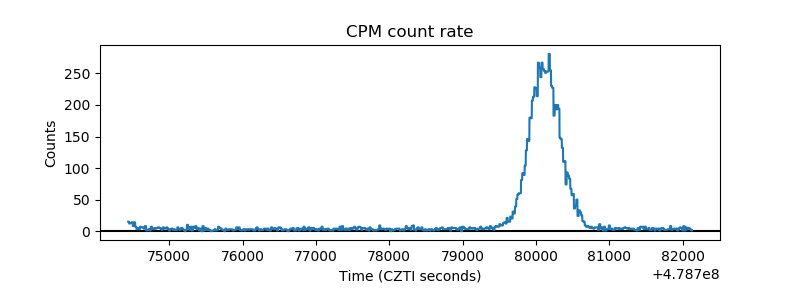 |
| CZT Counter | 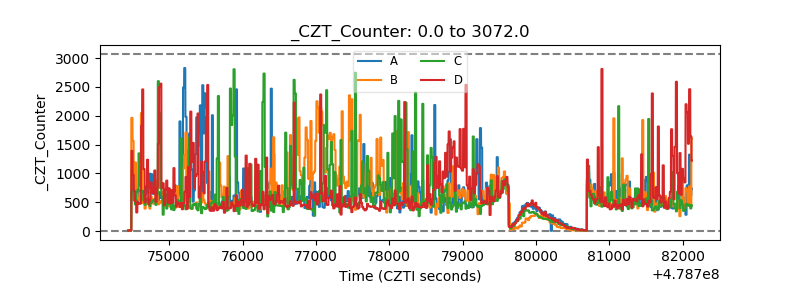 |
| +2.5 Volts monitor | 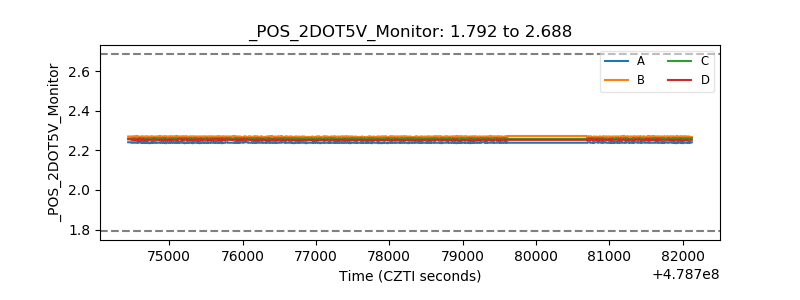 |
| +5 Volts monitor |  |
| _ROLL_ROT | 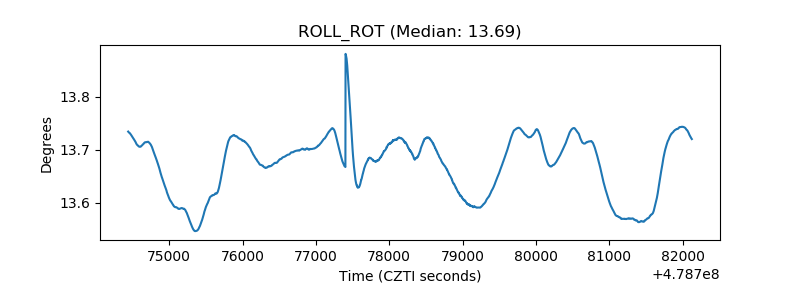 |
| _Roll_DEC | 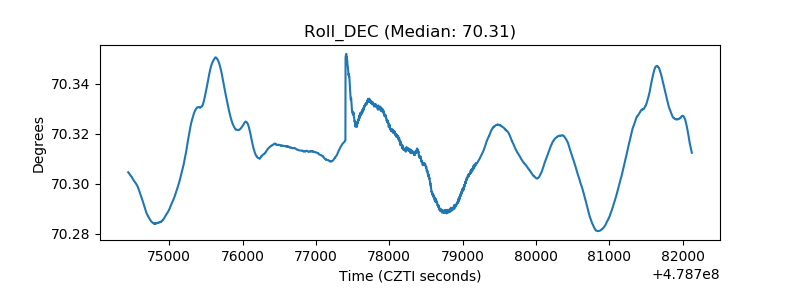 |
| _Roll_RA | 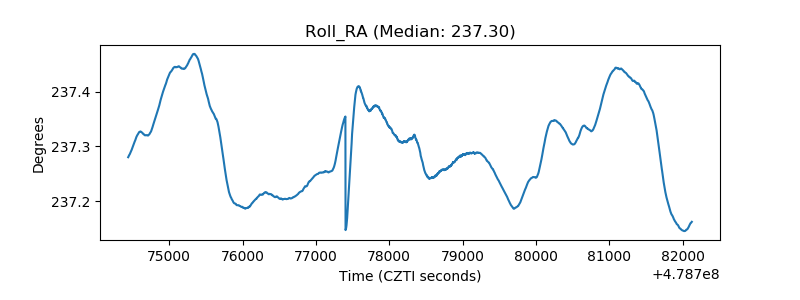 |
| Veto Counter | 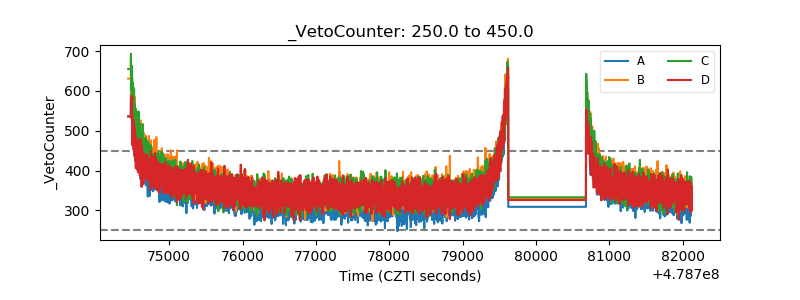 |