| Param | Original file | Final file |
|---|---|---|
| Filename | modeM0/AS1C07_001T02_9000006452_51018cztM0_level2.fits | modeM0/AS1C07_001T02_9000006452_51018cztM0_level2_quad_clean.evt |
| Size (bytes) | 565,162,560 | 99,748,800 |
| Size | 539.0 MB | 95.1 MB |
| Events in quadrant A | 5,078,461 | 655,899 |
| Events in quadrant B | 5,572,181 | 679,475 |
| Events in quadrant C | 5,131,674 | 602,912 |
| Events in quadrant D | 4,587,637 | 588,403 |
| Mode SS | |||
|---|---|---|---|
| Quadrant | BADHDUFLAG | Total packets | Discarded packets |
| A | 0 | 142 | 0 |
| B | 0 | 142 | 0 |
| C | 0 | 142 | 0 |
| D | 0 | 142 | 0 |
| Mode M9 | |||
|---|---|---|---|
| Quadrant | BADHDUFLAG | Total packets | Discarded packets |
| A | 0 | 9 | 0 |
| B | 0 | 10 | 0 |
| C | 0 | 10 | 0 |
| D | 0 | 10 | 0 |
| Mode M0 | |||
|---|---|---|---|
| Quadrant | BADHDUFLAG | Total packets | Discarded packets |
| A | 0 | 19945 | 2 |
| B | 0 | 21398 | 2 |
| C | 0 | 20202 | 2 |
| D | 0 | 18559 | 2 |
| Quadrant | Total seconds | Saturated seconds | Saturation percentage |
|---|---|---|---|
| A | 7095 | 305 | 4.298802% |
| B | 7094 | 700 | 9.867494% |
| C | 7094 | 566 | 7.978573% |
| D | 7094 | 302 | 4.257119% |
Noise dominated data is calculated using 1-second bins in cleaned event files. If a bin has >2000 counts, and if more than 50% of those come from <1% of pixels, then it is considered to be noise-dominated and hence unusable.
| Quadrant | # 1 sec bins | Bins with >0 counts | Bins with >2000 counts | High rate bins dominated by noise | Noise dominated (total time) | Noise dominated (detector-on time) | Marked lightcurve |
|---|---|---|---|---|---|---|---|
| A | 7925 | 7096 | 121 | 121 | 1.53% | 1.71% | 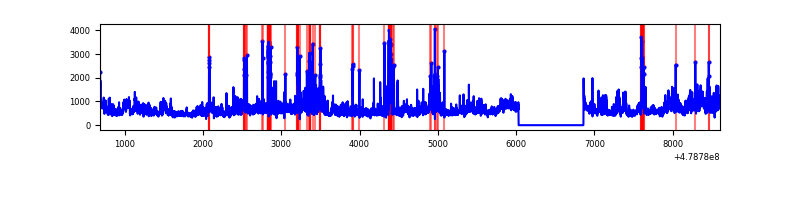 |
| B | 7924 | 7095 | 354 | 354 | 4.47% | 4.99% | 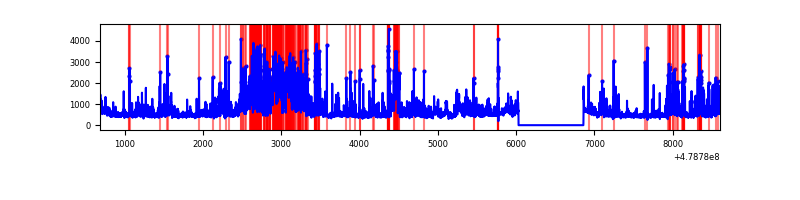 |
| C | 7924 | 7095 | 428 | 428 | 5.40% | 6.03% | 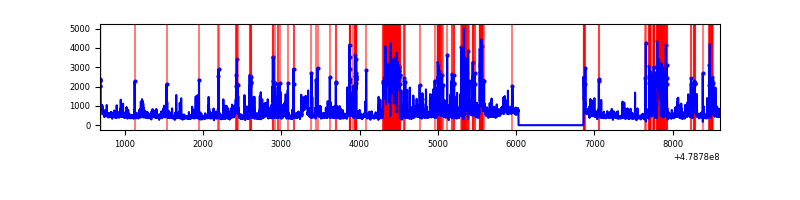 |
| D | 7924 | 7095 | 166 | 166 | 2.09% | 2.34% | 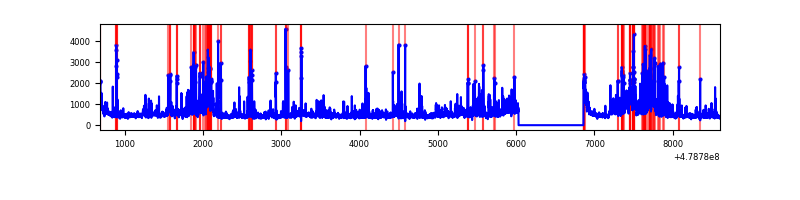 |
Top three noisy pixels from each quadrant. If the there are fewer than three noisy pixels in the level2.evt file, extra rows are filled as -1
| Pixel properties | Quadrant properties | ||||||
|---|---|---|---|---|---|---|---|
| Quadrant | DetID | PixID | Counts | Sigma | Mean | Median | Sigma |
| A | 12 | 3 | 996356 | 5282.65 | 753 | 734 | 188.5 |
| A | 14 | 254 | 247338 | 1308.45 | 753 | 734 | 188.5 |
| A | 8 | 38 | 125600 | 662.52 | 753 | 734 | 188.5 |
| B | 4 | 81 | 669290 | 4336.83 | 727 | 699 | 154.2 |
| B | 4 | 171 | 562025 | 3641.05 | 727 | 699 | 154.2 |
| B | 12 | 32 | 551951 | 3575.71 | 727 | 699 | 154.2 |
| C | 15 | 229 | 652858 | 3331.02 | 710 | 704 | 195.8 |
| C | 9 | 38 | 473423 | 2414.52 | 710 | 704 | 195.8 |
| C | 15 | 147 | 231950 | 1181.14 | 710 | 704 | 195.8 |
| D | 6 | 42 | 518891 | 2589.69 | 722 | 694 | 200.1 |
| D | 2 | 216 | 349200 | 1741.66 | 722 | 694 | 200.1 |
| D | 8 | 176 | 322553 | 1608.49 | 722 | 694 | 200.1 |
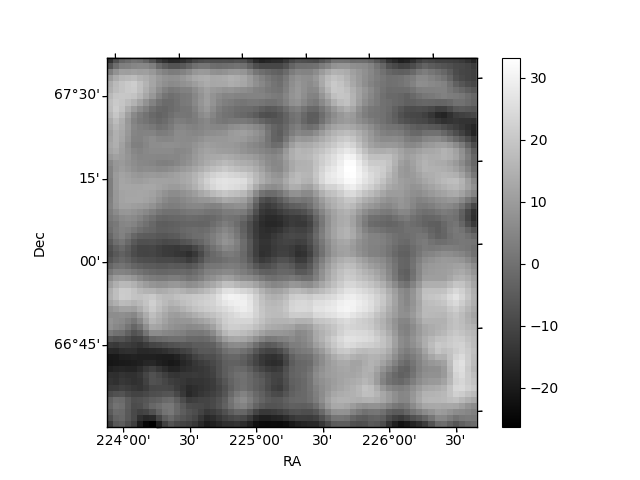
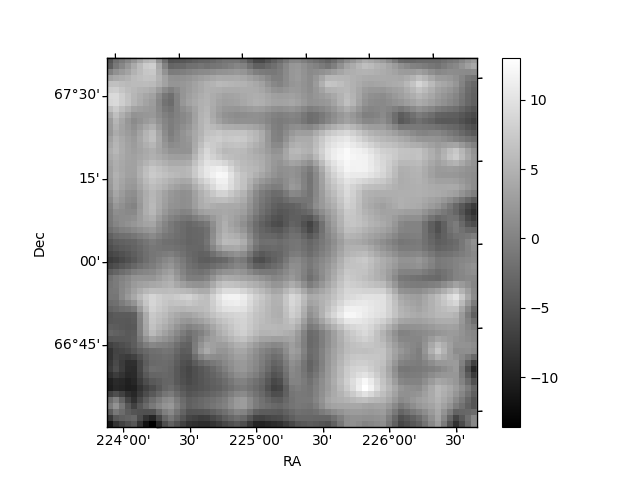
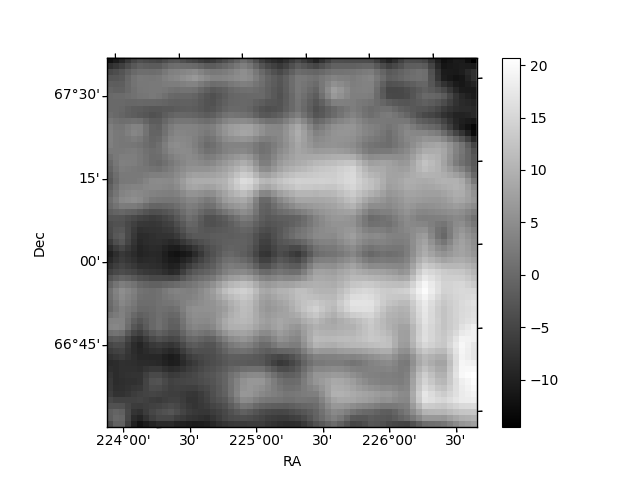
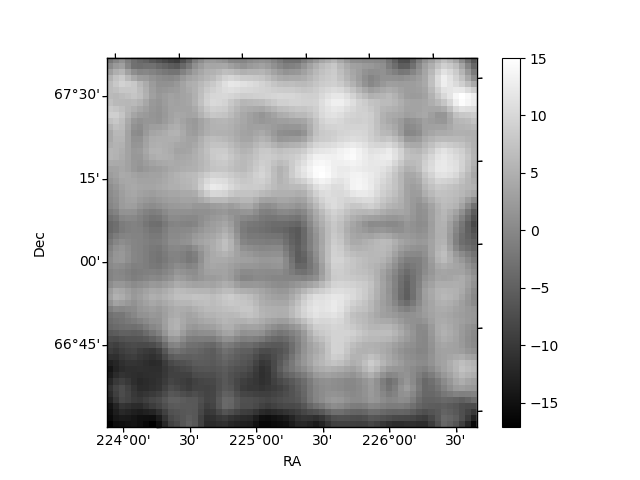
Histogram calculated using DETX and DETY for each event in the final _common_clean file
| Quadrant A | 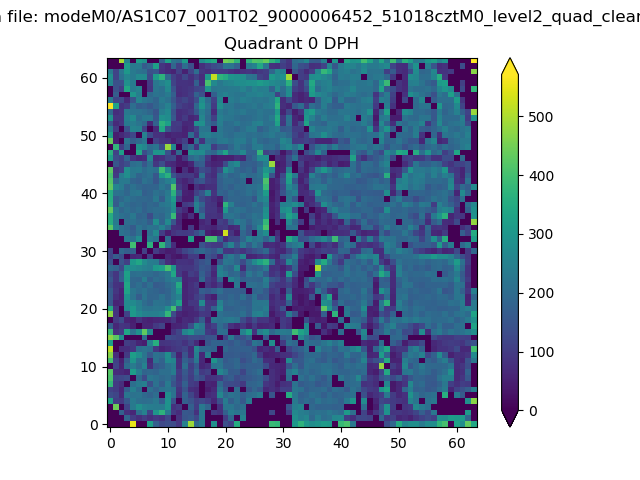 |
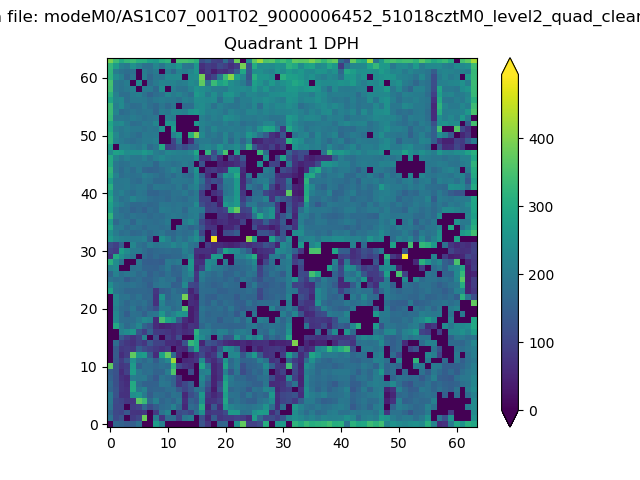 |
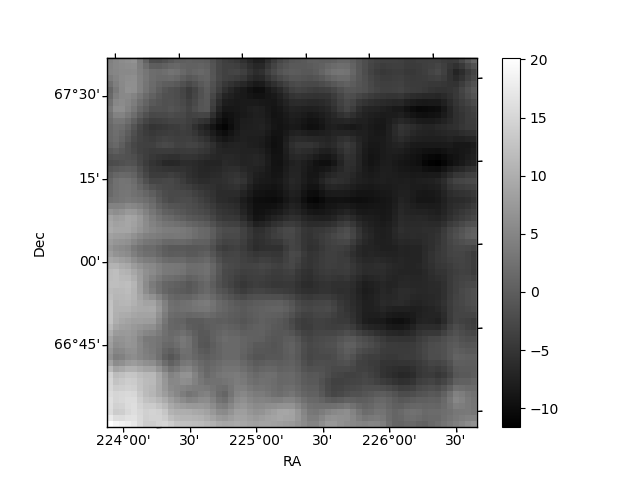
Quadrant B |
|---|---|---|---|
| Quadrant D | 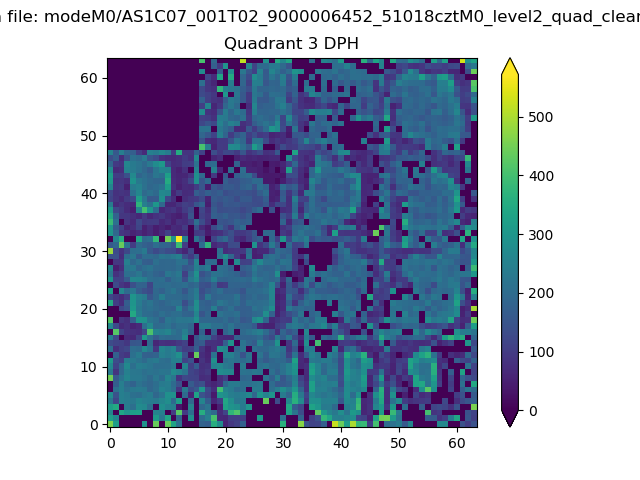 |
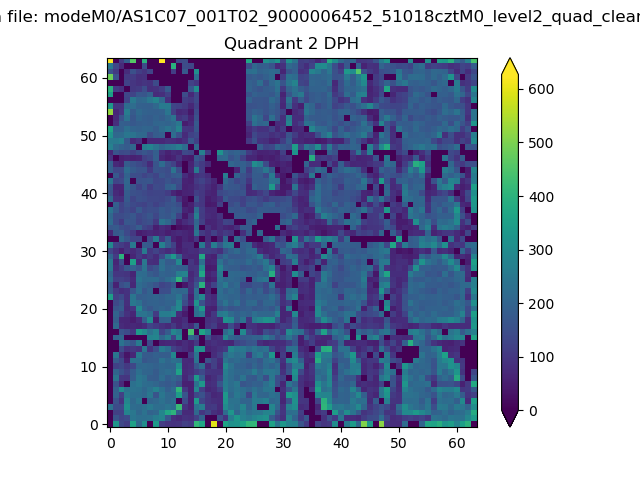 |
Quadrant C |
| Plot type | Count rate plots | Images |
|---|---|---|
| Comparison with Poisson distribution Blue bars denote a histogram of data divided into 1 sec bins. Red curve is a Poisson curve with rate = median count rate of data. |
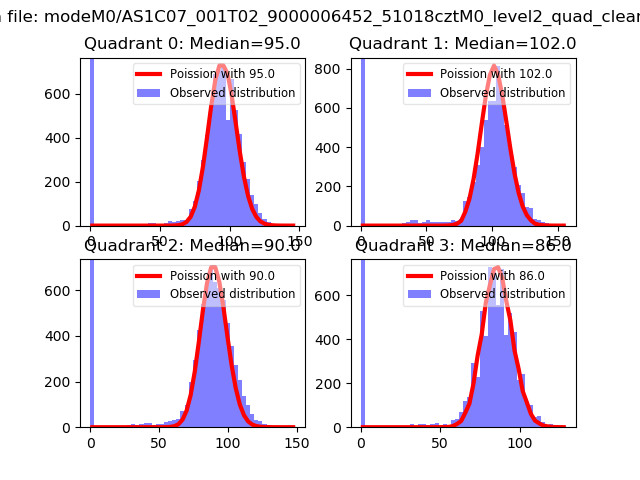 |
 |
| Quadrant-wise count rates Data is divided into 100 sec bins |
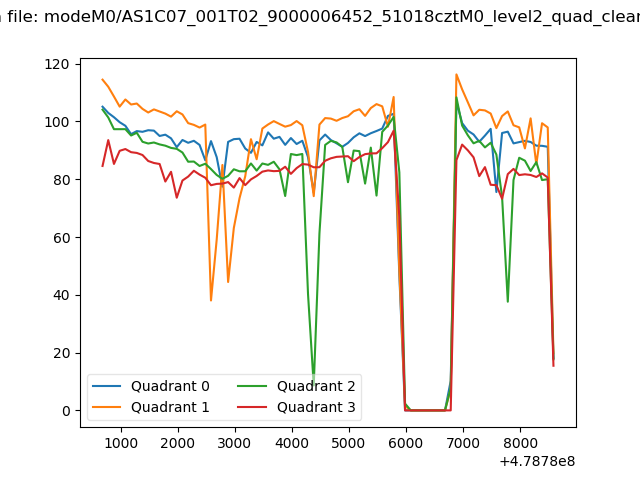 |
|
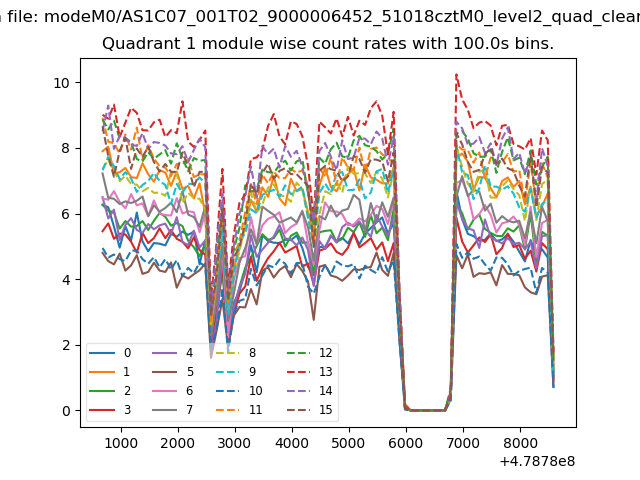
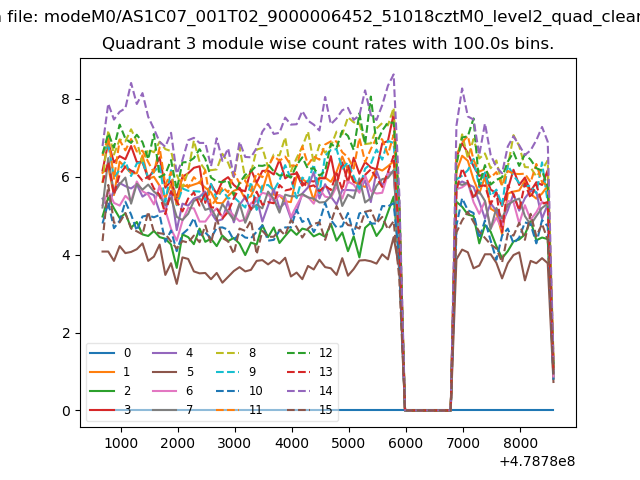
| Module-wise count rates for Quadrant A Data is divided into 100 sec bins |
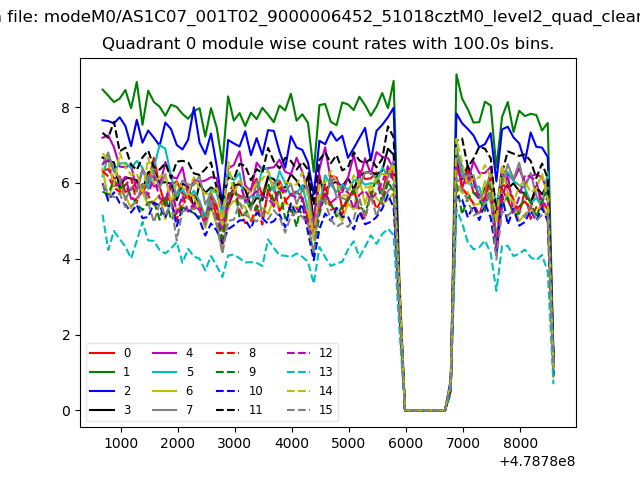 |
 |
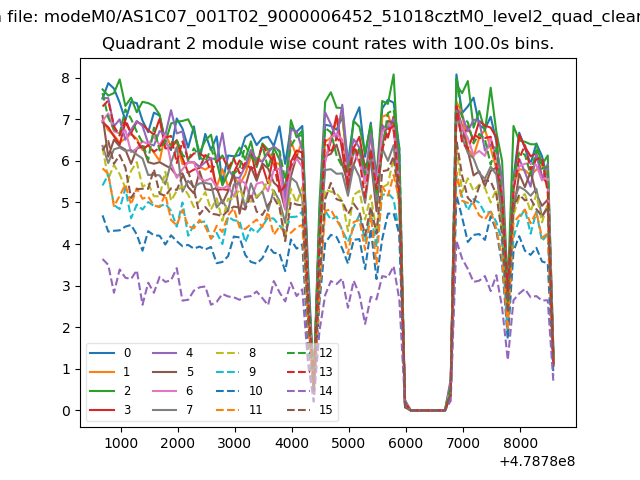
| Module-wise count rates for Quadrant B Data is divided into 100 sec bins |
 |
 |
| Module-wise count rates for Quadrant C Data is divided into 100 sec bins |
 |
 |
| Module-wise count rates for Quadrant D Data is divided into 100 sec bins |
 |
 |
| Parameter | Plot |
|---|---|
| CZT HV Monitor | 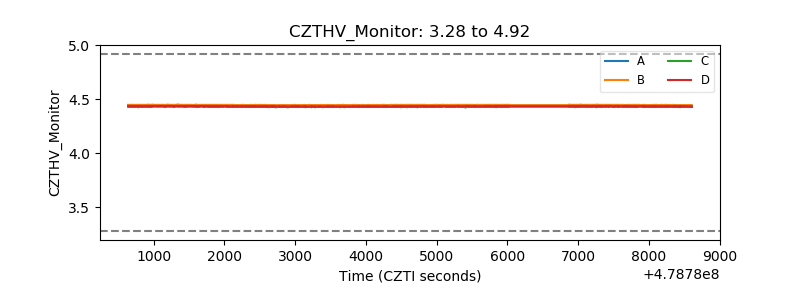 |
| D_VDD | 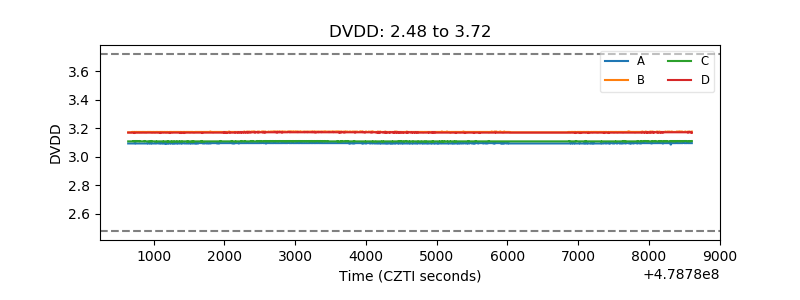 |
| Temperature 1 | 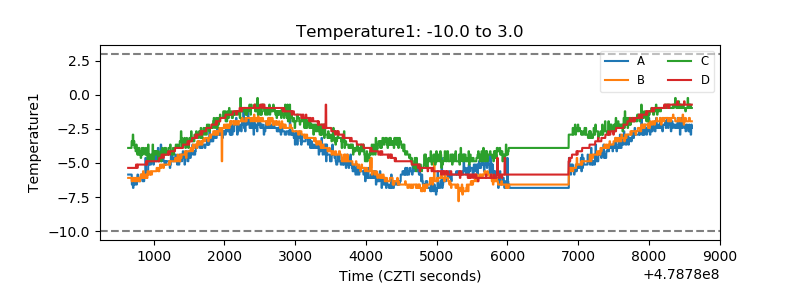 |
| Veto HV Monitor | 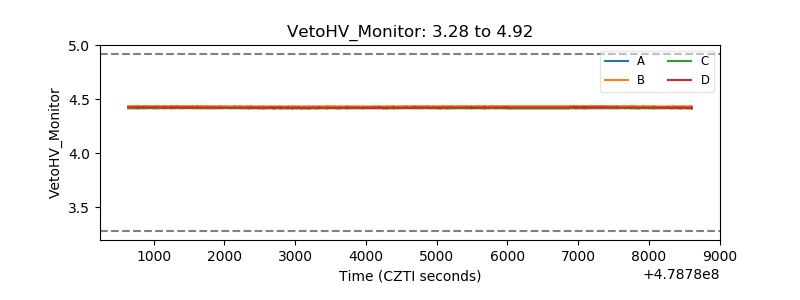 |
| Veto LLD | 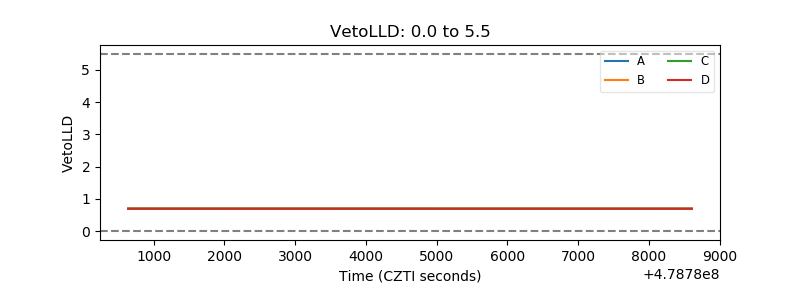 |
| Alpha Counter | 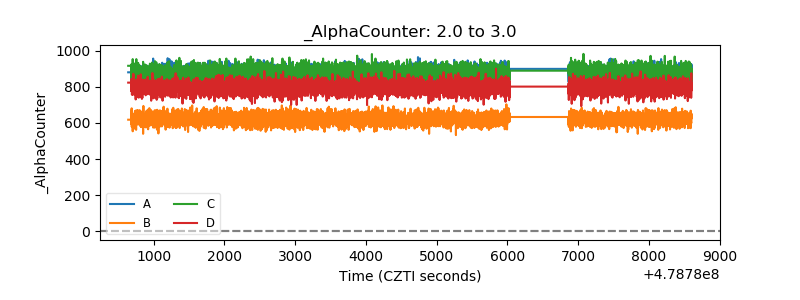 |
| _CPM_Rate | 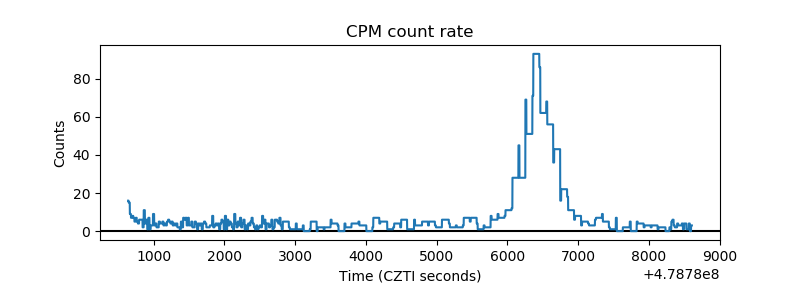 |
| CZT Counter | 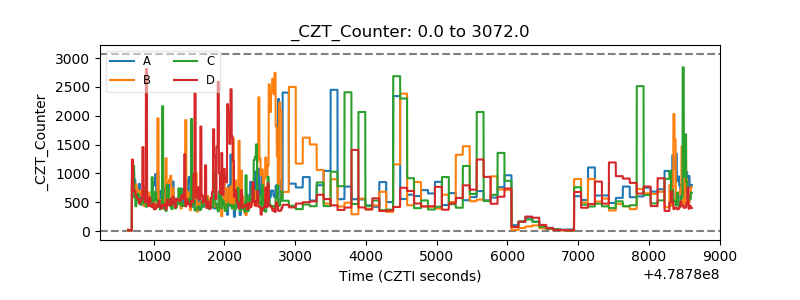 |
| +2.5 Volts monitor | 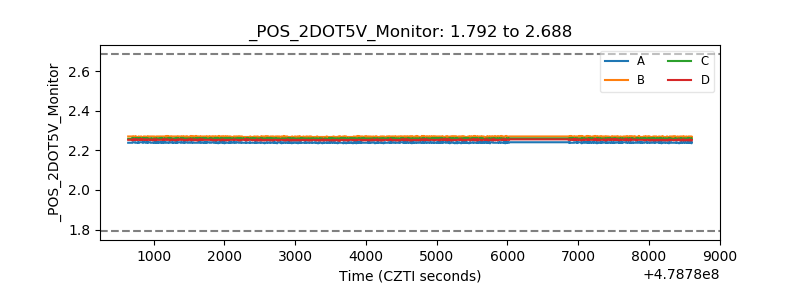 |
| +5 Volts monitor | 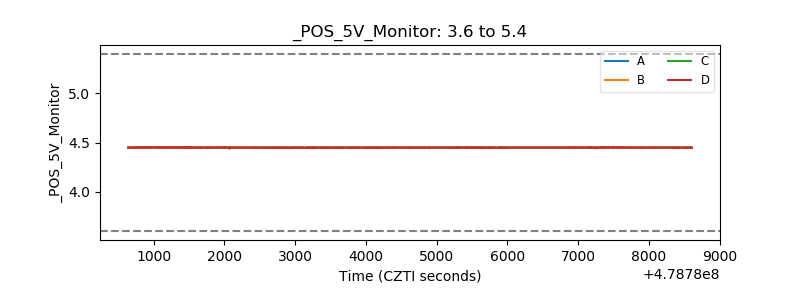 |
| _ROLL_ROT | 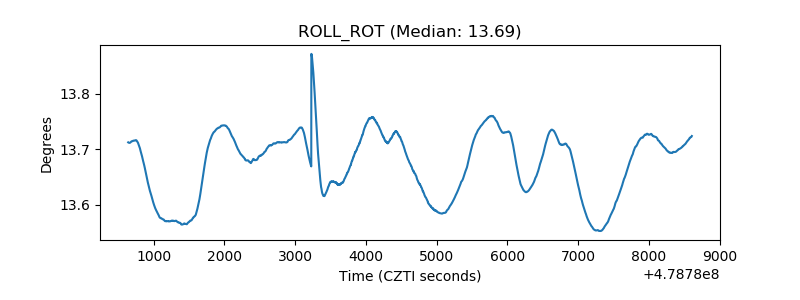 |
| _Roll_DEC | 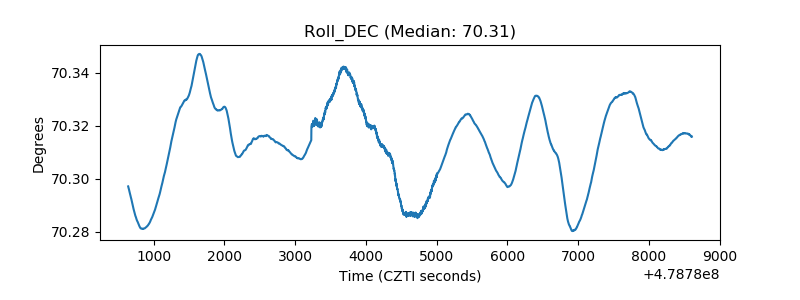 |
| _Roll_RA | 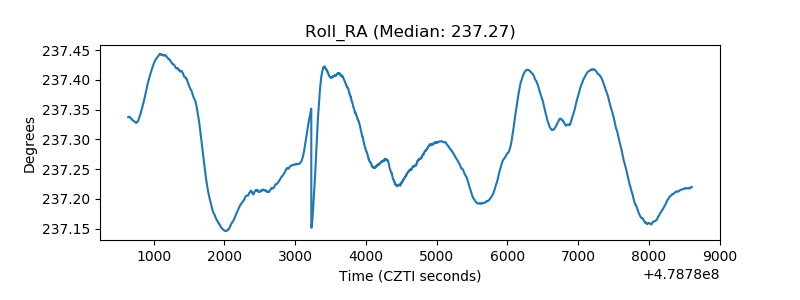 |
| Veto Counter | 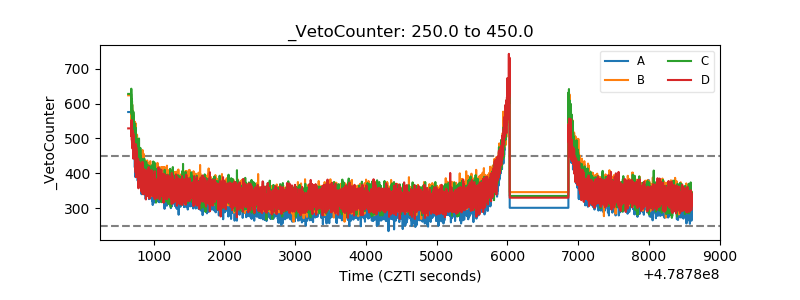 |