| Param | Original file | Final file |
|---|---|---|
| Filename | modeM0/AS1C07_001T02_9000006452_51019cztM0_level2.fits | modeM0/AS1C07_001T02_9000006452_51019cztM0_level2_quad_clean.evt |
| Size (bytes) | 770,158,080 | 89,300,160 |
| Size | 734.5 MB | 85.2 MB |
| Events in quadrant A | 9,196,263 | 586,160 |
| Events in quadrant B | 5,064,114 | 660,783 |
| Events in quadrant C | 8,999,076 | 430,029 |
| Events in quadrant D | 4,719,542 | 548,546 |
| Mode SS | |||
|---|---|---|---|
| Quadrant | BADHDUFLAG | Total packets | Discarded packets |
| A | 0 | 140 | 0 |
| B | 0 | 140 | 0 |
| C | 0 | 140 | 0 |
| D | 0 | 140 | 0 |
| Mode M9 | |||
|---|---|---|---|
| Quadrant | BADHDUFLAG | Total packets | Discarded packets |
| A | 0 | 4 | 0 |
| B | 0 | 4 | 0 |
| C | 0 | 4 | 0 |
| D | 0 | 4 | 0 |
| Mode M0 | |||
|---|---|---|---|
| Quadrant | BADHDUFLAG | Total packets | Discarded packets |
| A | 0 | 32134 | 1 |
| B | 0 | 19719 | 1 |
| C | 0 | 31479 | 1 |
| D | 0 | 18891 | 1 |
| Quadrant | Total seconds | Saturated seconds | Saturation percentage |
|---|---|---|---|
| A | 6856 | 904 | 13.185531% |
| B | 6855 | 474 | 6.914661% |
| C | 6856 | 2248 | 32.788798% |
| D | 6856 | 418 | 6.096849% |
Noise dominated data is calculated using 1-second bins in cleaned event files. If a bin has >2000 counts, and if more than 50% of those come from <1% of pixels, then it is considered to be noise-dominated and hence unusable.
| Quadrant | # 1 sec bins | Bins with >0 counts | Bins with >2000 counts | High rate bins dominated by noise | Noise dominated (total time) | Noise dominated (detector-on time) | Marked lightcurve |
|---|---|---|---|---|---|---|---|
| A | 7276 | 6857 | 479 | 479 | 6.58% | 6.99% | 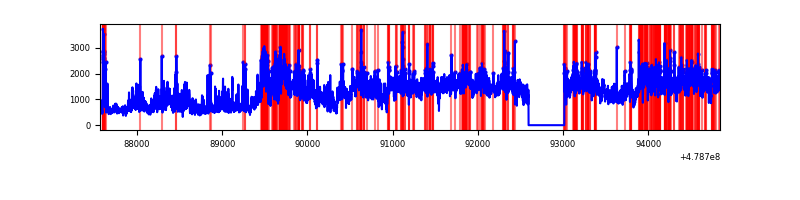 |
| B | 7275 | 6856 | 151 | 151 | 2.08% | 2.20% | 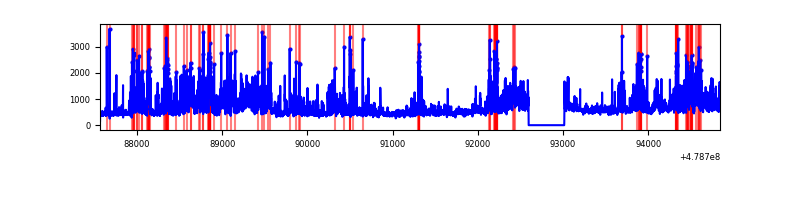 |
| C | 7276 | 6857 | 1958 | 1958 | 26.91% | 28.55% | 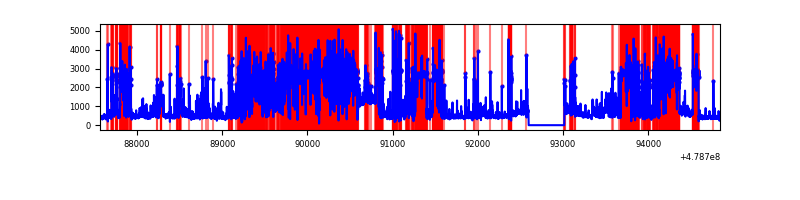 |
| D | 7276 | 6857 | 294 | 294 | 4.04% | 4.29% | 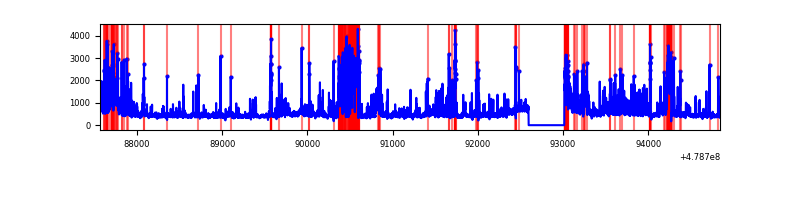 |
Top three noisy pixels from each quadrant. If the there are fewer than three noisy pixels in the level2.evt file, extra rows are filled as -1
| Pixel properties | Quadrant properties | ||||||
|---|---|---|---|---|---|---|---|
| Quadrant | DetID | PixID | Counts | Sigma | Mean | Median | Sigma |
| A | 4 | 4 | 3877875 | 22367.47 | 697 | 680 | 173.3 |
| A | 12 | 3 | 1439894 | 8302.8 | 697 | 680 | 173.3 |
| A | 10 | 253 | 358348 | 2063.38 | 697 | 680 | 173.3 |
| B | 4 | 171 | 587740 | 3944.79 | 703 | 680 | 148.8 |
| B | 4 | 81 | 546358 | 3666.72 | 703 | 680 | 148.8 |
| B | 0 | 172 | 319264 | 2140.74 | 703 | 680 | 148.8 |
| C | 15 | 1 | 4924338 | 31323.04 | 575 | 569 | 157.2 |
| C | 15 | 229 | 663591 | 4217.88 | 575 | 569 | 157.2 |
| C | 4 | 5 | 293719 | 1864.9 | 575 | 569 | 157.2 |
| D | 8 | 176 | 492421 | 2599.27 | 683 | 658 | 189.2 |
| D | 10 | 172 | 324088 | 1709.53 | 683 | 658 | 189.2 |
| D | 2 | 216 | 297650 | 1569.78 | 683 | 658 | 189.2 |
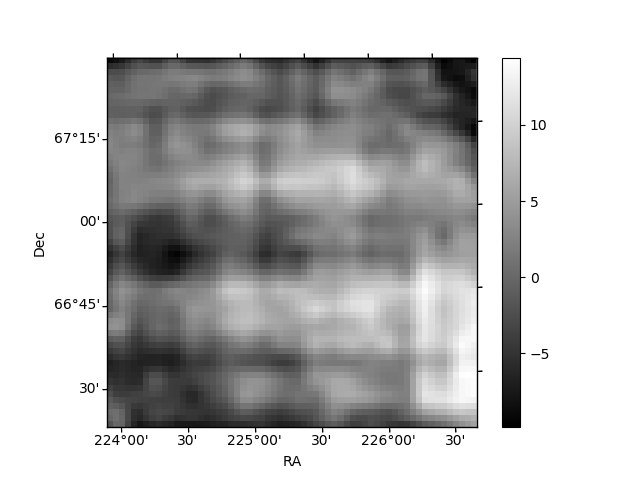
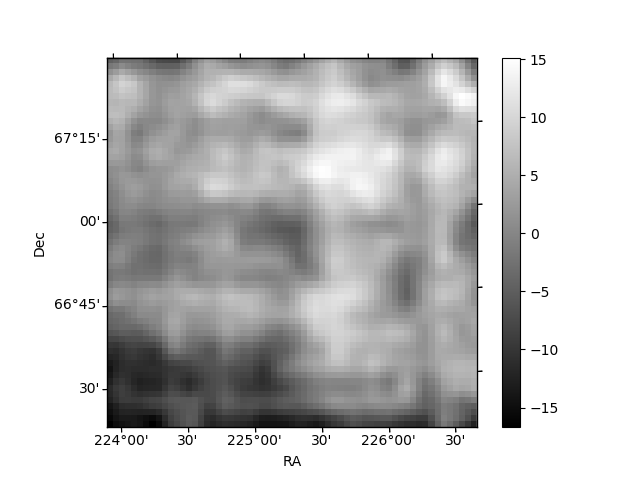
Histogram calculated using DETX and DETY for each event in the final _common_clean file
| Quadrant A | 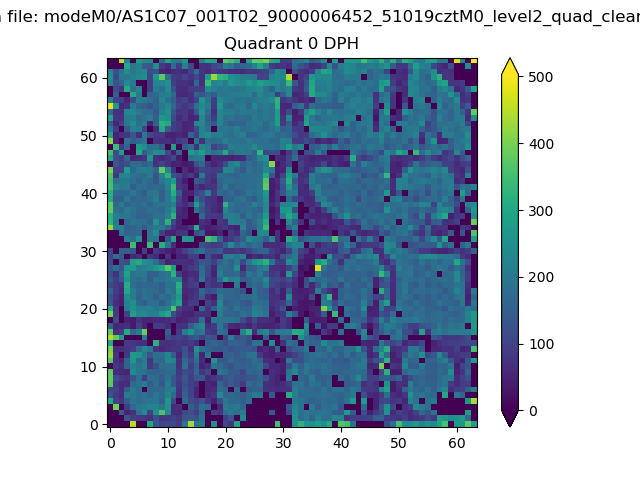 |
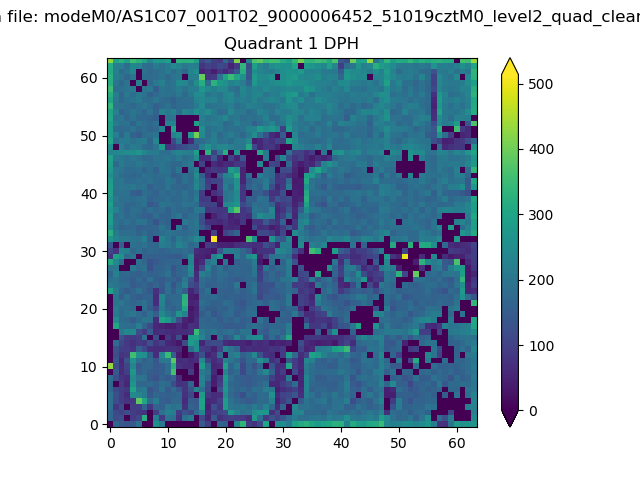 |
Quadrant B |
|---|---|---|---|
| Quadrant D | 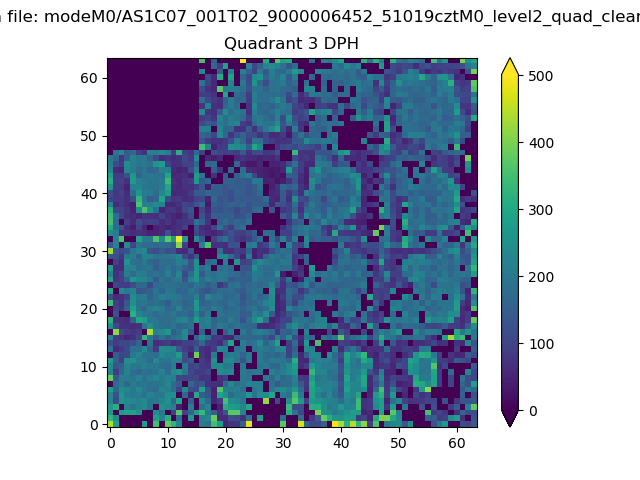 |
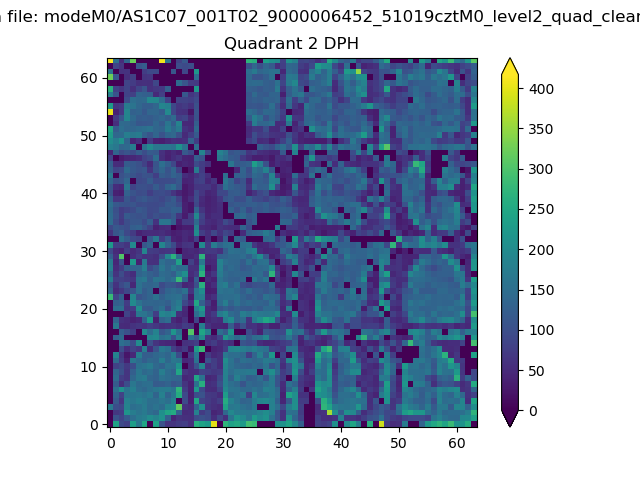 |
Quadrant C |
| Plot type | Count rate plots | Images |
|---|---|---|
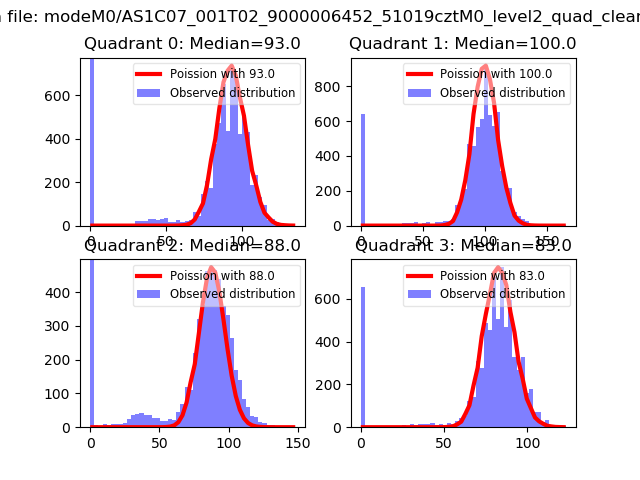
| Comparison with Poisson distribution Blue bars denote a histogram of data divided into 1 sec bins. Red curve is a Poisson curve with rate = median count rate of data. |
 |
 |
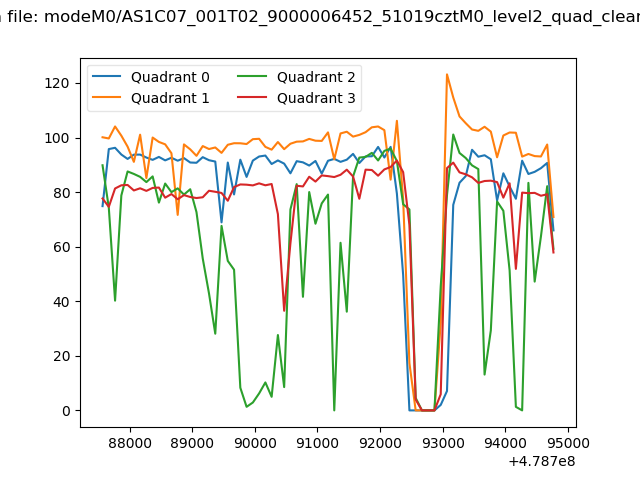
| Quadrant-wise count rates Data is divided into 100 sec bins |
 |
|
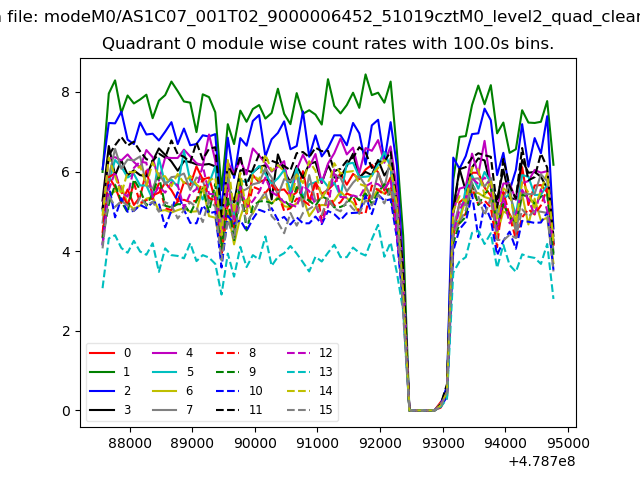
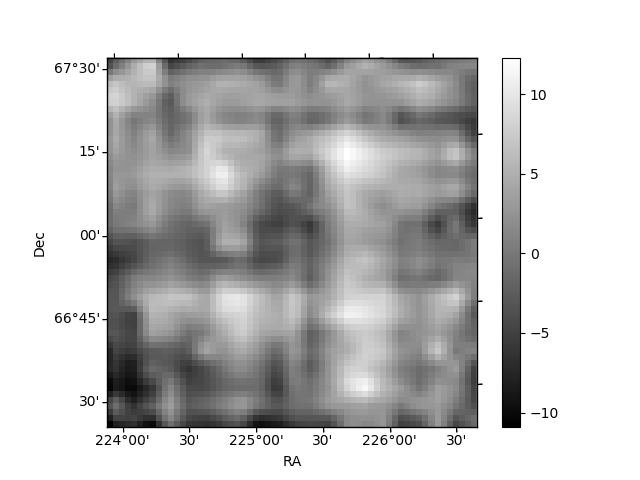
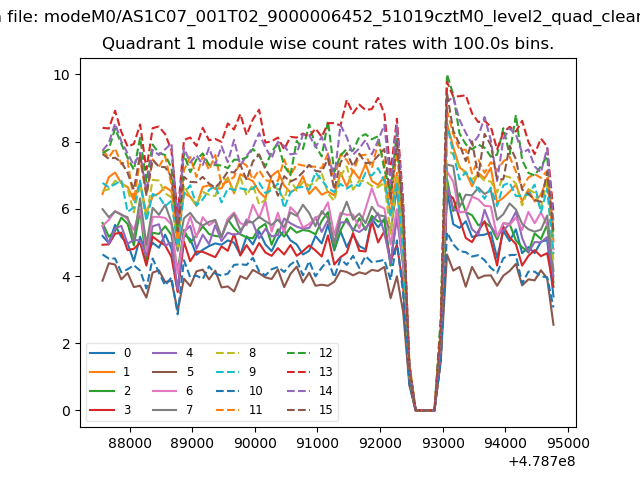
| Module-wise count rates for Quadrant A Data is divided into 100 sec bins |
 |
 |
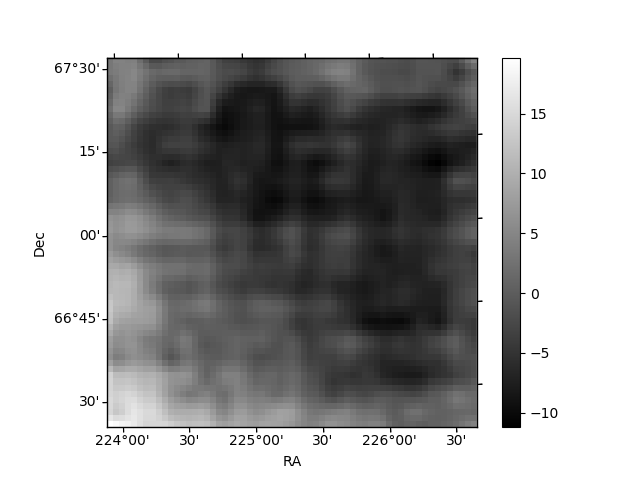
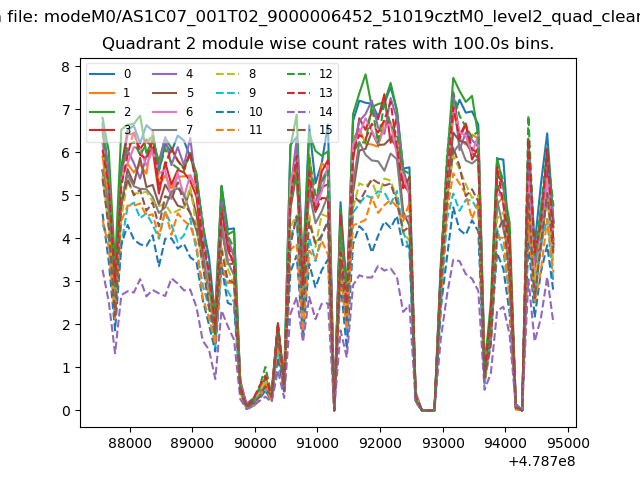
| Module-wise count rates for Quadrant B Data is divided into 100 sec bins |
 |
 |
| Module-wise count rates for Quadrant C Data is divided into 100 sec bins |
 |
 |
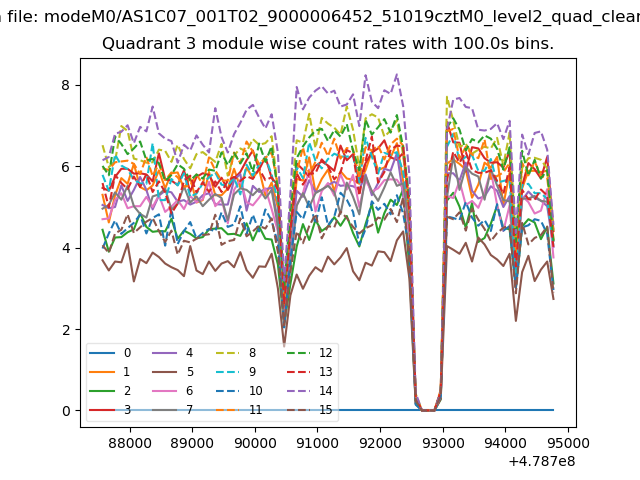
| Module-wise count rates for Quadrant D Data is divided into 100 sec bins |
 |
 |
| Parameter | Plot |
|---|---|
| CZT HV Monitor | 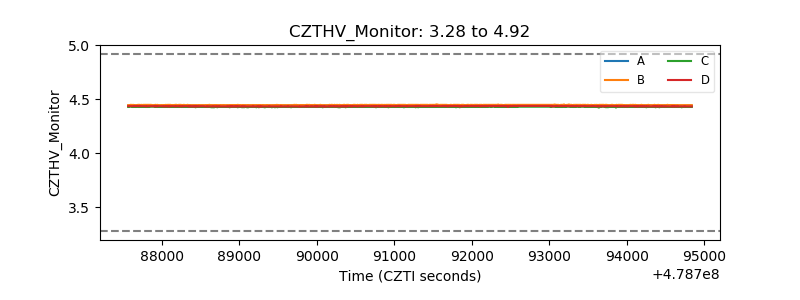 |
| D_VDD |  |
| Temperature 1 | 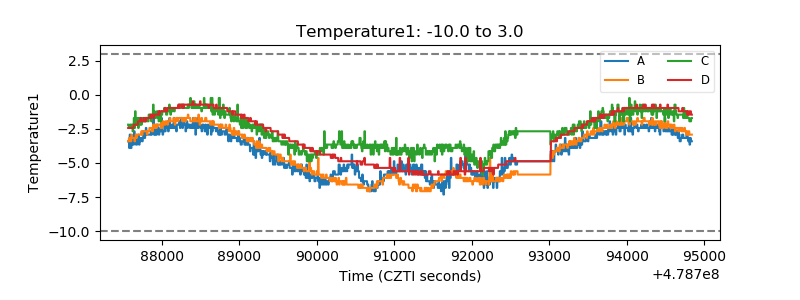 |
| Veto HV Monitor | 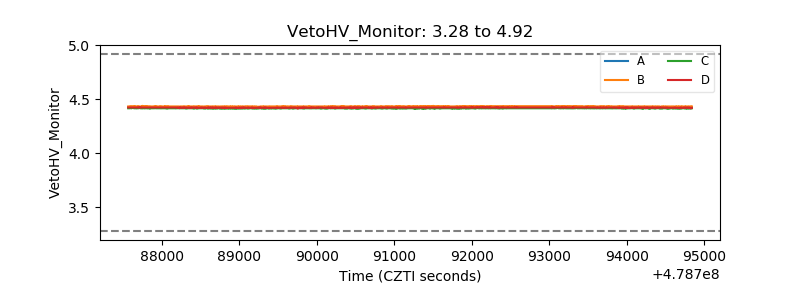 |
| Veto LLD | 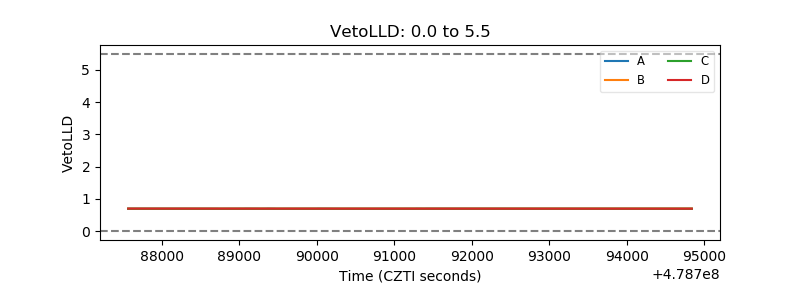 |
| Alpha Counter | 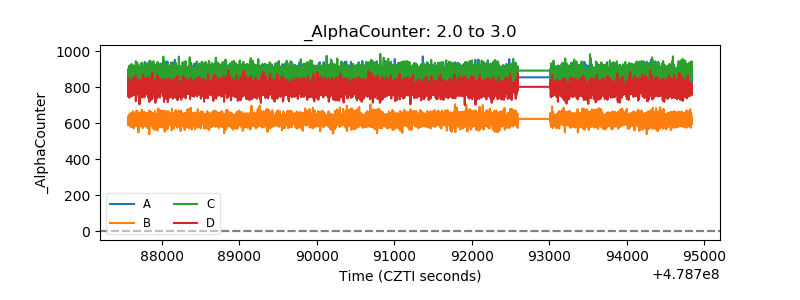 |
| _CPM_Rate | 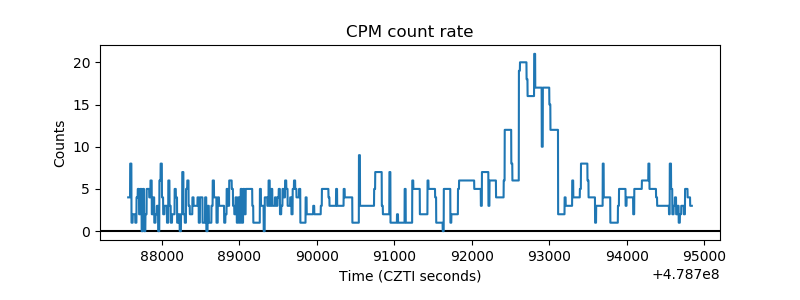 |
| CZT Counter | 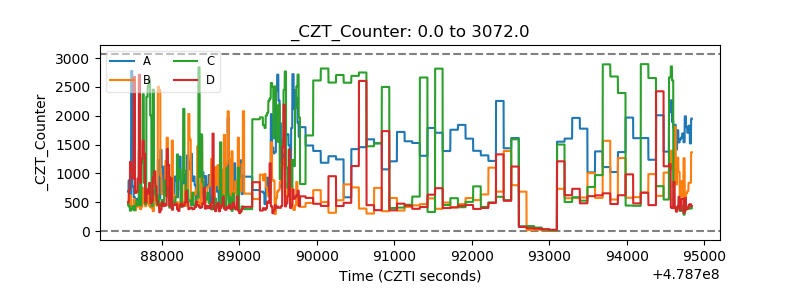 |
| +2.5 Volts monitor | 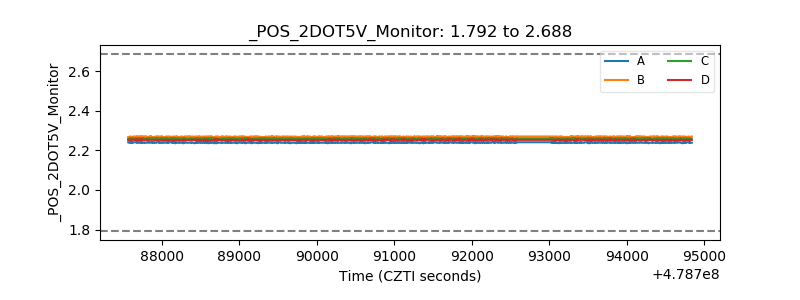 |
| +5 Volts monitor |  |
| _ROLL_ROT | 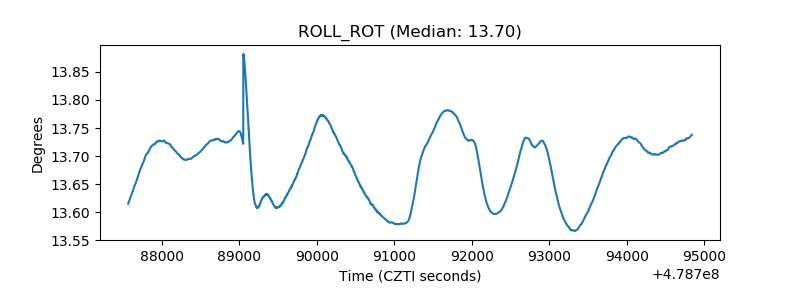 |
| _Roll_DEC | 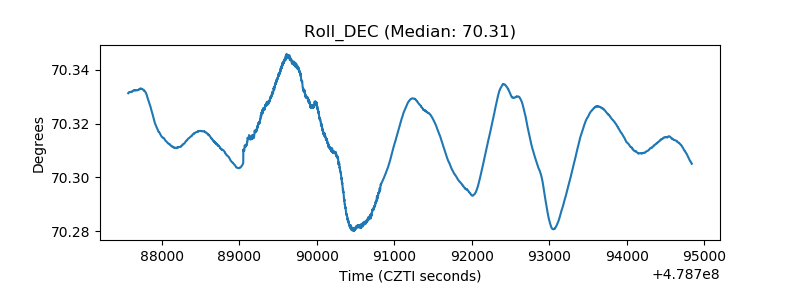 |
| _Roll_RA | 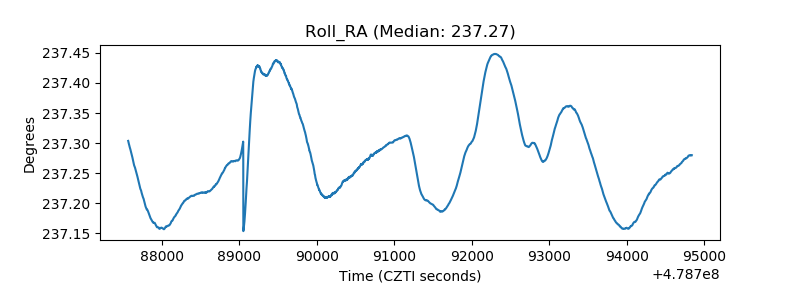 |
| Veto Counter | 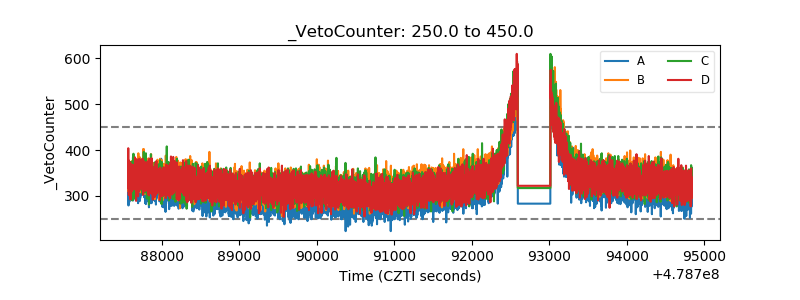 |