| Param | Original file | Final file |
|---|---|---|
| Filename | modeM0/AS1C07_001T02_9000006452_51020cztM0_level2.fits | modeM0/AS1C07_001T02_9000006452_51020cztM0_level2_quad_clean.evt |
| Size (bytes) | 588,778,560 | 97,064,640 |
| Size | 561.5 MB | 92.6 MB |
| Events in quadrant A | 6,528,411 | 626,077 |
| Events in quadrant B | 5,253,907 | 679,028 |
| Events in quadrant C | 4,554,189 | 588,005 |
| Events in quadrant D | 4,916,767 | 558,811 |
| Mode SS | |||
|---|---|---|---|
| Quadrant | BADHDUFLAG | Total packets | Discarded packets |
| A | 0 | 140 | 0 |
| B | 0 | 140 | 0 |
| C | 0 | 140 | 0 |
| D | 0 | 140 | 0 |
| Mode M0 | |||
|---|---|---|---|
| Quadrant | BADHDUFLAG | Total packets | Discarded packets |
| A | 0 | 24289 | 0 |
| B | 0 | 20498 | 0 |
| C | 0 | 18694 | 0 |
| D | 0 | 19687 | 0 |
| Quadrant | Total seconds | Saturated seconds | Saturation percentage |
|---|---|---|---|
| A | 6989 | 452 | 6.467306% |
| B | 6989 | 396 | 5.666047% |
| C | 6988 | 424 | 6.067544% |
| D | 6988 | 406 | 5.809960% |
Noise dominated data is calculated using 1-second bins in cleaned event files. If a bin has >2000 counts, and if more than 50% of those come from <1% of pixels, then it is considered to be noise-dominated and hence unusable.
| Quadrant | # 1 sec bins | Bins with >0 counts | Bins with >2000 counts | High rate bins dominated by noise | Noise dominated (total time) | Noise dominated (detector-on time) | Marked lightcurve |
|---|---|---|---|---|---|---|---|
| A | 6989 | 6989 | 341 | 341 | 4.88% | 4.88% | 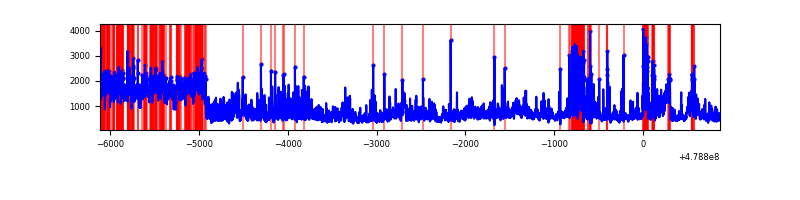 |
| B | 6989 | 6989 | 258 | 258 | 3.69% | 3.69% | 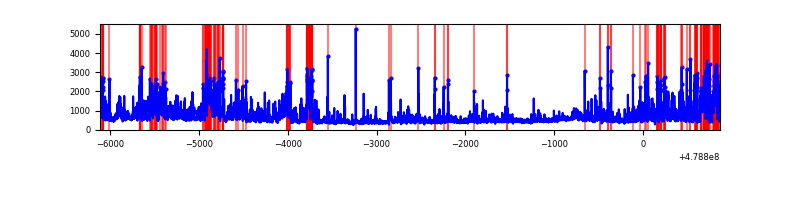 |
| C | 6988 | 6988 | 370 | 370 | 5.29% | 5.29% | 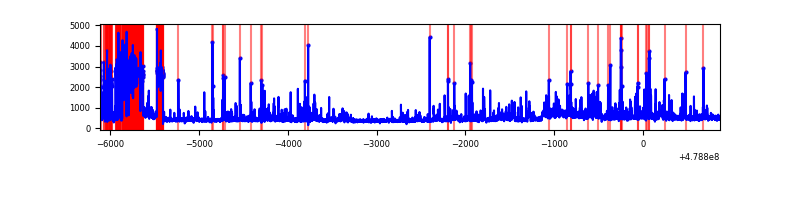 |
| D | 6988 | 6988 | 356 | 356 | 5.09% | 5.09% | 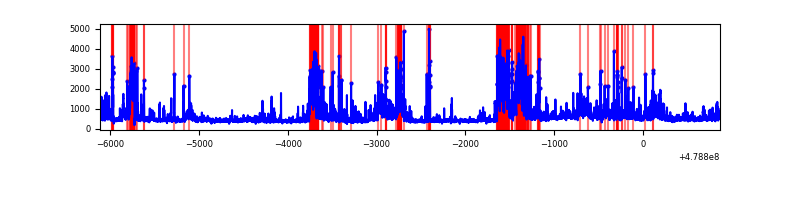 |
Top three noisy pixels from each quadrant. If the there are fewer than three noisy pixels in the level2.evt file, extra rows are filled as -1
| Pixel properties | Quadrant properties | ||||||
|---|---|---|---|---|---|---|---|
| Quadrant | DetID | PixID | Counts | Sigma | Mean | Median | Sigma |
| A | 12 | 3 | 1177865 | 6638.3 | 714 | 697 | 177.3 |
| A | 4 | 4 | 1097688 | 6186.16 | 714 | 697 | 177.3 |
| A | 14 | 254 | 272668 | 1533.7 | 714 | 697 | 177.3 |
| B | 4 | 81 | 1299465 | 8506.54 | 714 | 690 | 152.7 |
| B | 4 | 171 | 373764 | 2443.51 | 714 | 690 | 152.7 |
| B | 0 | 172 | 190327 | 1242.06 | 714 | 690 | 152.7 |
| C | 15 | 1 | 944100 | 5045.06 | 687 | 680 | 187.0 |
| C | 9 | 38 | 183495 | 977.63 | 687 | 680 | 187.0 |
| C | 13 | 3 | 135876 | 722.98 | 687 | 680 | 187.0 |
| D | 8 | 176 | 990371 | 5177.77 | 690 | 664 | 191.1 |
| D | 3 | 12 | 279512 | 1458.83 | 690 | 664 | 191.1 |
| D | 10 | 172 | 174283 | 908.31 | 690 | 664 | 191.1 |
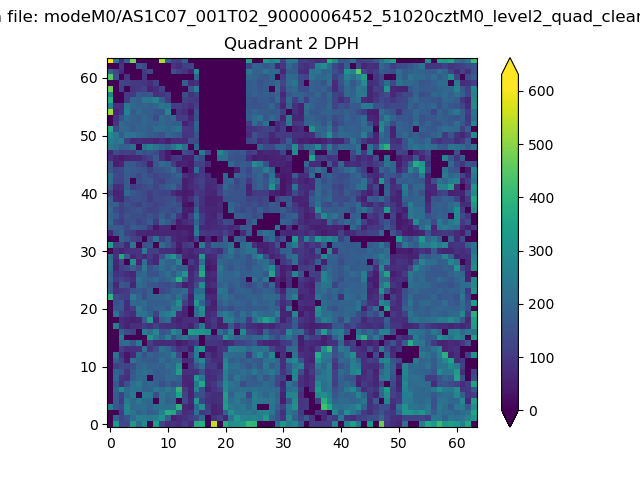
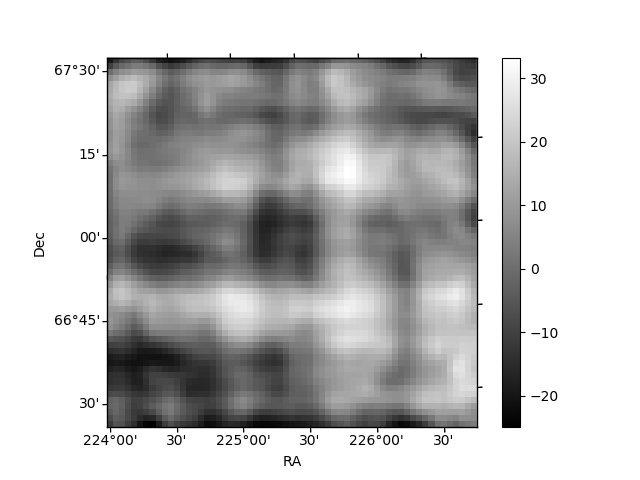
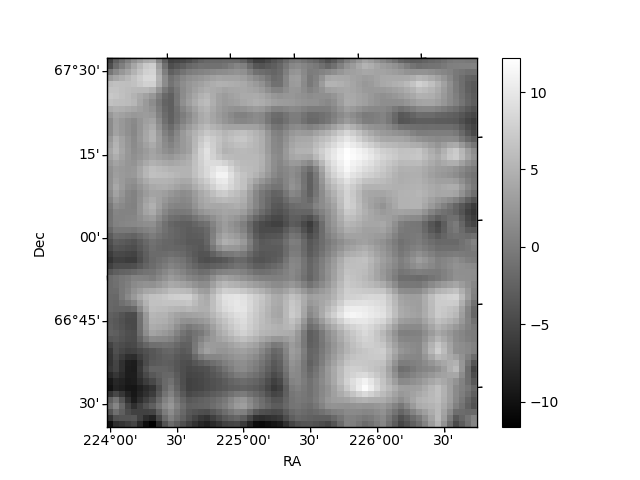
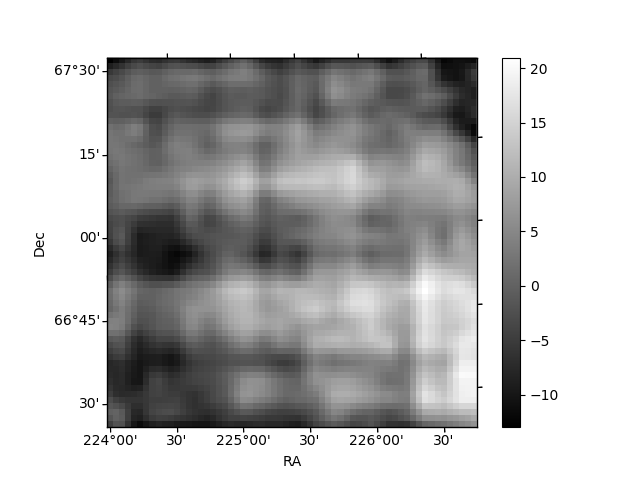
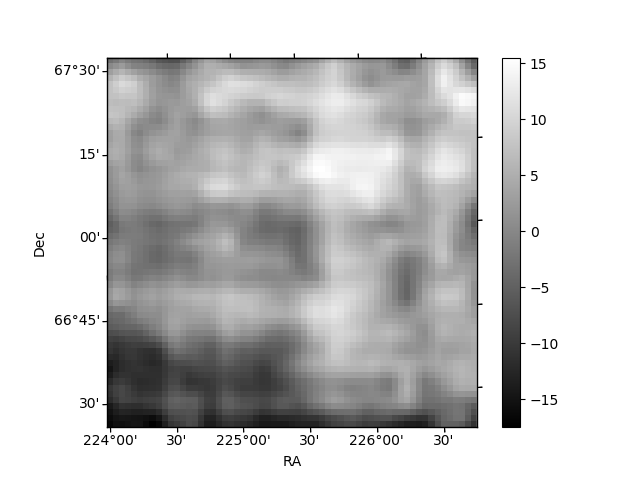
Histogram calculated using DETX and DETY for each event in the final _common_clean file
| Quadrant A | 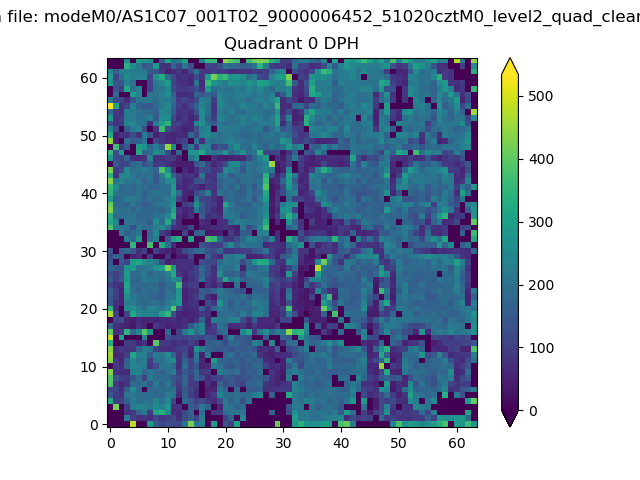 |
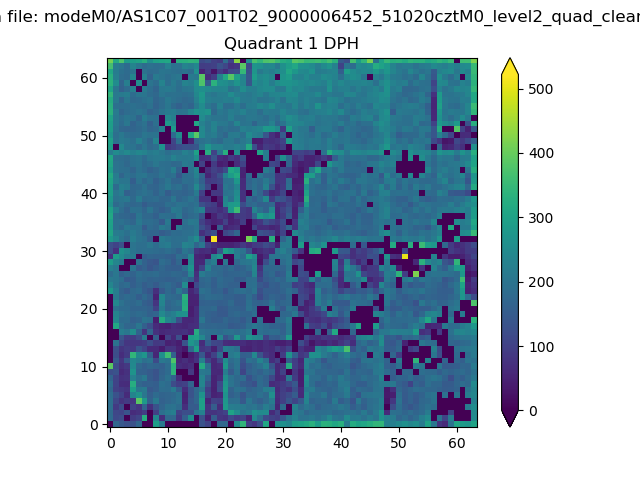 |
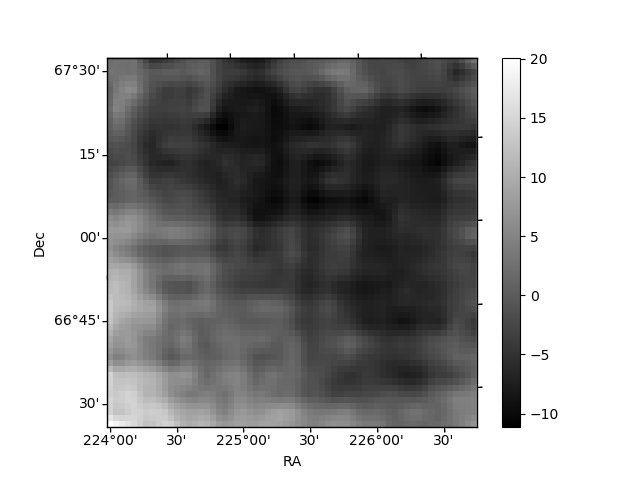
Quadrant B |
|---|---|---|---|
| Quadrant D | 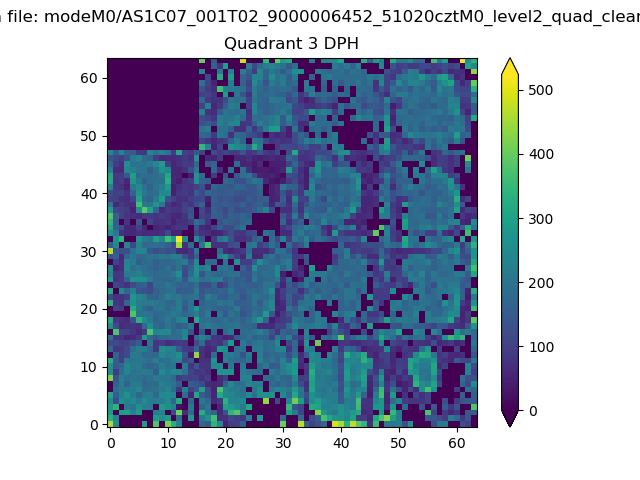 |
 |
Quadrant C |
| Plot type | Count rate plots | Images |
|---|---|---|
| Comparison with Poisson distribution Blue bars denote a histogram of data divided into 1 sec bins. Red curve is a Poisson curve with rate = median count rate of data. |
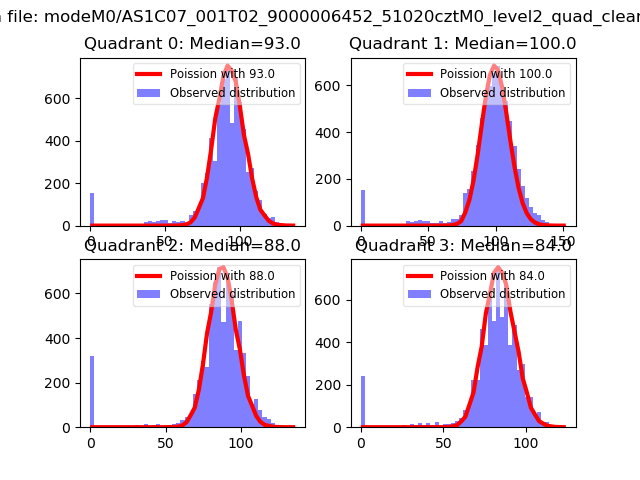 |
 |
| Quadrant-wise count rates Data is divided into 100 sec bins |
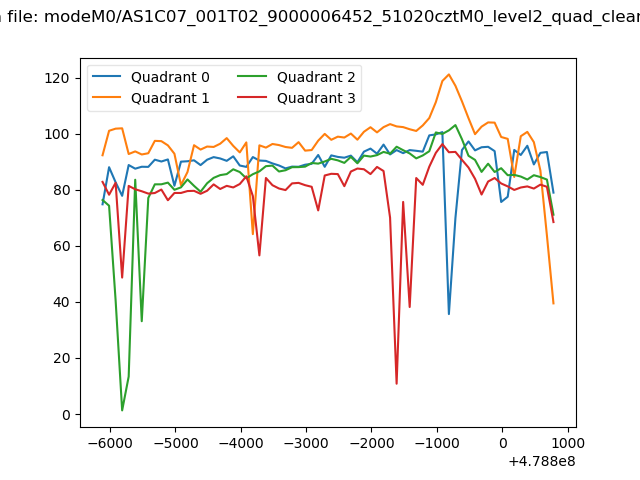 |
|
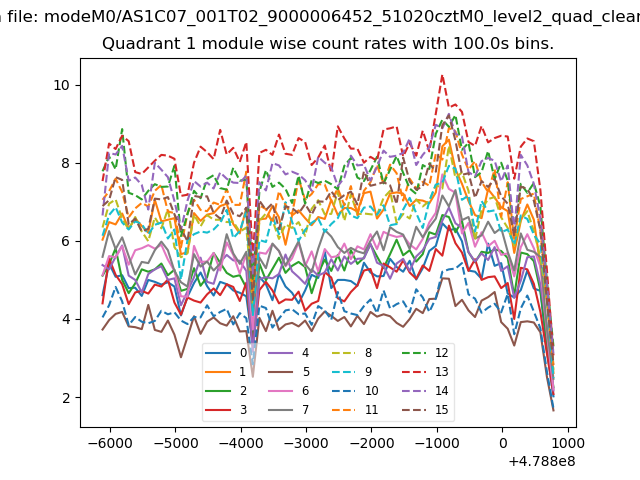
| Module-wise count rates for Quadrant A Data is divided into 100 sec bins |
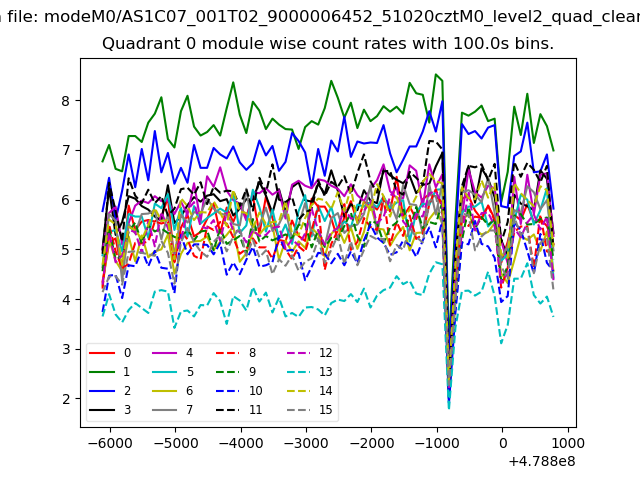 |
 |
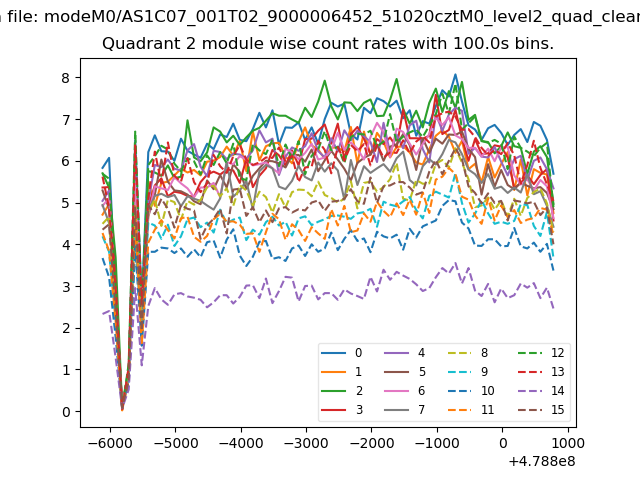
| Module-wise count rates for Quadrant B Data is divided into 100 sec bins |
 |
 |
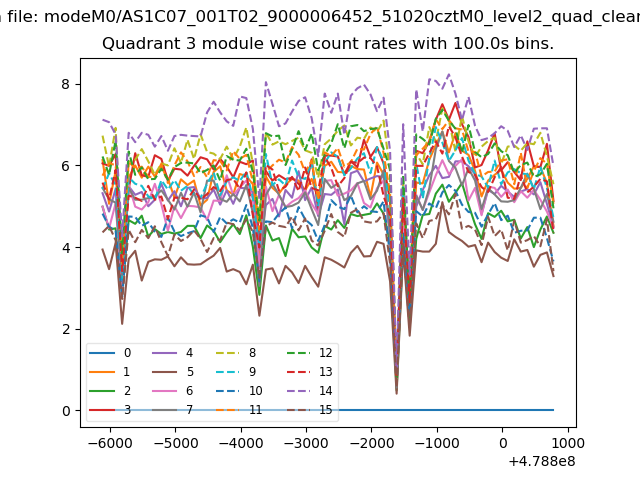
| Module-wise count rates for Quadrant C Data is divided into 100 sec bins |
 |
 |
| Module-wise count rates for Quadrant D Data is divided into 100 sec bins |
 |
 |
| Parameter | Plot |
|---|---|
| CZT HV Monitor |  |
| D_VDD | 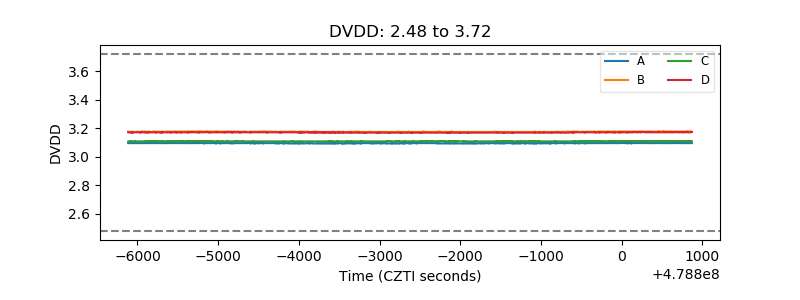 |
| Temperature 1 | 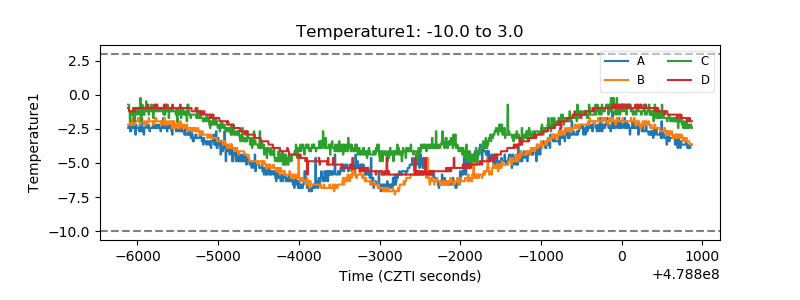 |
| Veto HV Monitor | 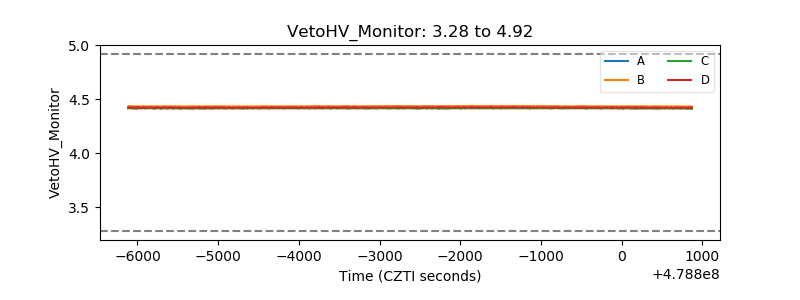 |
| Veto LLD | 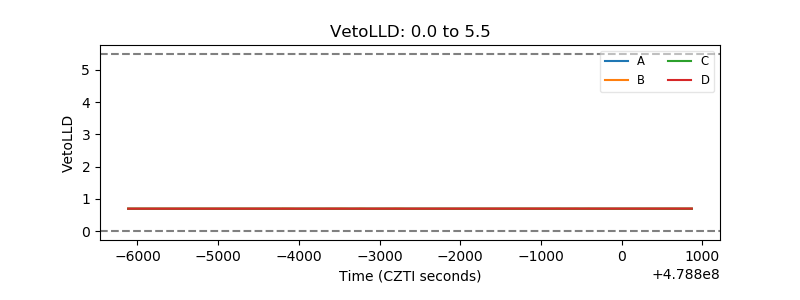 |
| Alpha Counter | 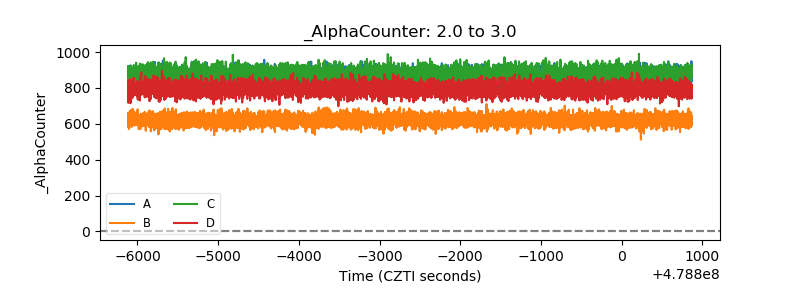 |
| _CPM_Rate | 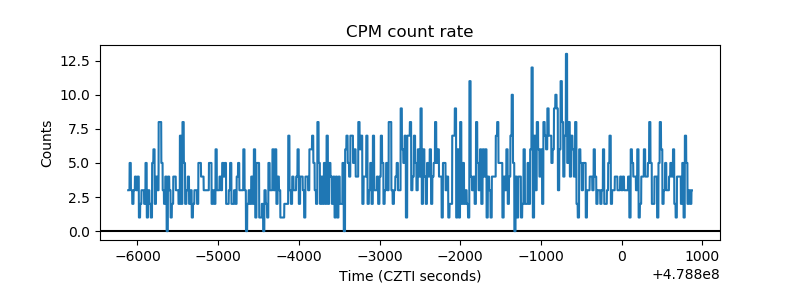 |
| CZT Counter | 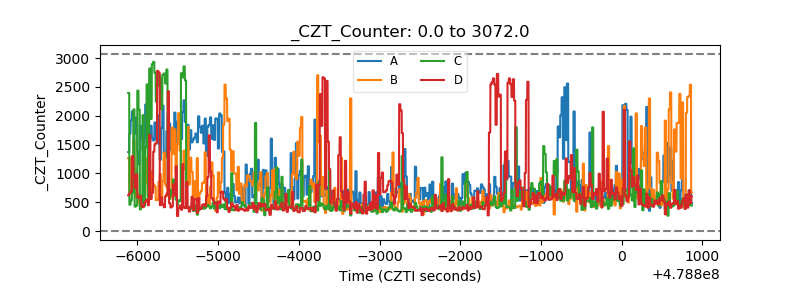 |
| +2.5 Volts monitor | 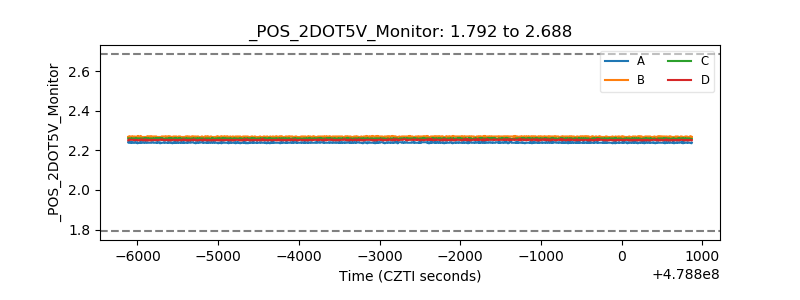 |
| +5 Volts monitor | 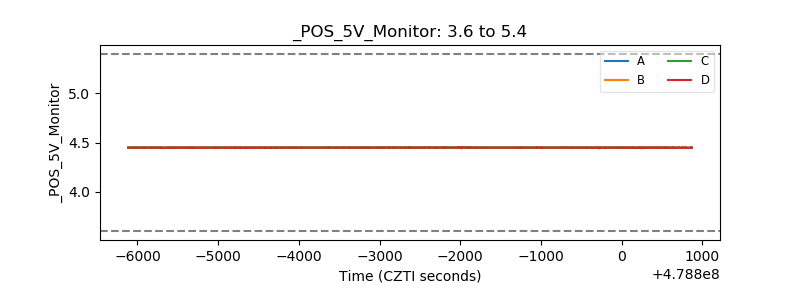 |
| _ROLL_ROT | 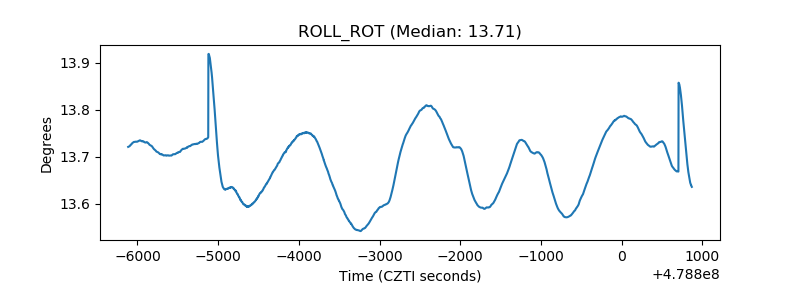 |
| _Roll_DEC | 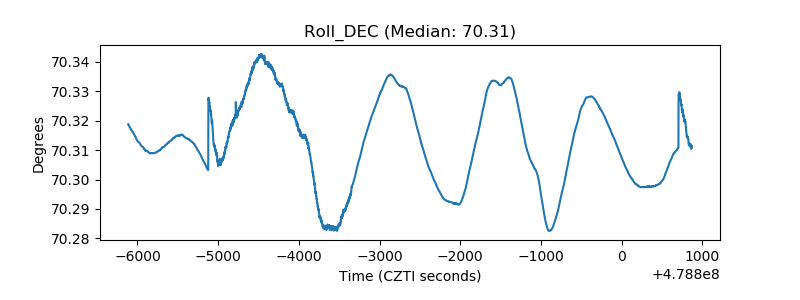 |
| _Roll_RA | 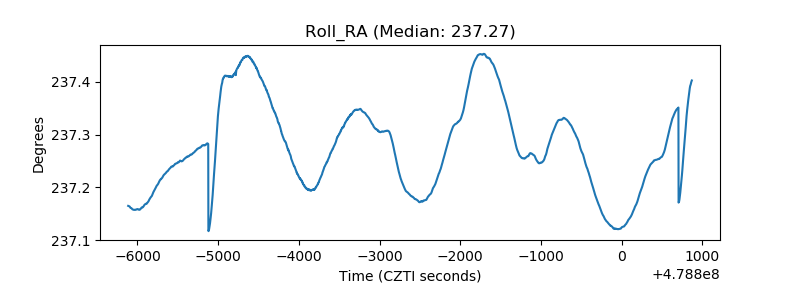 |
| Veto Counter | 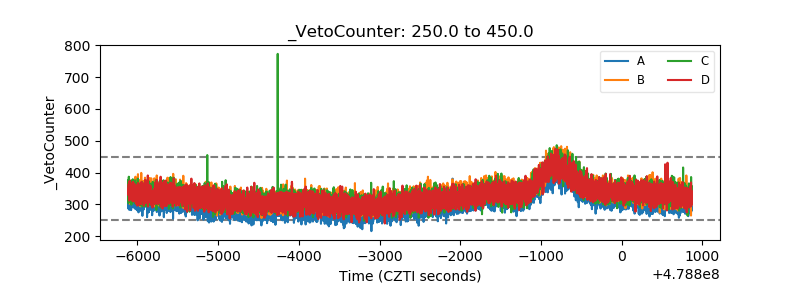 |