| Param | Original file | Final file |
|---|---|---|
| Filename | modeM0/AS1C07_001T02_9000006452_51021cztM0_level2.fits | modeM0/AS1C07_001T02_9000006452_51021cztM0_level2_quad_clean.evt |
| Size (bytes) | 710,688,960 | 101,957,760 |
| Size | 677.8 MB | 97.2 MB |
| Events in quadrant A | 6,980,139 | 673,976 |
| Events in quadrant B | 4,878,150 | 736,864 |
| Events in quadrant C | 8,396,267 | 541,871 |
| Events in quadrant D | 5,471,500 | 611,418 |
| Mode SS | |||
|---|---|---|---|
| Quadrant | BADHDUFLAG | Total packets | Discarded packets |
| A | 0 | 150 | 0 |
| B | 0 | 150 | 0 |
| C | 0 | 150 | 0 |
| D | 0 | 150 | 0 |
| Mode M0 | |||
|---|---|---|---|
| Quadrant | BADHDUFLAG | Total packets | Discarded packets |
| A | 0 | 25917 | 0 |
| B | 0 | 19802 | 0 |
| C | 0 | 29949 | 0 |
| D | 0 | 21482 | 0 |
| Quadrant | Total seconds | Saturated seconds | Saturation percentage |
|---|---|---|---|
| A | 7514 | 450 | 5.988821% |
| B | 7514 | 297 | 3.952622% |
| C | 7515 | 1550 | 20.625416% |
| D | 7515 | 279 | 3.712575% |
Noise dominated data is calculated using 1-second bins in cleaned event files. If a bin has >2000 counts, and if more than 50% of those come from <1% of pixels, then it is considered to be noise-dominated and hence unusable.
| Quadrant | # 1 sec bins | Bins with >0 counts | Bins with >2000 counts | High rate bins dominated by noise | Noise dominated (total time) | Noise dominated (detector-on time) | Marked lightcurve |
|---|---|---|---|---|---|---|---|
| A | 7514 | 7514 | 381 | 381 | 5.07% | 5.07% | 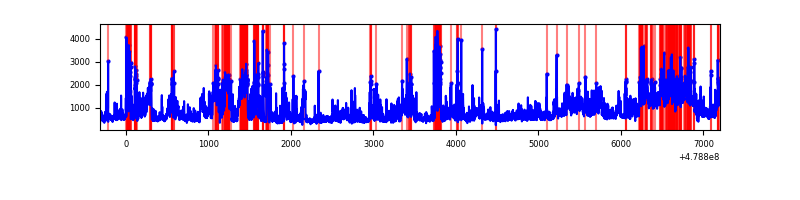 |
| B | 7514 | 7514 | 199 | 199 | 2.65% | 2.65% | 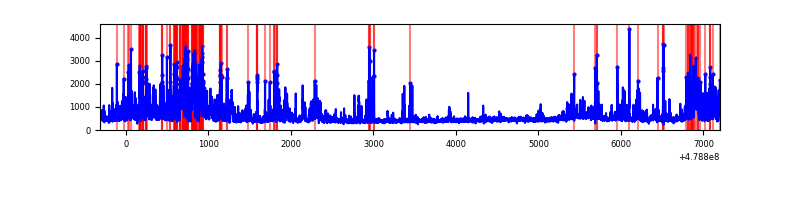 |
| C | 7515 | 7515 | 1421 | 1421 | 18.91% | 18.91% | 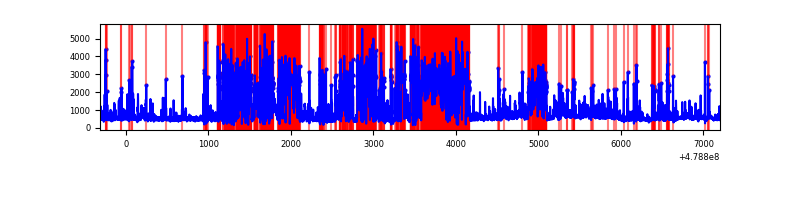 |
| D | 7515 | 7515 | 237 | 237 | 3.15% | 3.15% | 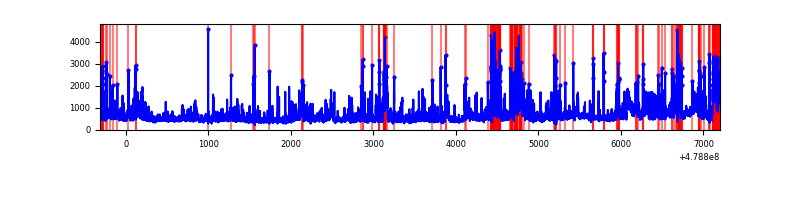 |
Top three noisy pixels from each quadrant. If the there are fewer than three noisy pixels in the level2.evt file, extra rows are filled as -1
| Pixel properties | Quadrant properties | ||||||
|---|---|---|---|---|---|---|---|
| Quadrant | DetID | PixID | Counts | Sigma | Mean | Median | Sigma |
| A | 12 | 80 | 1799877 | 9348.03 | 774 | 758 | 192.5 |
| A | 12 | 3 | 394563 | 2046.17 | 774 | 758 | 192.5 |
| A | 4 | 4 | 365229 | 1893.75 | 774 | 758 | 192.5 |
| B | 4 | 81 | 1103296 | 6708.02 | 771 | 747 | 164.4 |
| B | 4 | 171 | 148183 | 897.02 | 771 | 747 | 164.4 |
| B | 4 | 206 | 112375 | 679.16 | 771 | 747 | 164.4 |
| C | 15 | 1 | 3579588 | 18938.89 | 681 | 674 | 189.0 |
| C | 12 | 252 | 346693 | 1831.06 | 681 | 674 | 189.0 |
| C | 9 | 38 | 244442 | 1289.97 | 681 | 674 | 189.0 |
| D | 3 | 12 | 670936 | 3198.42 | 754 | 728 | 209.5 |
| D | 8 | 176 | 270621 | 1288.01 | 754 | 728 | 209.5 |
| D | 12 | 191 | 247429 | 1177.33 | 754 | 728 | 209.5 |
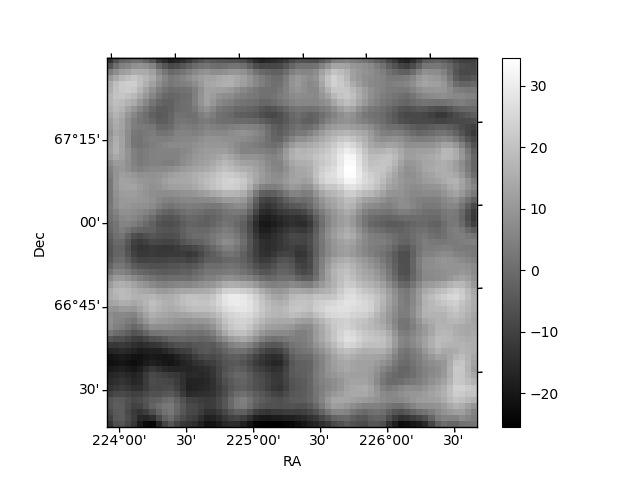
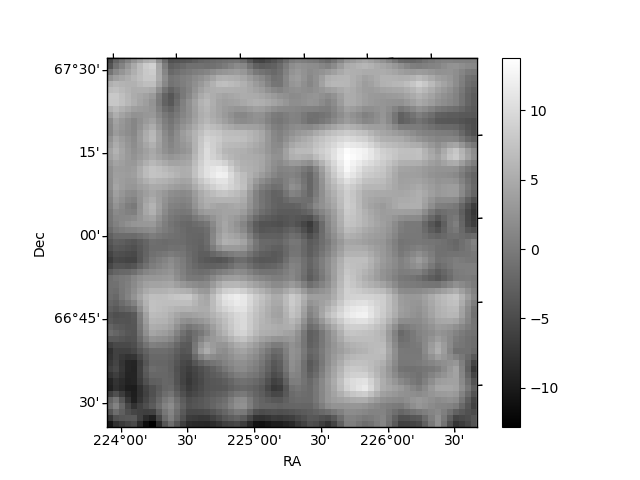
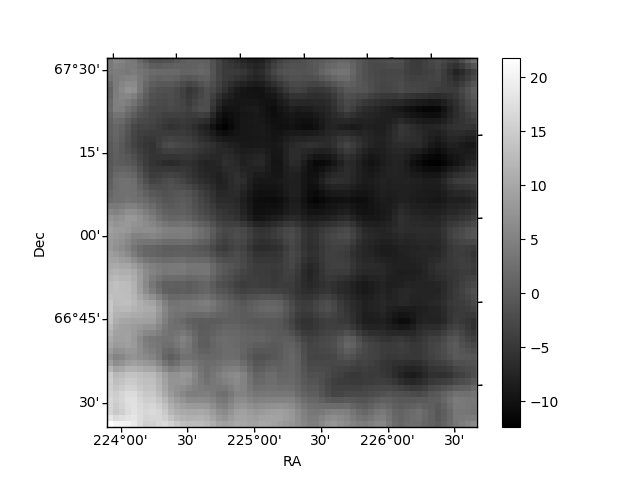
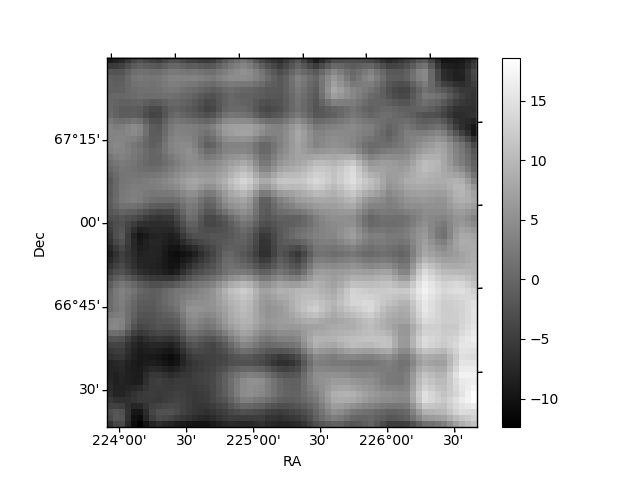
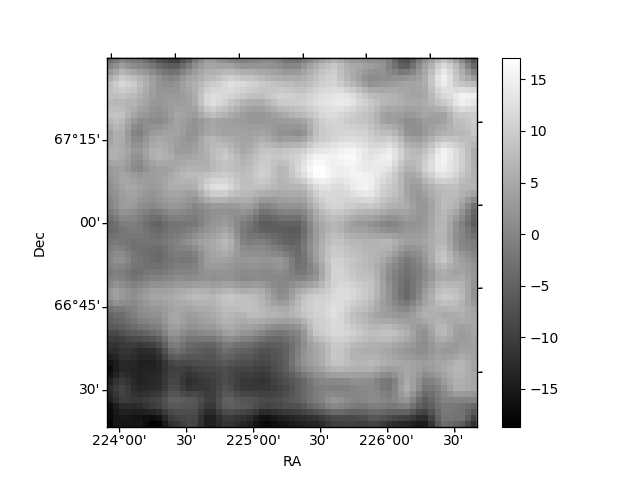
Histogram calculated using DETX and DETY for each event in the final _common_clean file
| Quadrant A | 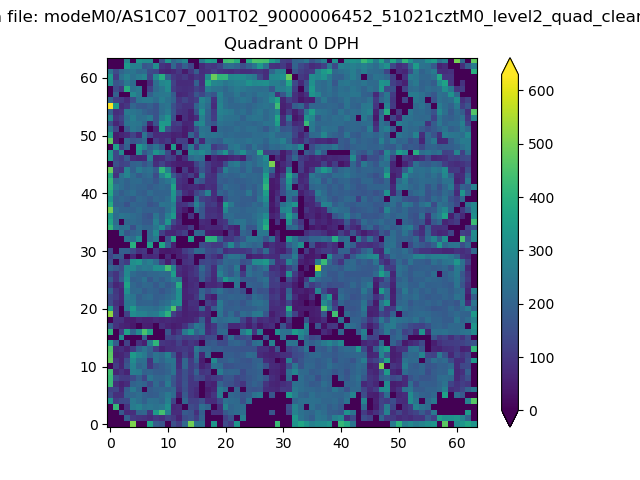 |
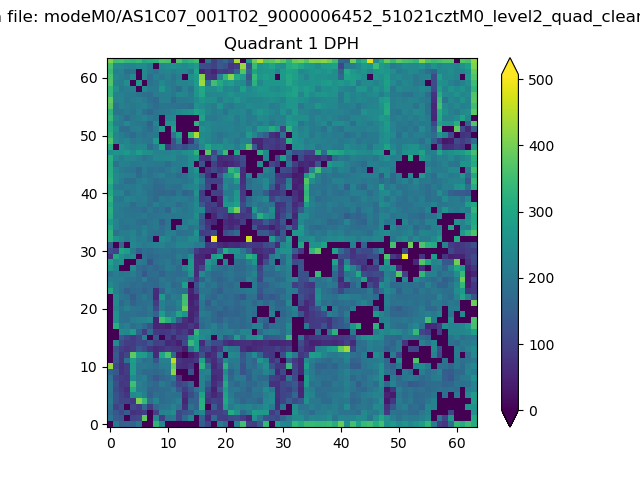 |
Quadrant B |
|---|---|---|---|
| Quadrant D | 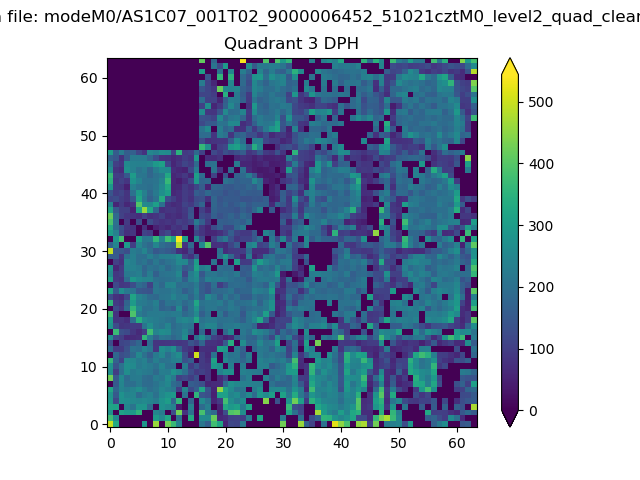 |
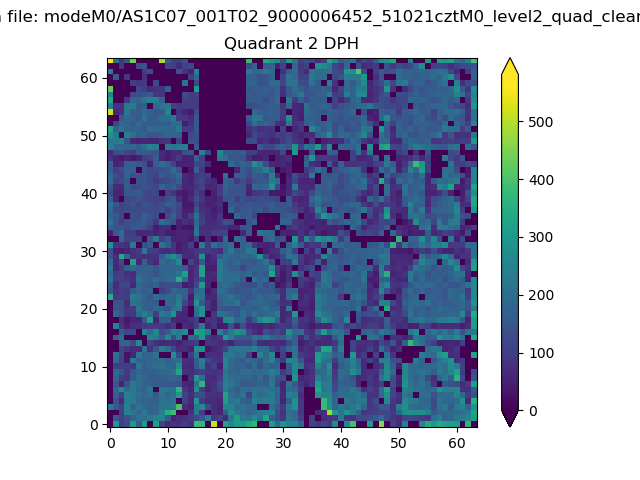 |
Quadrant C |
| Plot type | Count rate plots | Images |
|---|---|---|
| Comparison with Poisson distribution Blue bars denote a histogram of data divided into 1 sec bins. Red curve is a Poisson curve with rate = median count rate of data. |
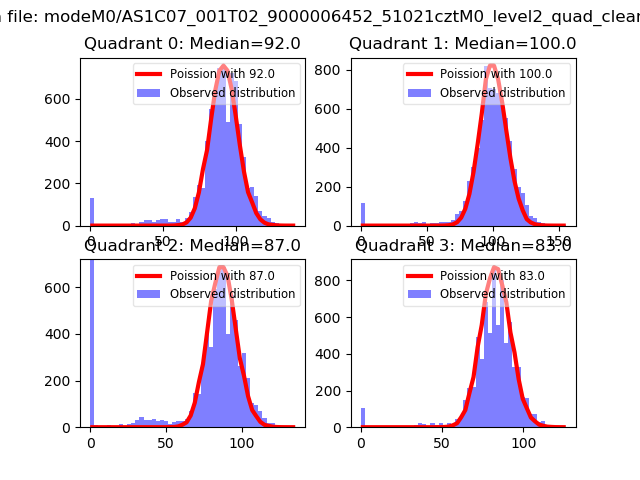 |
 |
| Quadrant-wise count rates Data is divided into 100 sec bins |
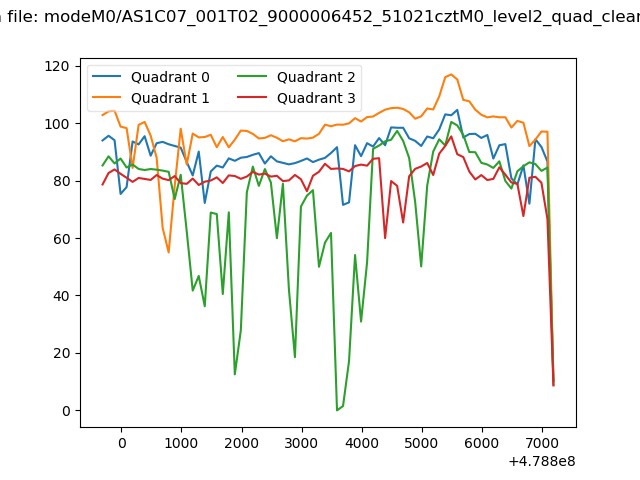 |
|
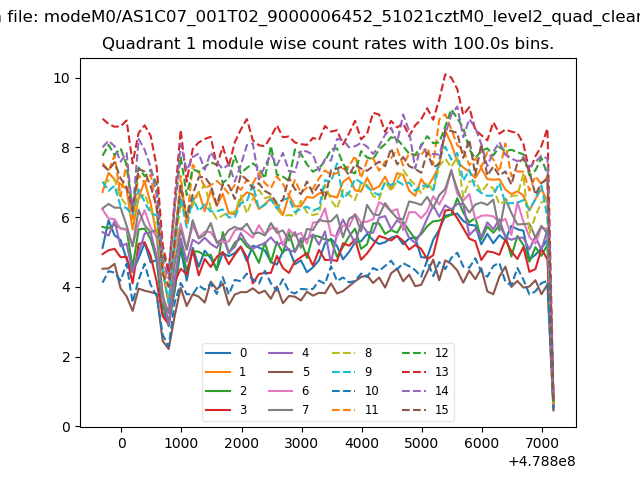
| Module-wise count rates for Quadrant A Data is divided into 100 sec bins |
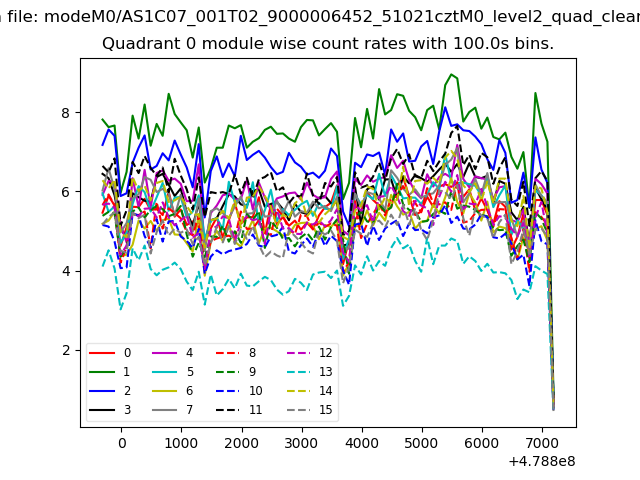 |
 |
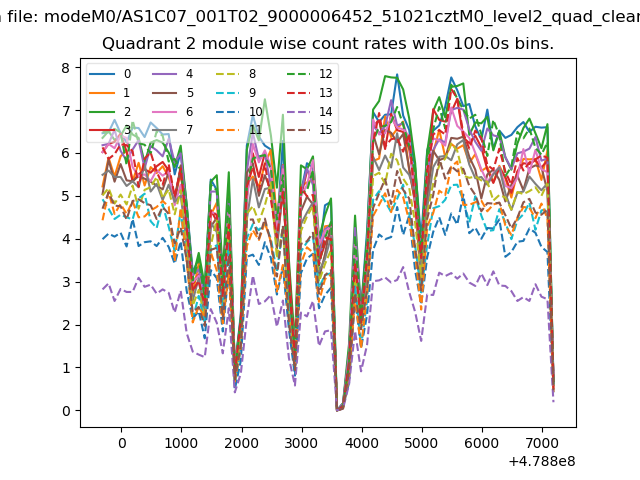
| Module-wise count rates for Quadrant B Data is divided into 100 sec bins |
 |
 |
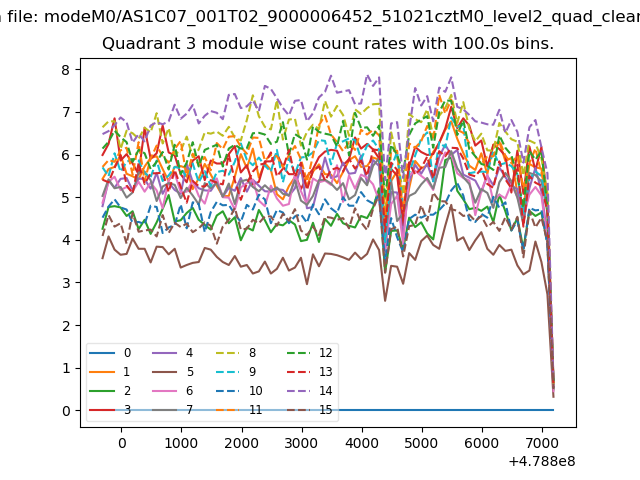
| Module-wise count rates for Quadrant C Data is divided into 100 sec bins |
 |
 |
| Module-wise count rates for Quadrant D Data is divided into 100 sec bins |
 |
 |
| Parameter | Plot |
|---|---|
| CZT HV Monitor | 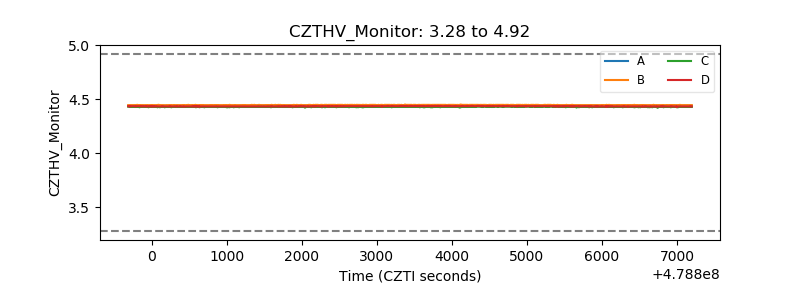 |
| D_VDD | 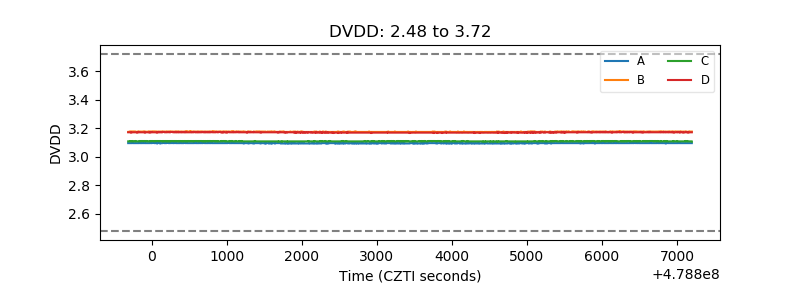 |
| Temperature 1 | 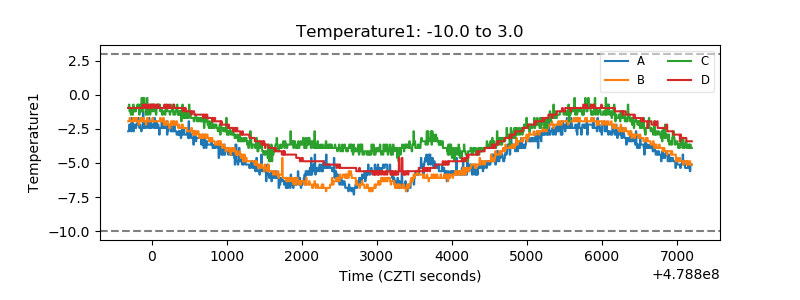 |
| Veto HV Monitor | 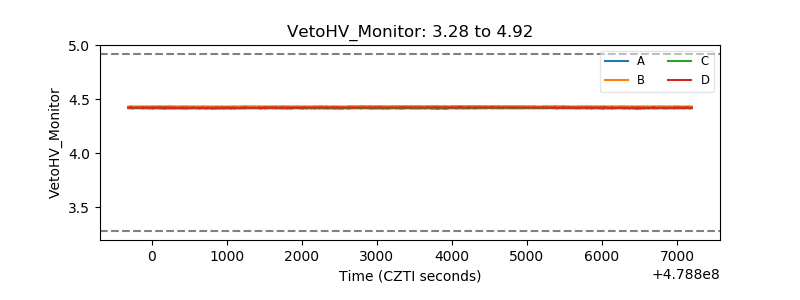 |
| Veto LLD | 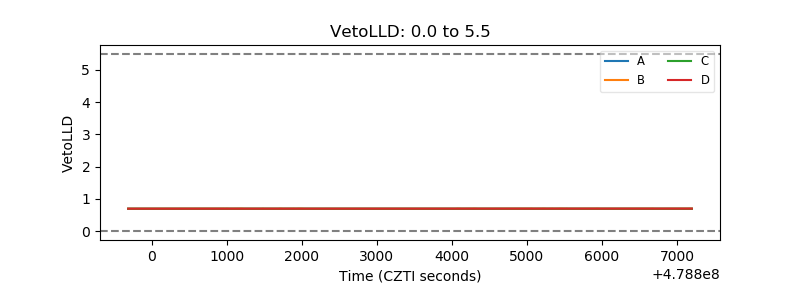 |
| Alpha Counter | 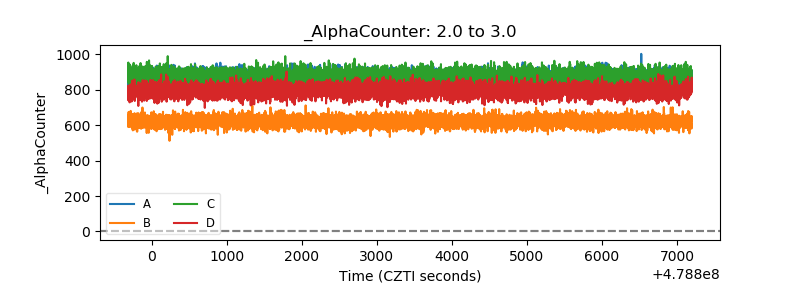 |
| _CPM_Rate | 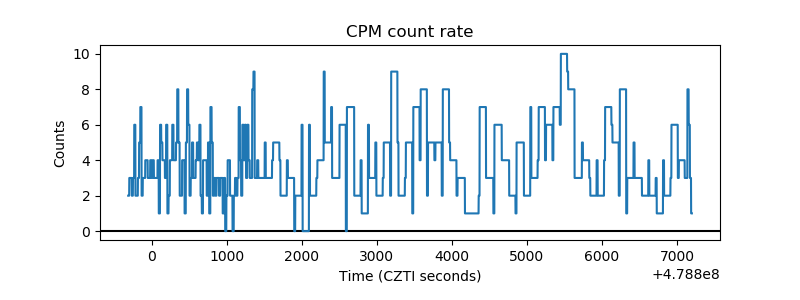 |
| CZT Counter | 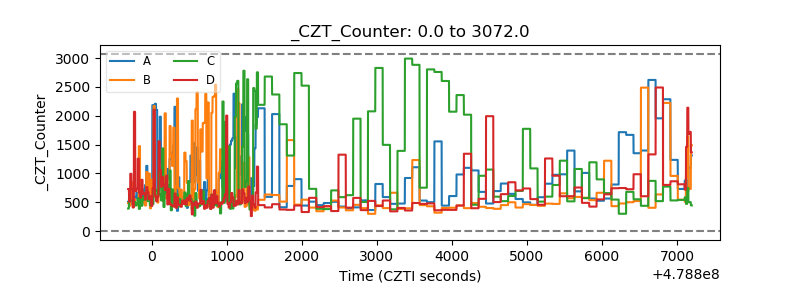 |
| +2.5 Volts monitor | 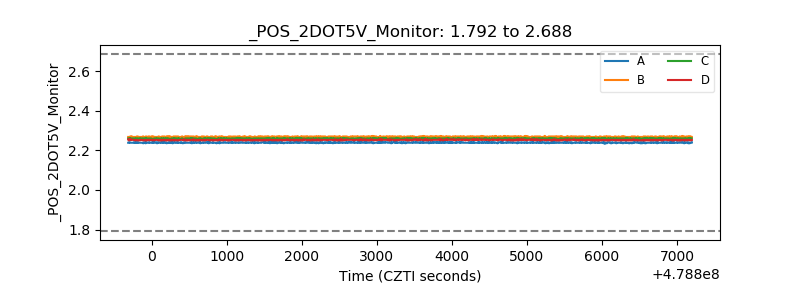 |
| +5 Volts monitor | 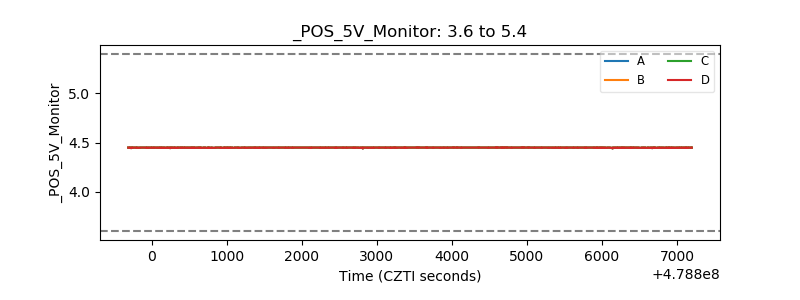 |
| _ROLL_ROT | 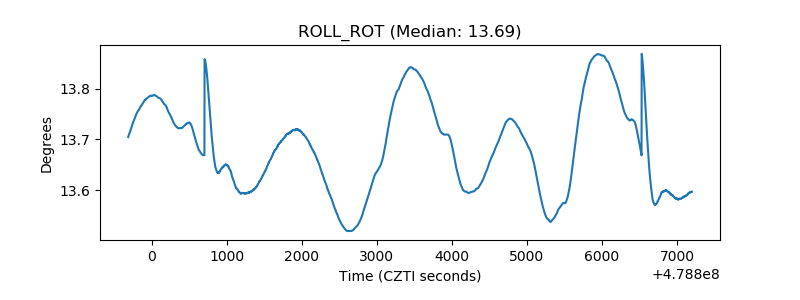 |
| _Roll_DEC | 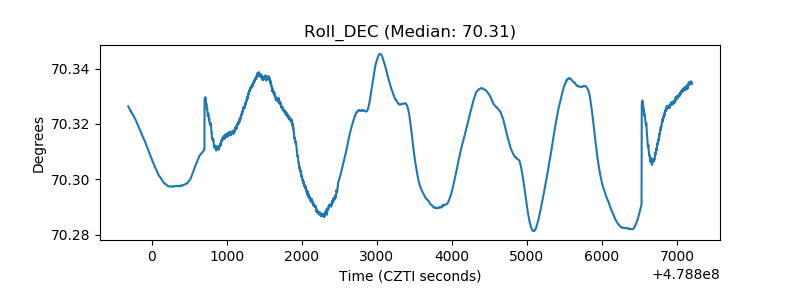 |
| _Roll_RA | 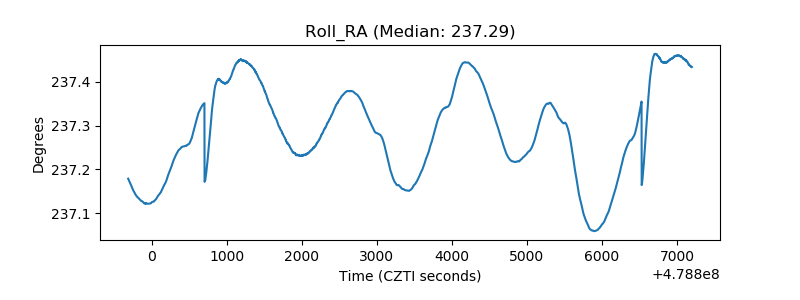 |
| Veto Counter |  |