| Param | Original file | Final file |
|---|---|---|
| Filename | modeM0/AS1C07_001T02_9000006452_51024cztM0_level2.fits | modeM0/AS1C07_001T02_9000006452_51024cztM0_level2_quad_clean.evt |
| Size (bytes) | 1,802,770,560 | 245,750,400 |
| Size | 1.7 GB | 234.4 MB |
| Events in quadrant A | 19,902,366 | 1,556,161 |
| Events in quadrant B | 13,878,175 | 1,771,495 |
| Events in quadrant C | 17,431,253 | 1,362,217 |
| Events in quadrant D | 14,069,201 | 1,451,198 |
| Mode SS | |||
|---|---|---|---|
| Quadrant | BADHDUFLAG | Total packets | Discarded packets |
| A | 0 | 382 | 0 |
| B | 0 | 382 | 0 |
| C | 0 | 382 | 0 |
| D | 0 | 382 | 0 |
| Mode M9 | |||
|---|---|---|---|
| Quadrant | BADHDUFLAG | Total packets | Discarded packets |
| A | 0 | 10 | 0 |
| B | 0 | 10 | 0 |
| C | 0 | 10 | 0 |
| D | 0 | 10 | 0 |
| Mode M0 | |||
|---|---|---|---|
| Quadrant | BADHDUFLAG | Total packets | Discarded packets |
| A | 0 | 72338 | 3 |
| B | 0 | 54521 | 3 |
| C | 0 | 64920 | 3 |
| D | 0 | 55377 | 3 |
| Quadrant | Total seconds | Saturated seconds | Saturation percentage |
|---|---|---|---|
| A | 18844 | 1973 | 10.470176% |
| B | 18844 | 1070 | 5.678200% |
| C | 18843 | 2824 | 14.986998% |
| D | 18843 | 1059 | 5.620124% |
Noise dominated data is calculated using 1-second bins in cleaned event files. If a bin has >2000 counts, and if more than 50% of those come from <1% of pixels, then it is considered to be noise-dominated and hence unusable.
| Quadrant | # 1 sec bins | Bins with >0 counts | Bins with >2000 counts | High rate bins dominated by noise | Noise dominated (total time) | Noise dominated (detector-on time) | Marked lightcurve |
|---|---|---|---|---|---|---|---|
| A | 19829 | 18847 | 1512 | 1512 | 7.63% | 8.02% | 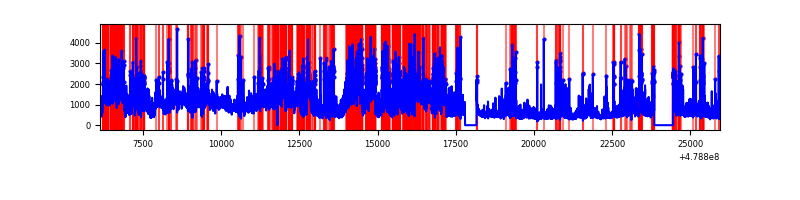 |
| B | 19829 | 18847 | 513 | 513 | 2.59% | 2.72% | 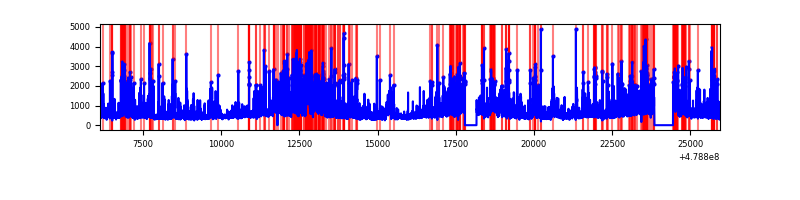 |
| C | 19828 | 18845 | 2551 | 2551 | 12.87% | 13.54% | 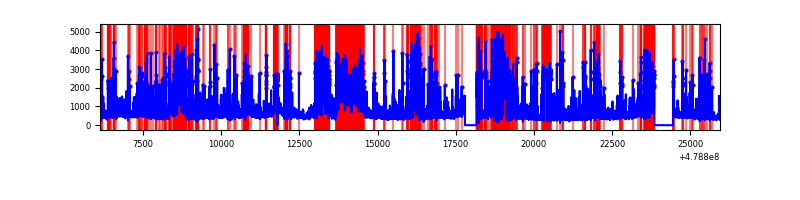 |
| D | 19828 | 18845 | 902 | 902 | 4.55% | 4.79% | 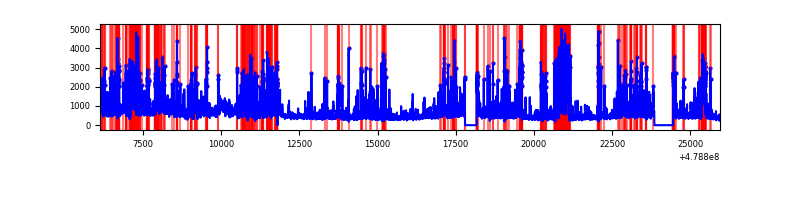 |
Top three noisy pixels from each quadrant. If the there are fewer than three noisy pixels in the level2.evt file, extra rows are filled as -1
| Pixel properties | Quadrant properties | ||||||
|---|---|---|---|---|---|---|---|
| Quadrant | DetID | PixID | Counts | Sigma | Mean | Median | Sigma |
| A | 12 | 80 | 5290480 | 11176.31 | 1907 | 1861 | 473.2 |
| A | 3 | 95 | 2759187 | 5826.99 | 1907 | 1861 | 473.2 |
| A | 12 | 3 | 858831 | 1811.01 | 1907 | 1861 | 473.2 |
| B | 4 | 81 | 2214263 | 5452.09 | 1927 | 1859 | 405.8 |
| B | 0 | 172 | 878860 | 2161.22 | 1927 | 1859 | 405.8 |
| B | 4 | 171 | 694653 | 1707.27 | 1927 | 1859 | 405.8 |
| C | 15 | 1 | 4394914 | 9016.83 | 1770 | 1763 | 487.2 |
| C | 15 | 147 | 2129265 | 4366.64 | 1770 | 1763 | 487.2 |
| C | 1 | 44 | 1009591 | 2068.54 | 1770 | 1763 | 487.2 |
| D | 12 | 191 | 1317894 | 2538.45 | 1871 | 1810 | 518.5 |
| D | 8 | 176 | 714806 | 1375.22 | 1871 | 1810 | 518.5 |
| D | 15 | 170 | 695020 | 1337.05 | 1871 | 1810 | 518.5 |
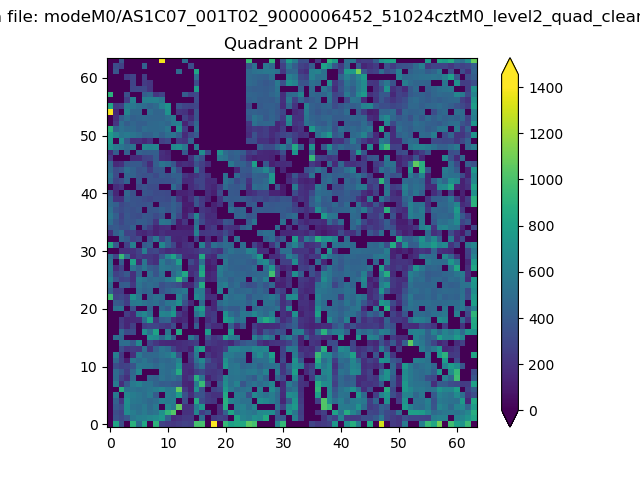
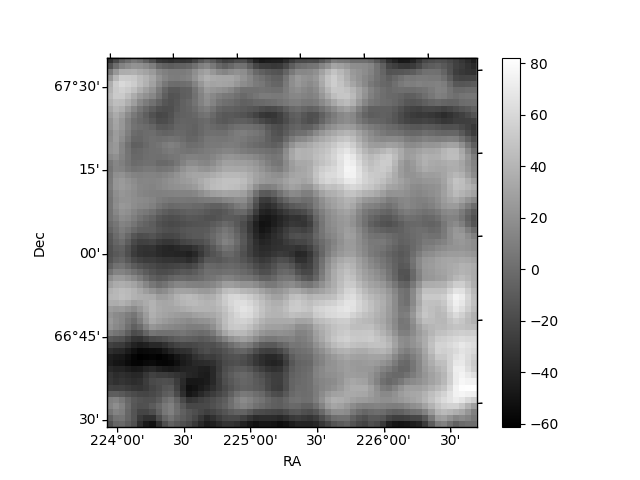
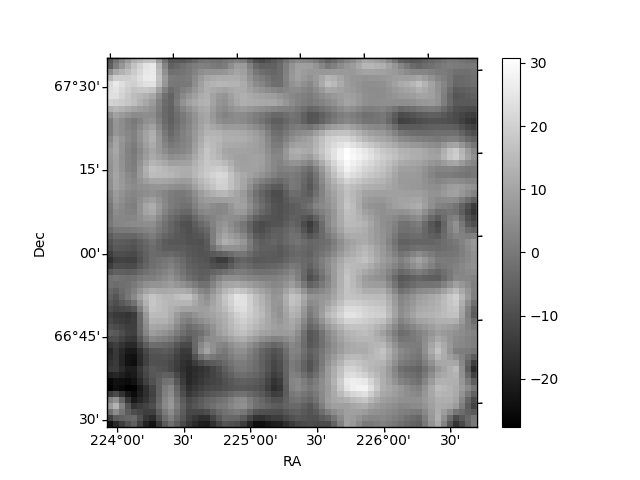
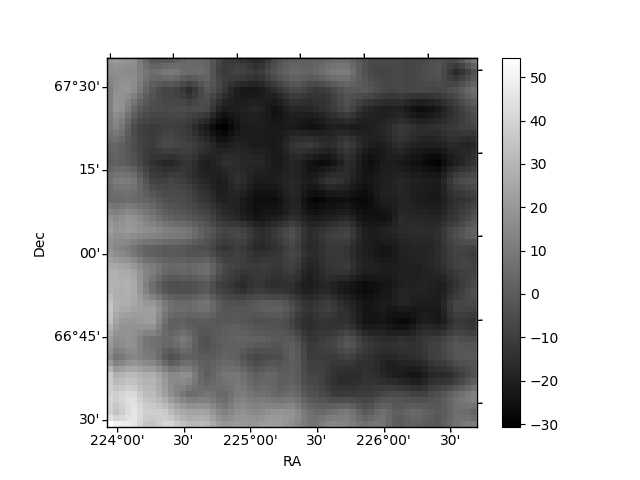
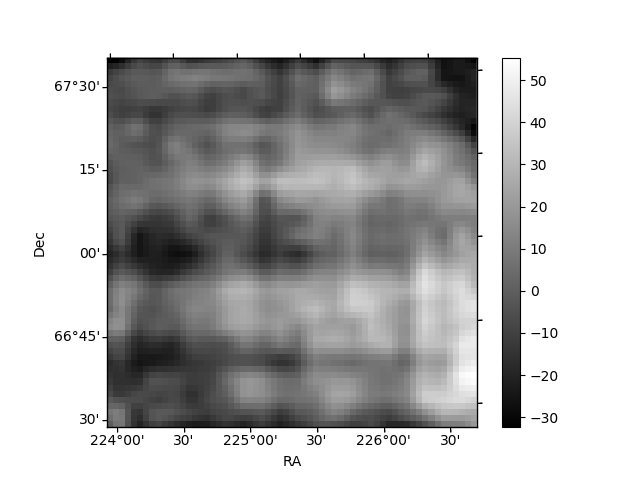
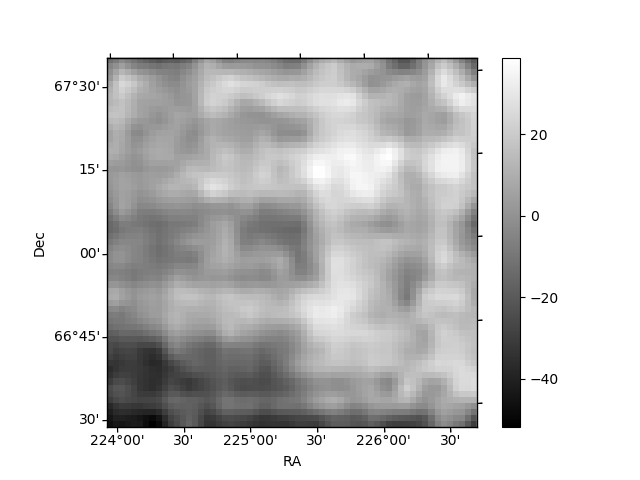
Histogram calculated using DETX and DETY for each event in the final _common_clean file
| Quadrant A | 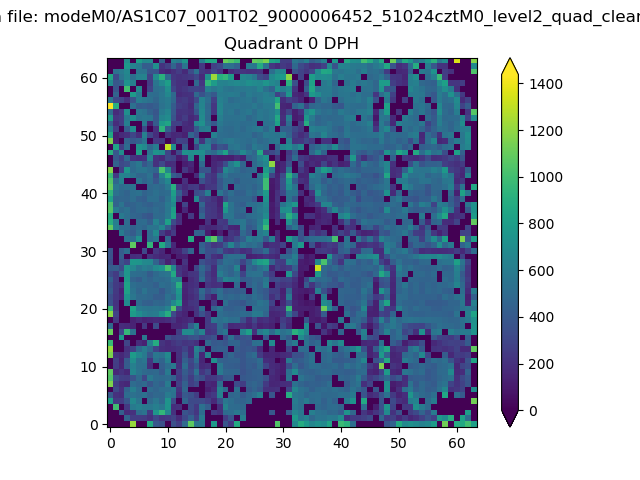 |
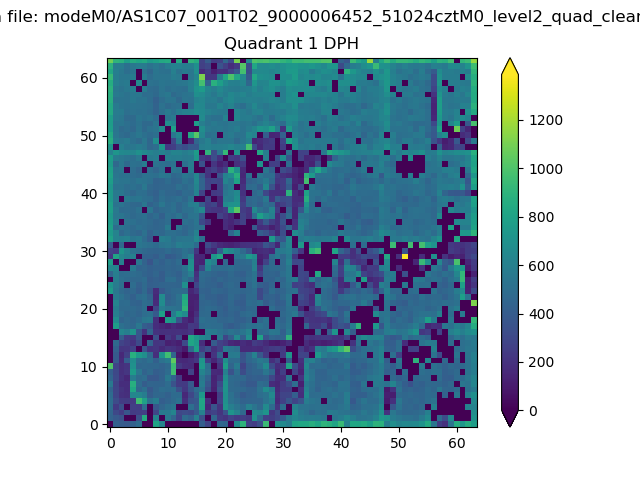 |
Quadrant B |
|---|---|---|---|
| Quadrant D | 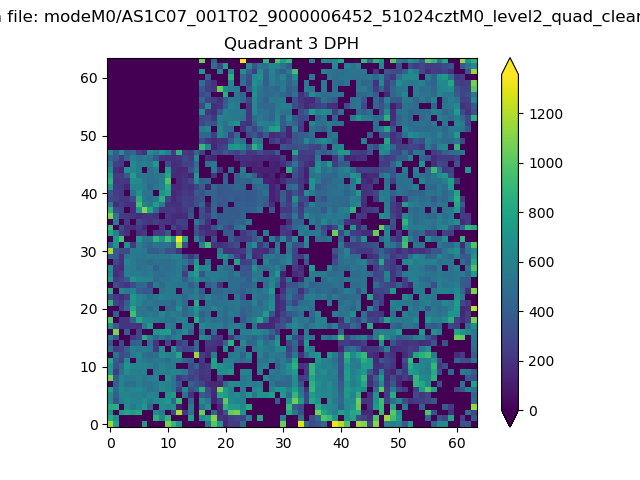 |
 |
Quadrant C |
| Plot type | Count rate plots | Images |
|---|---|---|
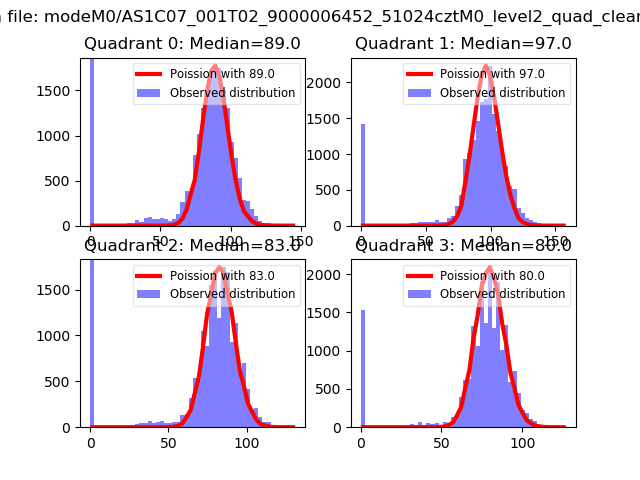
| Comparison with Poisson distribution Blue bars denote a histogram of data divided into 1 sec bins. Red curve is a Poisson curve with rate = median count rate of data. |
 |
 |
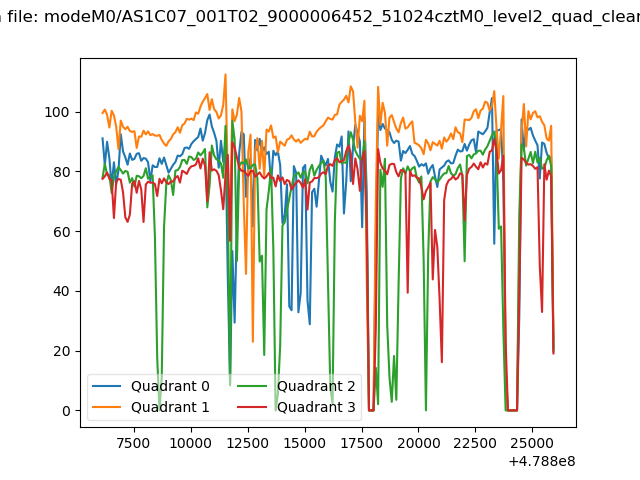
| Quadrant-wise count rates Data is divided into 100 sec bins |
 |
|
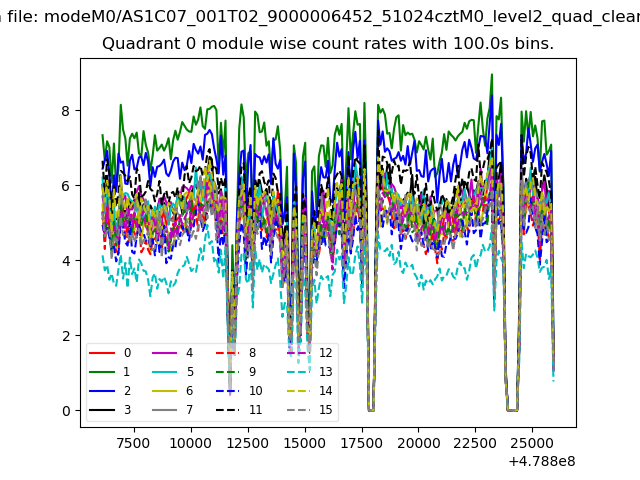
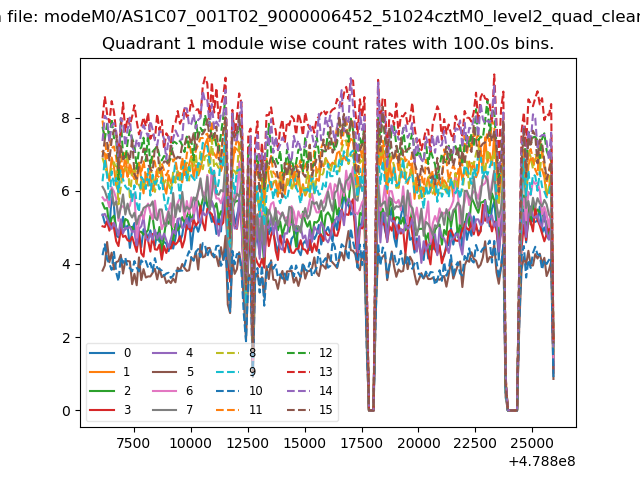
| Module-wise count rates for Quadrant A Data is divided into 100 sec bins |
 |
 |
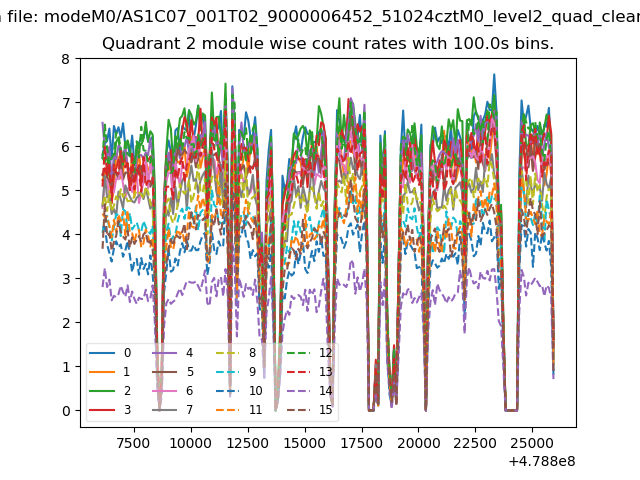
| Module-wise count rates for Quadrant B Data is divided into 100 sec bins |
 |
 |
| Module-wise count rates for Quadrant C Data is divided into 100 sec bins |
 |
 |
| Module-wise count rates for Quadrant D Data is divided into 100 sec bins |
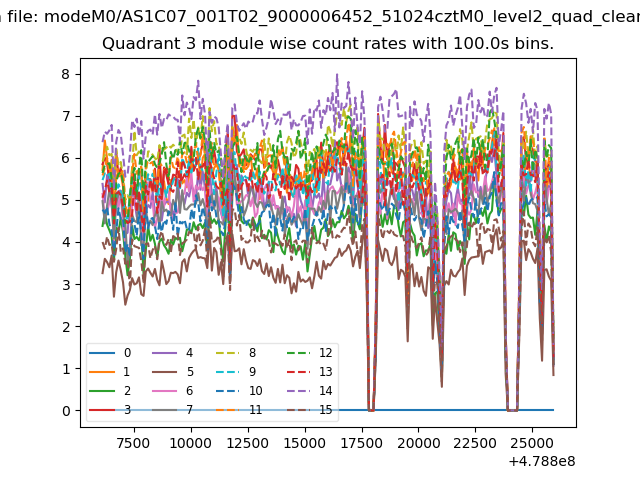 |
 |
| Parameter | Plot |
|---|---|
| CZT HV Monitor | 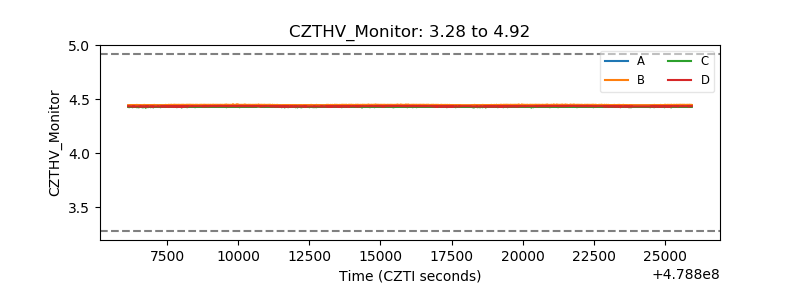 |
| D_VDD | 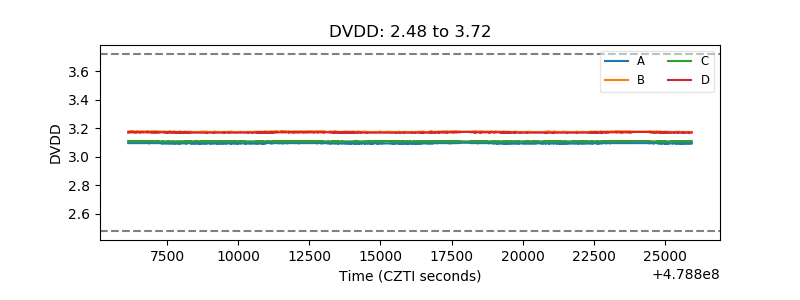 |
| Temperature 1 | 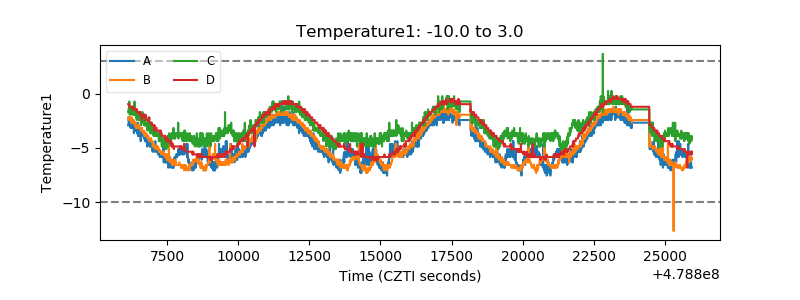 |
| Veto HV Monitor | 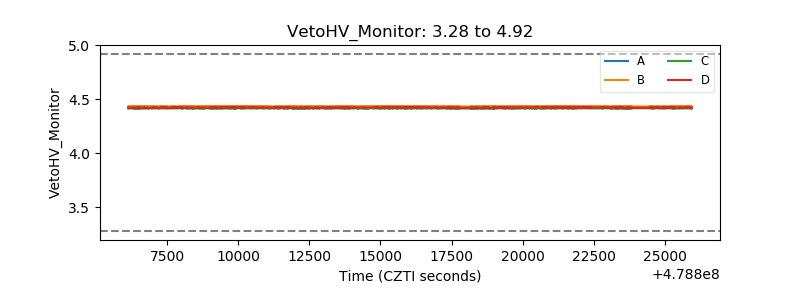 |
| Veto LLD | 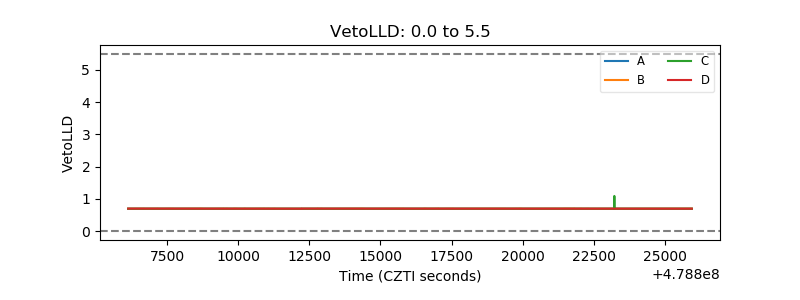 |
| Alpha Counter | 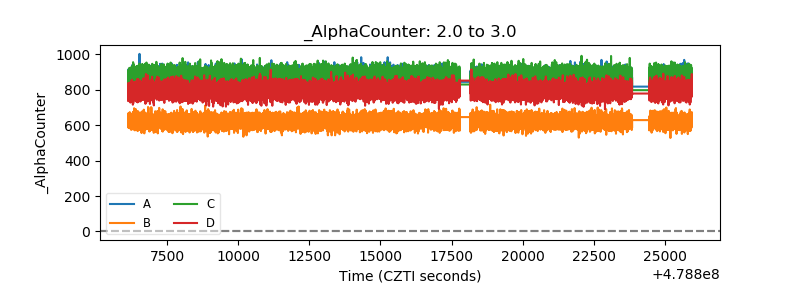 |
| _CPM_Rate | 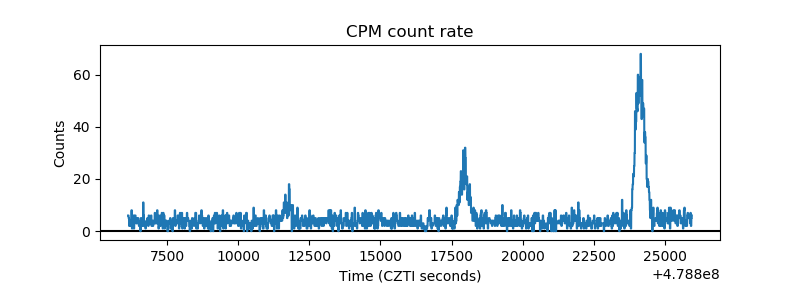 |
| CZT Counter | 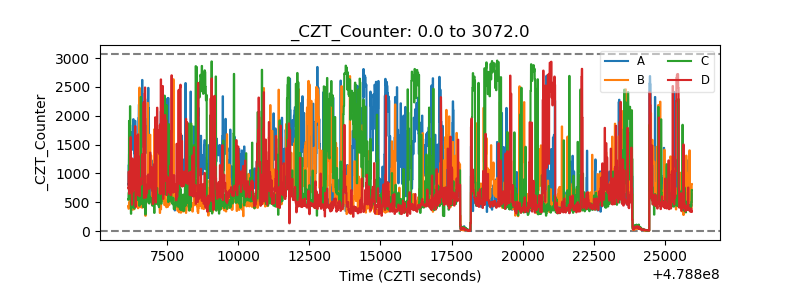 |
| +2.5 Volts monitor |  |
| +5 Volts monitor | 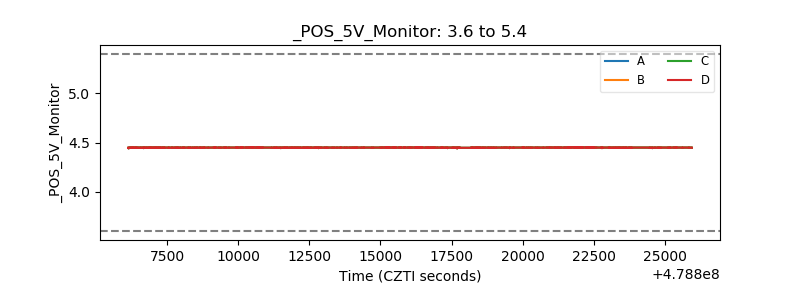 |
| _ROLL_ROT | 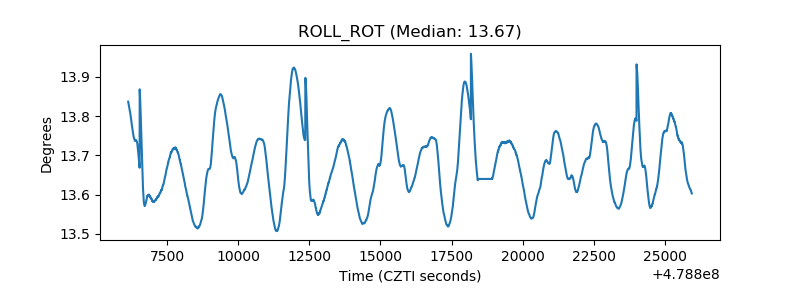 |
| _Roll_DEC | 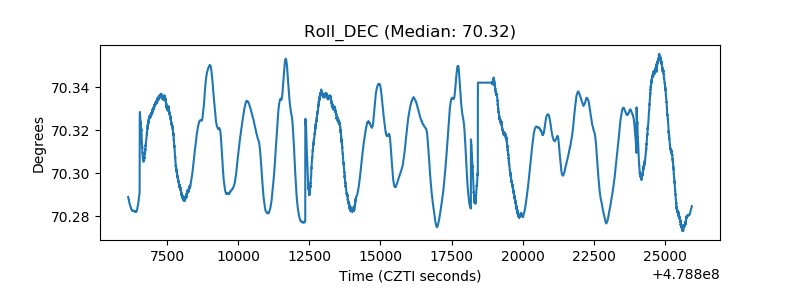 |
| _Roll_RA | 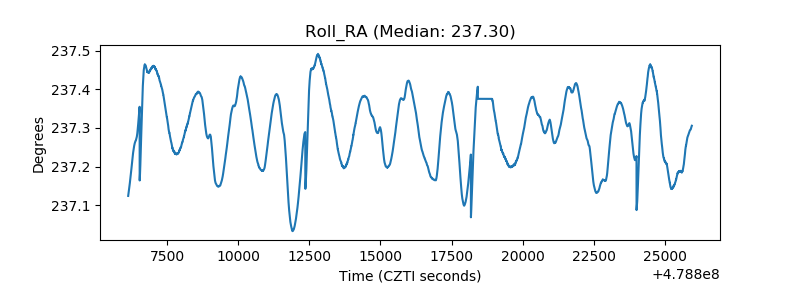 |
| Veto Counter | 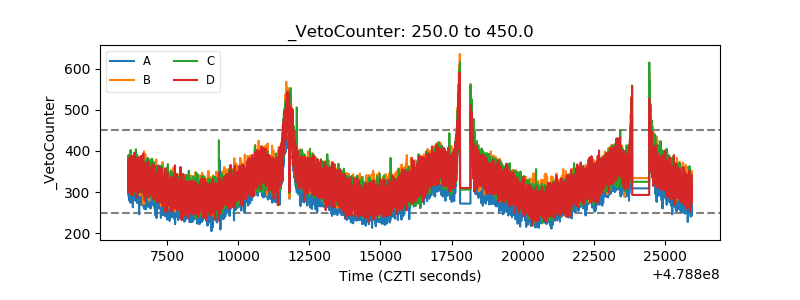 |