| Param | Original file | Final file |
|---|---|---|
| Filename | modeM0/AS1C07_001T02_9000006452_51025cztM0_level2.fits | modeM0/AS1C07_001T02_9000006452_51025cztM0_level2_quad_clean.evt |
| Size (bytes) | 540,668,160 | 100,802,880 |
| Size | 515.6 MB | 96.1 MB |
| Events in quadrant A | 4,778,110 | 657,719 |
| Events in quadrant B | 5,238,359 | 666,846 |
| Events in quadrant C | 3,882,259 | 647,414 |
| Events in quadrant D | 5,551,346 | 574,347 |
| Mode SS | |||
|---|---|---|---|
| Quadrant | BADHDUFLAG | Total packets | Discarded packets |
| A | 0 | 150 | 0 |
| B | 0 | 150 | 0 |
| C | 0 | 150 | 0 |
| D | 0 | 150 | 0 |
| Mode M9 | |||
|---|---|---|---|
| Quadrant | BADHDUFLAG | Total packets | Discarded packets |
| A | 0 | 13 | 0 |
| B | 0 | 13 | 0 |
| C | 0 | 13 | 0 |
| D | 0 | 13 | 0 |
| Mode M0 | |||
|---|---|---|---|
| Quadrant | BADHDUFLAG | Total packets | Discarded packets |
| A | 0 | 19116 | 2 |
| B | 0 | 20816 | 2 |
| C | 0 | 16946 | 2 |
| D | 0 | 21740 | 2 |
| Quadrant | Total seconds | Saturated seconds | Saturation percentage |
|---|---|---|---|
| A | 7262 | 238 | 3.277334% |
| B | 7262 | 633 | 8.716607% |
| C | 7262 | 165 | 2.272101% |
| D | 7262 | 591 | 8.138254% |
Noise dominated data is calculated using 1-second bins in cleaned event files. If a bin has >2000 counts, and if more than 50% of those come from <1% of pixels, then it is considered to be noise-dominated and hence unusable.
| Quadrant | # 1 sec bins | Bins with >0 counts | Bins with >2000 counts | High rate bins dominated by noise | Noise dominated (total time) | Noise dominated (detector-on time) | Marked lightcurve |
|---|---|---|---|---|---|---|---|
| A | 8622 | 7264 | 162 | 162 | 1.88% | 2.23% | 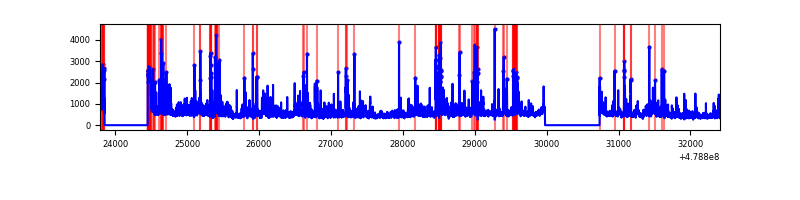 |
| B | 8622 | 7264 | 351 | 351 | 4.07% | 4.83% | 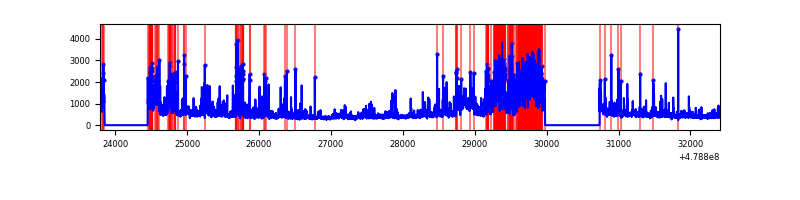 |
| C | 8622 | 7264 | 101 | 101 | 1.17% | 1.39% | 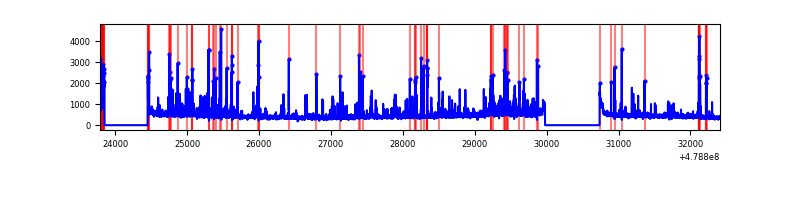 |
| D | 8622 | 7264 | 493 | 493 | 5.72% | 6.79% | 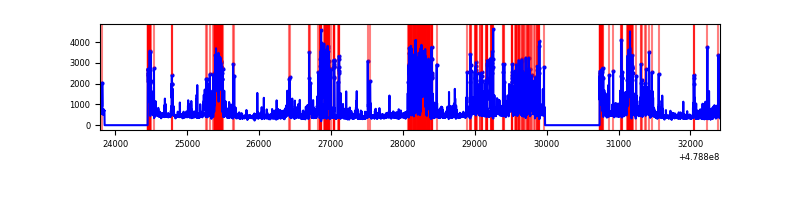 |
Top three noisy pixels from each quadrant. If the there are fewer than three noisy pixels in the level2.evt file, extra rows are filled as -1
| Pixel properties | Quadrant properties | ||||||
|---|---|---|---|---|---|---|---|
| Quadrant | DetID | PixID | Counts | Sigma | Mean | Median | Sigma |
| A | 12 | 3 | 506268 | 2731.5 | 744 | 726 | 185.1 |
| A | 4 | 249 | 196232 | 1056.34 | 744 | 726 | 185.1 |
| A | 3 | 114 | 186772 | 1005.23 | 744 | 726 | 185.1 |
| B | 4 | 81 | 921331 | 5882.79 | 732 | 705 | 156.5 |
| B | 12 | 32 | 366925 | 2340.14 | 732 | 705 | 156.5 |
| B | 0 | 172 | 227444 | 1448.86 | 732 | 705 | 156.5 |
| C | 1 | 44 | 354037 | 1714.48 | 741 | 731 | 206.1 |
| C | 13 | 49 | 164081 | 792.68 | 741 | 731 | 206.1 |
| C | 3 | 233 | 59876 | 287.01 | 741 | 731 | 206.1 |
| D | 8 | 176 | 1215006 | 6124.52 | 708 | 683 | 198.3 |
| D | 2 | 216 | 720953 | 3632.73 | 708 | 683 | 198.3 |
| D | 2 | 249 | 197272 | 991.51 | 708 | 683 | 198.3 |
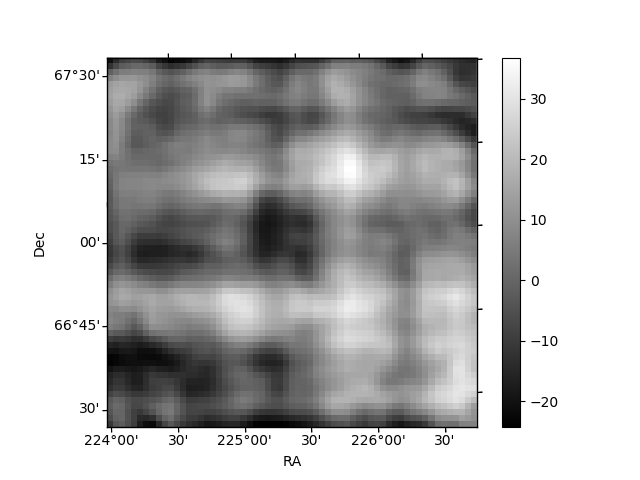
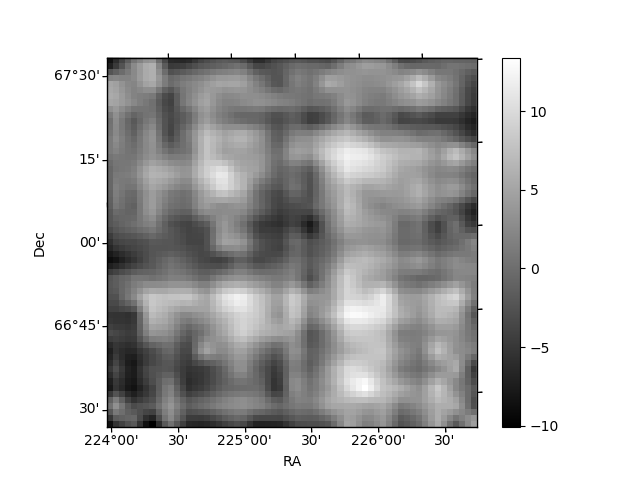
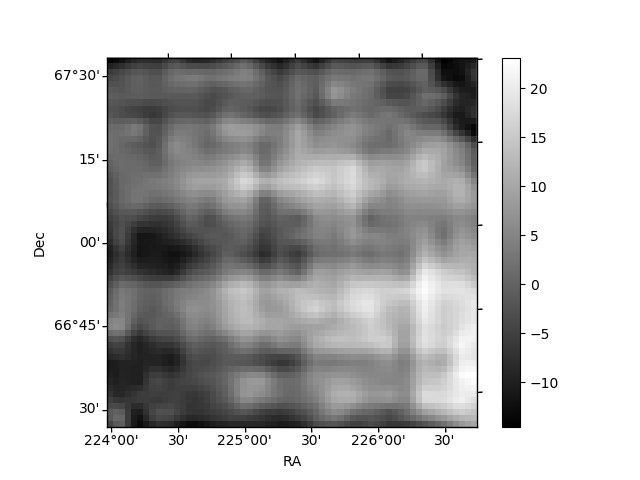
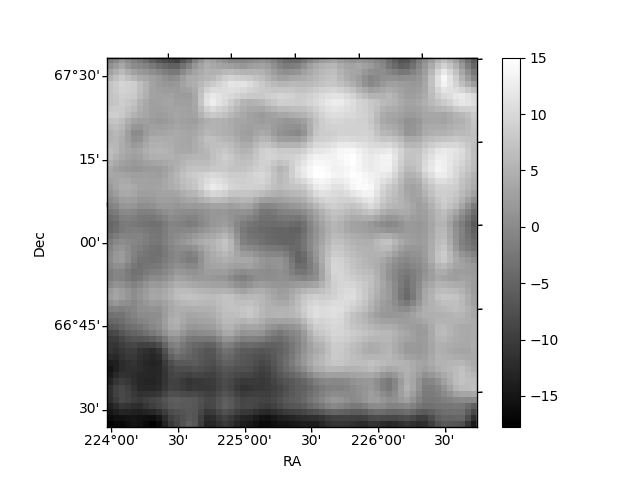
Histogram calculated using DETX and DETY for each event in the final _common_clean file
| Quadrant A | 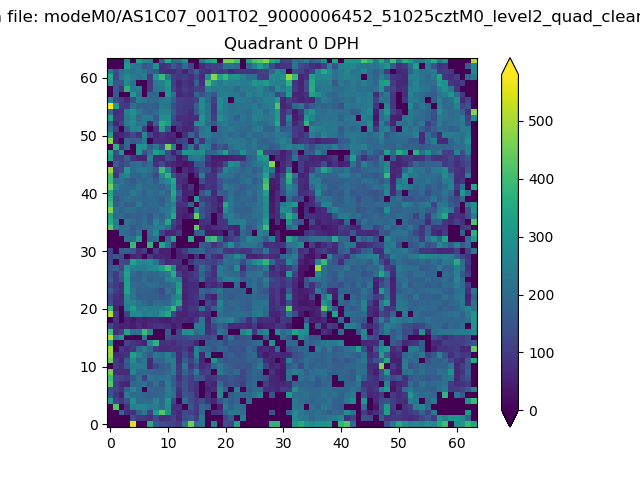 |
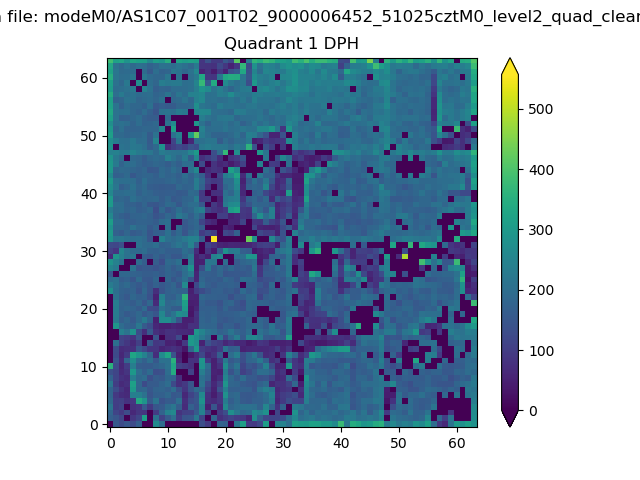 |
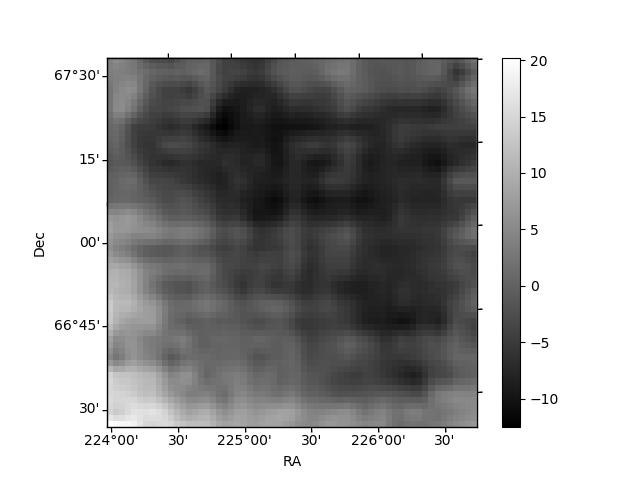
Quadrant B |
|---|---|---|---|
| Quadrant D | 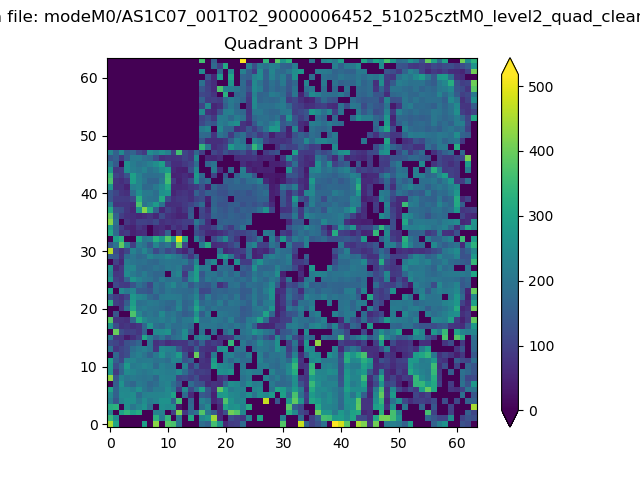 |
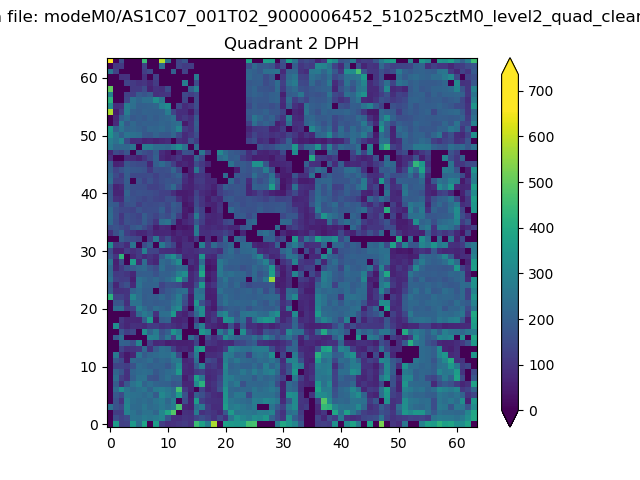 |
Quadrant C |
| Plot type | Count rate plots | Images |
|---|---|---|
| Comparison with Poisson distribution Blue bars denote a histogram of data divided into 1 sec bins. Red curve is a Poisson curve with rate = median count rate of data. |
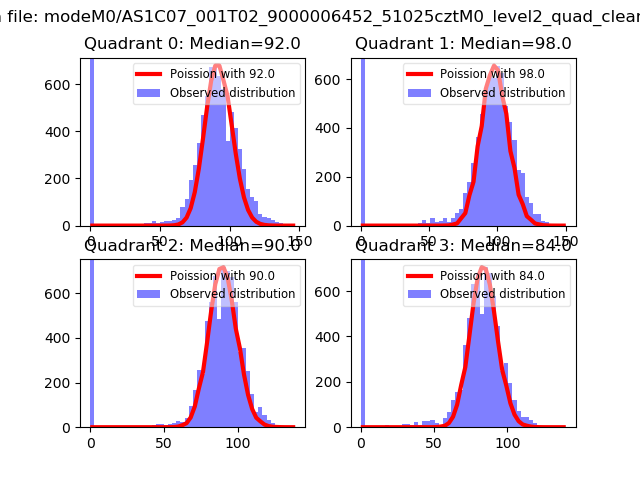 |
 |
| Quadrant-wise count rates Data is divided into 100 sec bins |
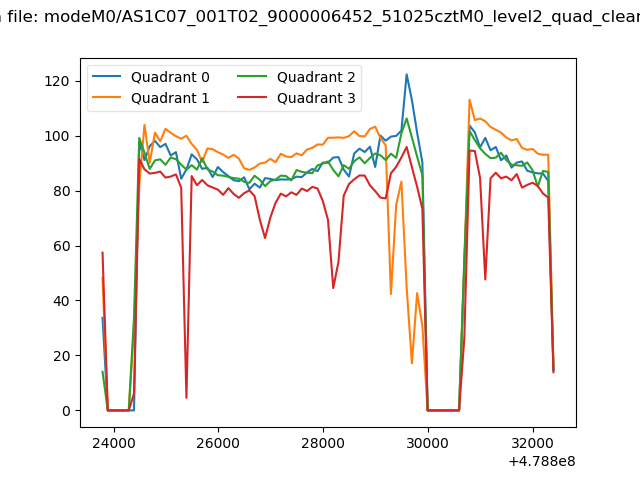 |
|
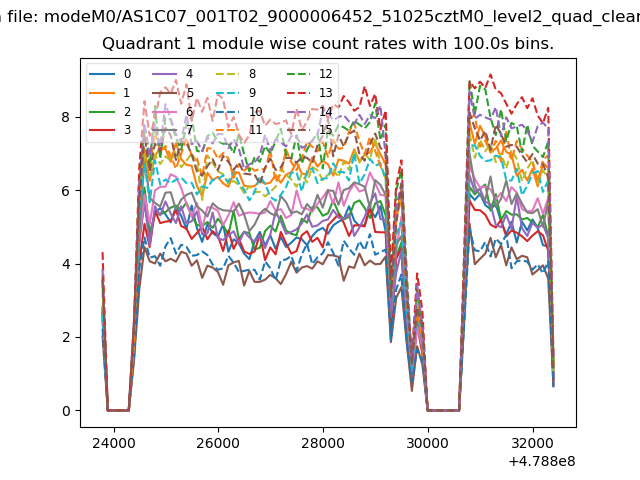
| Module-wise count rates for Quadrant A Data is divided into 100 sec bins |
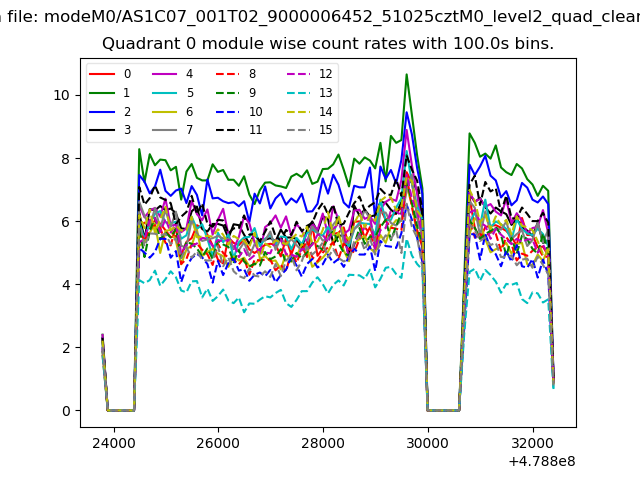 |
 |
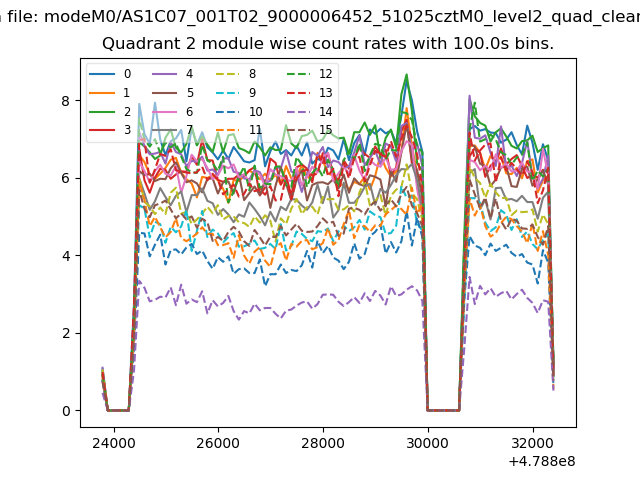
| Module-wise count rates for Quadrant B Data is divided into 100 sec bins |
 |
 |
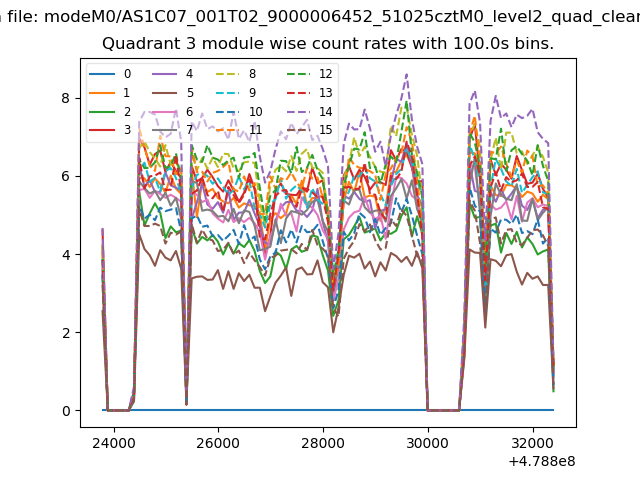
| Module-wise count rates for Quadrant C Data is divided into 100 sec bins |
 |
 |
| Module-wise count rates for Quadrant D Data is divided into 100 sec bins |
 |
 |
| Parameter | Plot |
|---|---|
| CZT HV Monitor | 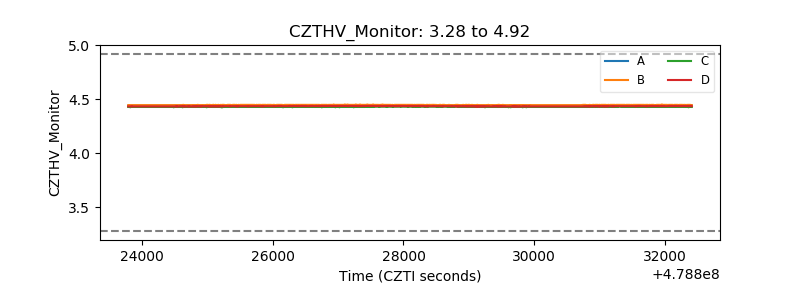 |
| D_VDD | 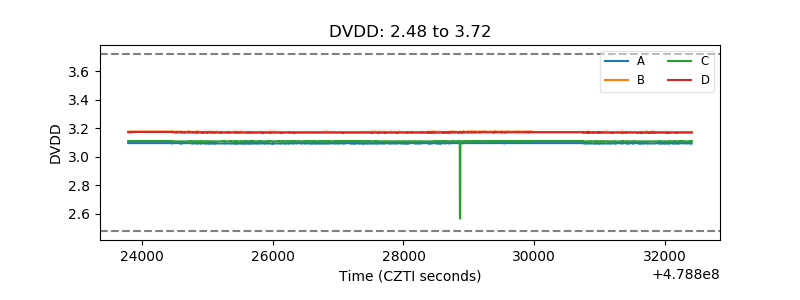 |
| Temperature 1 | 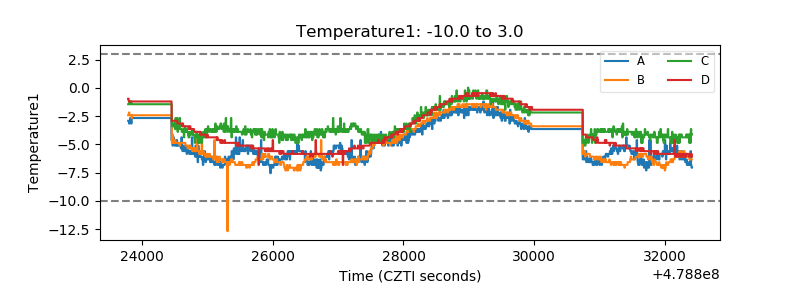 |
| Veto HV Monitor | 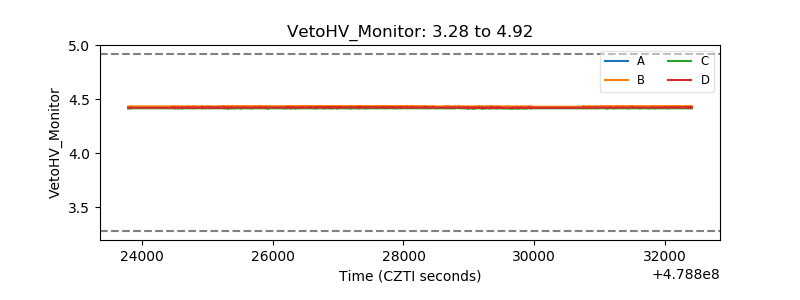 |
| Veto LLD | 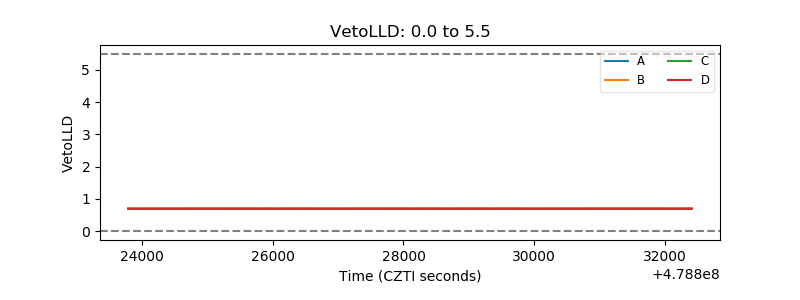 |
| Alpha Counter | 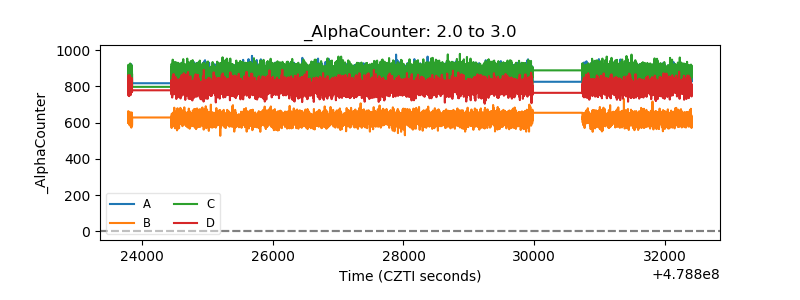 |
| _CPM_Rate | 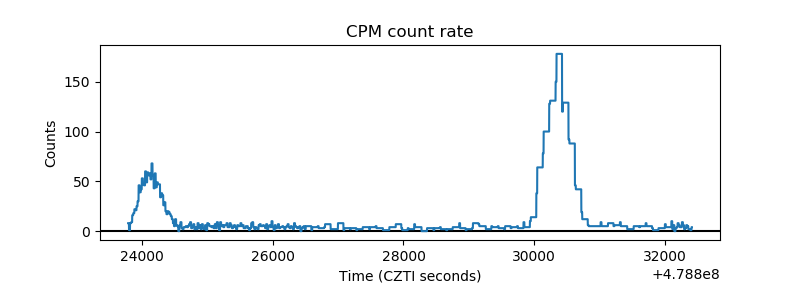 |
| CZT Counter | 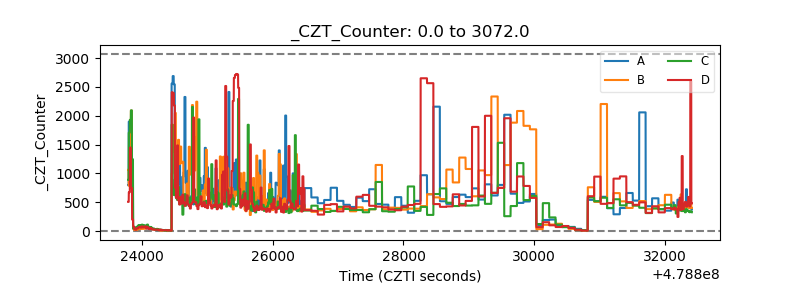 |
| +2.5 Volts monitor | 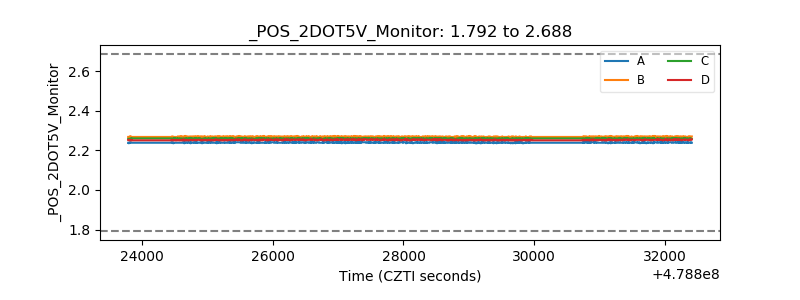 |
| +5 Volts monitor | 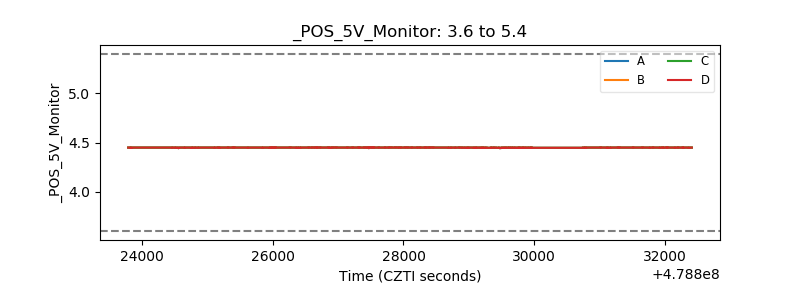 |
| _ROLL_ROT | 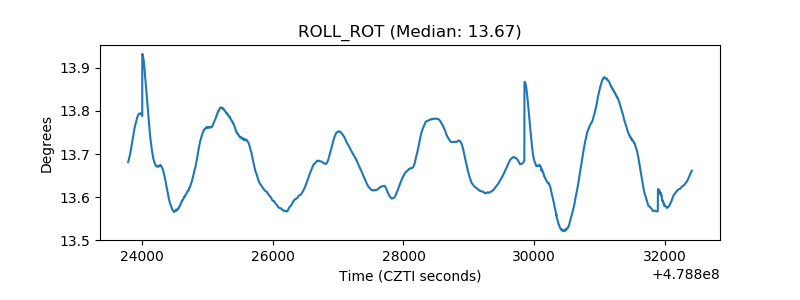 |
| _Roll_DEC | 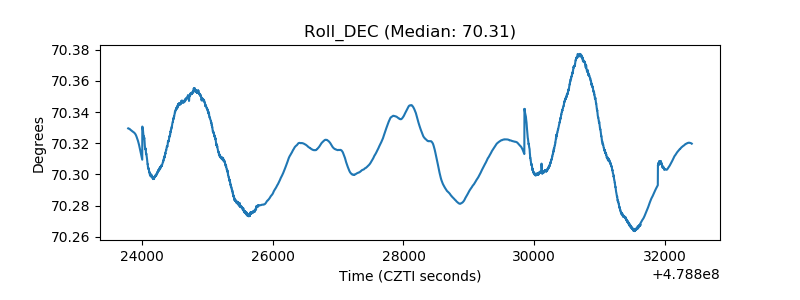 |
| _Roll_RA | 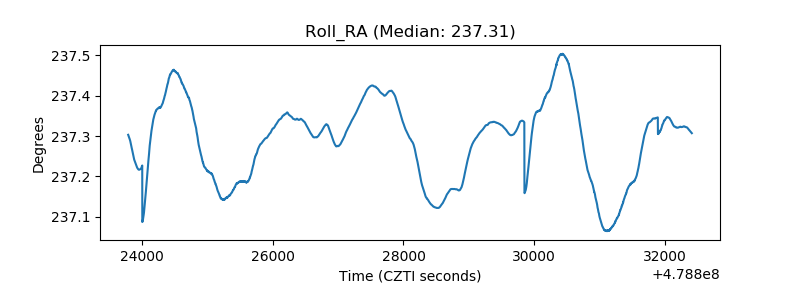 |
| Veto Counter | 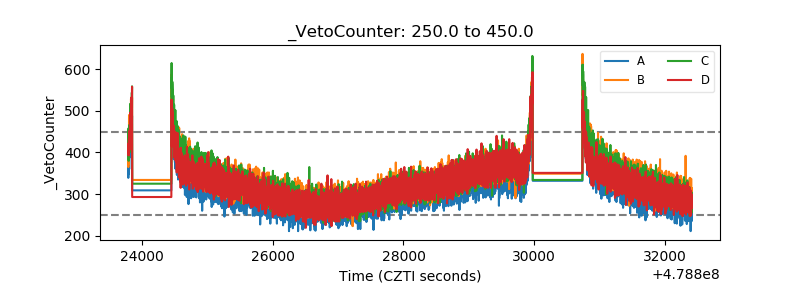 |