| Param | Original file | Final file |
|---|---|---|
| Filename | modeM0/AS1C07_001T02_9000006452_51026cztM0_level2.fits | modeM0/AS1C07_001T02_9000006452_51026cztM0_level2_quad_clean.evt |
| Size (bytes) | 520,680,960 | 95,929,920 |
| Size | 496.6 MB | 91.5 MB |
| Events in quadrant A | 4,607,952 | 630,674 |
| Events in quadrant B | 5,465,932 | 610,290 |
| Events in quadrant C | 3,921,133 | 619,582 |
| Events in quadrant D | 4,739,670 | 560,231 |
| Mode SS | |||
|---|---|---|---|
| Quadrant | BADHDUFLAG | Total packets | Discarded packets |
| A | 0 | 144 | 0 |
| B | 0 | 144 | 0 |
| C | 0 | 144 | 0 |
| D | 0 | 144 | 0 |
| Mode M9 | |||
|---|---|---|---|
| Quadrant | BADHDUFLAG | Total packets | Discarded packets |
| A | 0 | 16 | 0 |
| B | 0 | 16 | 0 |
| C | 0 | 16 | 0 |
| D | 0 | 16 | 0 |
| Mode M0 | |||
|---|---|---|---|
| Quadrant | BADHDUFLAG | Total packets | Discarded packets |
| A | 0 | 18539 | 2 |
| B | 0 | 21239 | 2 |
| C | 0 | 16759 | 2 |
| D | 0 | 19203 | 2 |
| Quadrant | Total seconds | Saturated seconds | Saturation percentage |
|---|---|---|---|
| A | 6941 | 210 | 3.025501% |
| B | 6941 | 931 | 13.413053% |
| C | 6941 | 138 | 1.988186% |
| D | 6942 | 376 | 5.416307% |
Noise dominated data is calculated using 1-second bins in cleaned event files. If a bin has >2000 counts, and if more than 50% of those come from <1% of pixels, then it is considered to be noise-dominated and hence unusable.
| Quadrant | # 1 sec bins | Bins with >0 counts | Bins with >2000 counts | High rate bins dominated by noise | Noise dominated (total time) | Noise dominated (detector-on time) | Marked lightcurve |
|---|---|---|---|---|---|---|---|
| A | 8621 | 6943 | 140 | 140 | 1.62% | 2.02% | 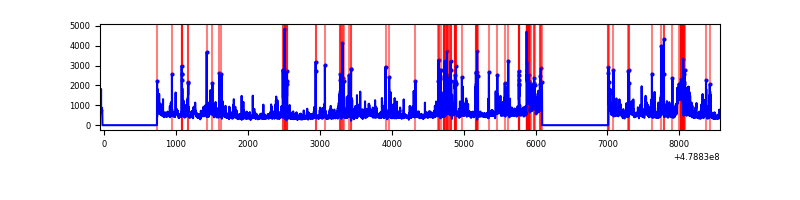 |
| B | 8621 | 6942 | 535 | 535 | 6.21% | 7.71% | 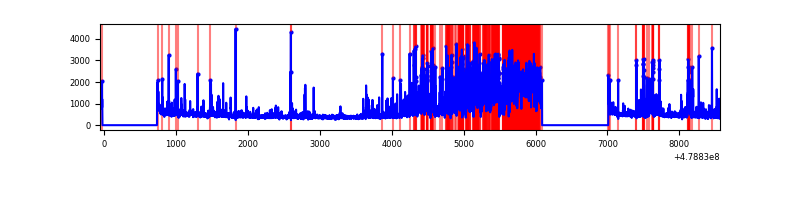 |
| C | 8621 | 6943 | 101 | 101 | 1.17% | 1.45% | 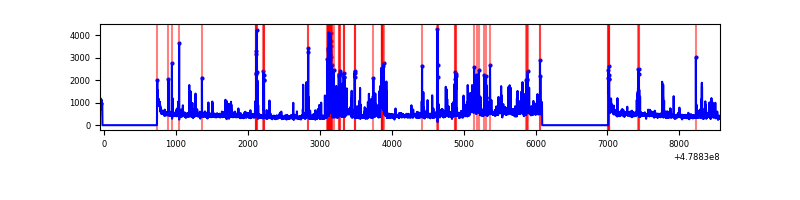 |
| D | 8622 | 6944 | 325 | 325 | 3.77% | 4.68% | 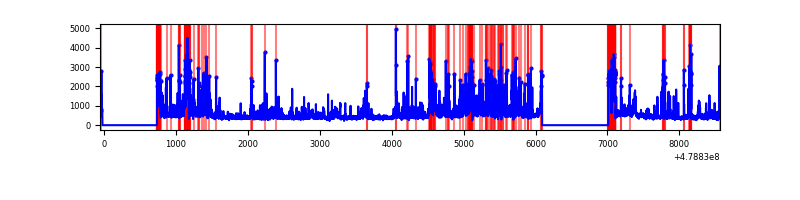 |
Top three noisy pixels from each quadrant. If the there are fewer than three noisy pixels in the level2.evt file, extra rows are filled as -1
| Pixel properties | Quadrant properties | ||||||
|---|---|---|---|---|---|---|---|
| Quadrant | DetID | PixID | Counts | Sigma | Mean | Median | Sigma |
| A | 12 | 3 | 383572 | 2164.78 | 713 | 695 | 176.9 |
| A | 4 | 249 | 183629 | 1034.31 | 713 | 695 | 176.9 |
| A | 12 | 80 | 171503 | 965.75 | 713 | 695 | 176.9 |
| B | 4 | 81 | 1159115 | 7996.7 | 682 | 657 | 144.9 |
| B | 12 | 32 | 859662 | 5929.61 | 682 | 657 | 144.9 |
| B | 4 | 171 | 177033 | 1217.5 | 682 | 657 | 144.9 |
| C | 15 | 147 | 174620 | 897.18 | 702 | 696 | 193.9 |
| C | 6 | 13 | 161084 | 827.35 | 702 | 696 | 193.9 |
| C | 9 | 38 | 116354 | 596.62 | 702 | 696 | 193.9 |
| D | 2 | 216 | 941554 | 4987.99 | 672 | 649 | 188.6 |
| D | 8 | 176 | 582996 | 3087.18 | 672 | 649 | 188.6 |
| D | 2 | 249 | 86588 | 455.59 | 672 | 649 | 188.6 |
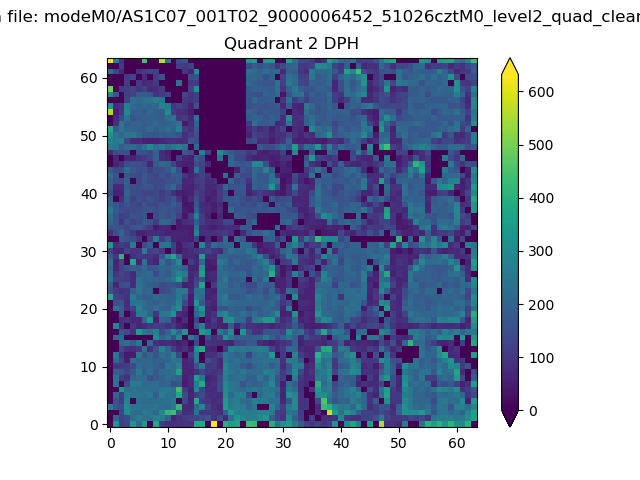
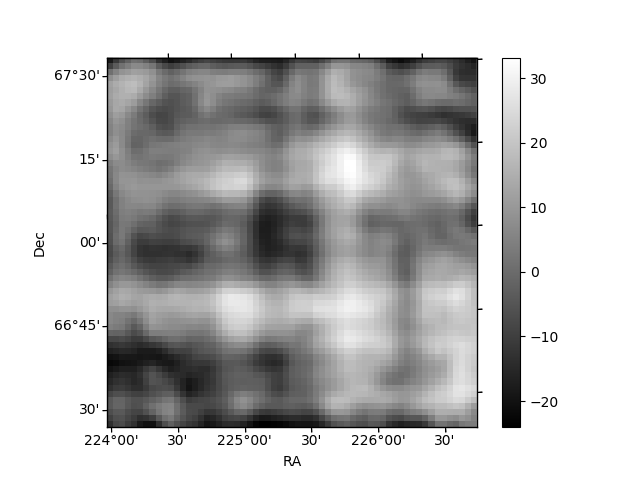
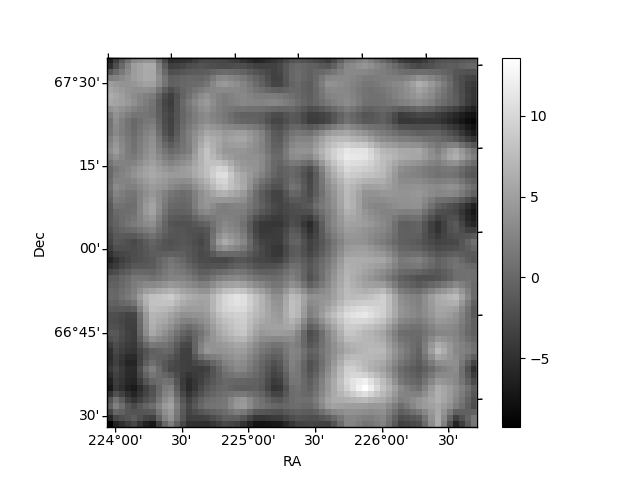
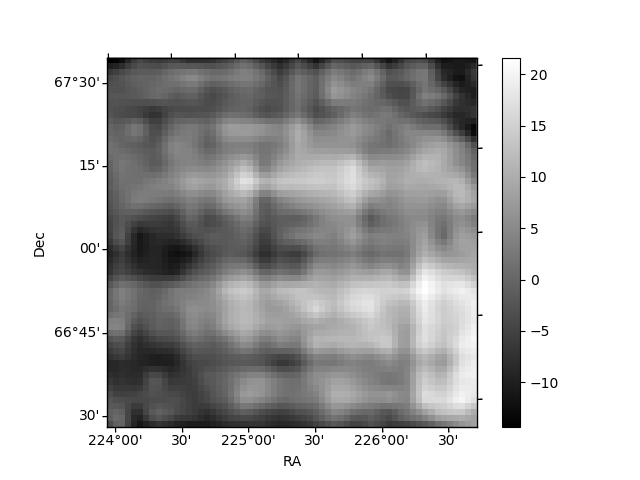
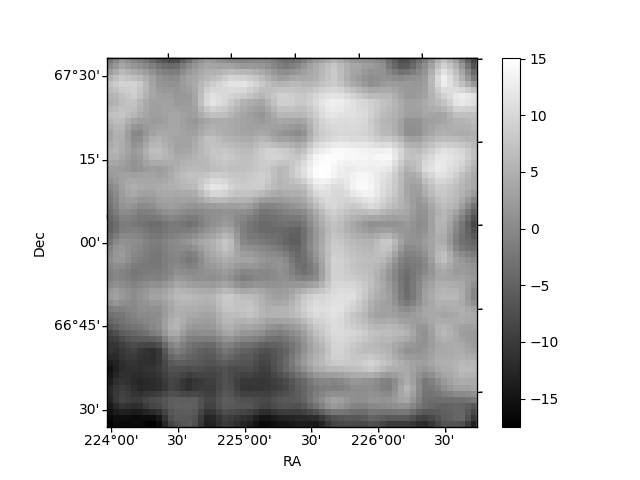
Histogram calculated using DETX and DETY for each event in the final _common_clean file
| Quadrant A | 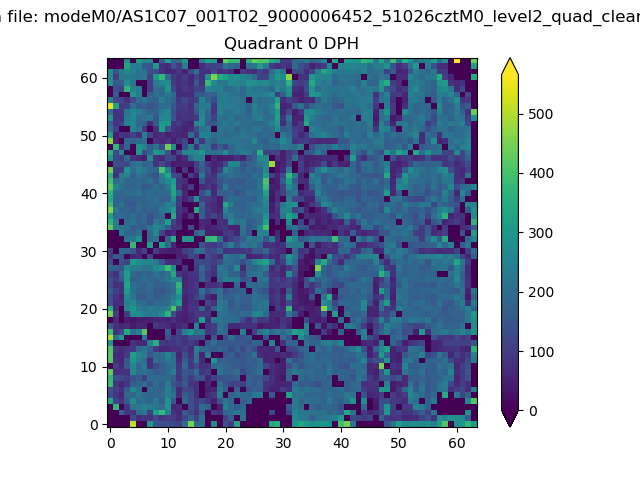 |
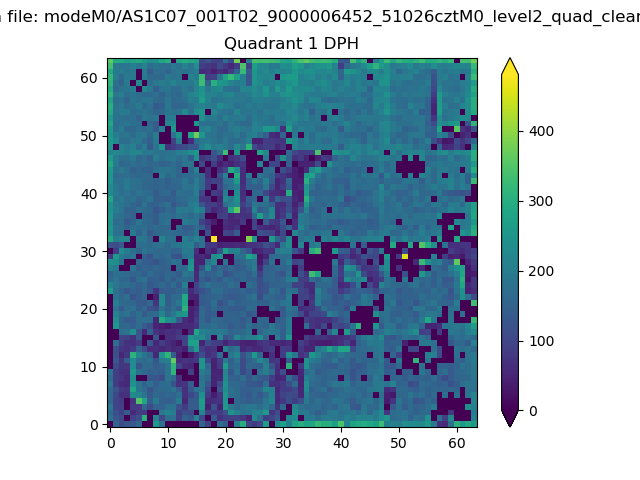 |
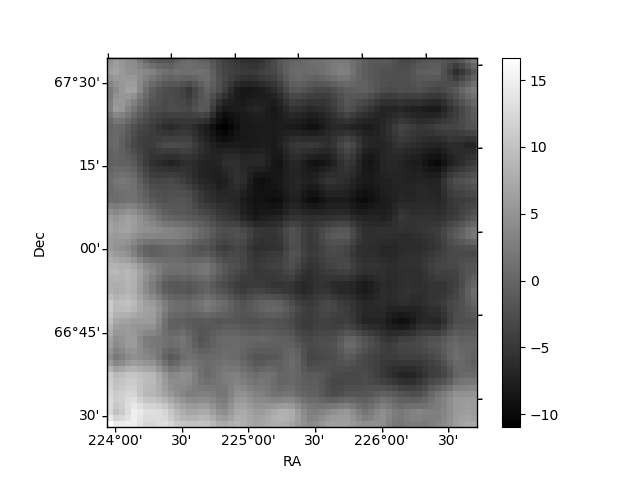
Quadrant B |
|---|---|---|---|
| Quadrant D | 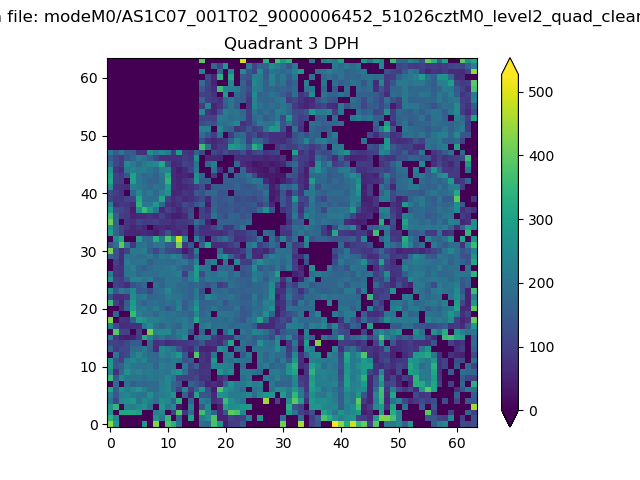 |
 |
Quadrant C |
| Plot type | Count rate plots | Images |
|---|---|---|
| Comparison with Poisson distribution Blue bars denote a histogram of data divided into 1 sec bins. Red curve is a Poisson curve with rate = median count rate of data. |
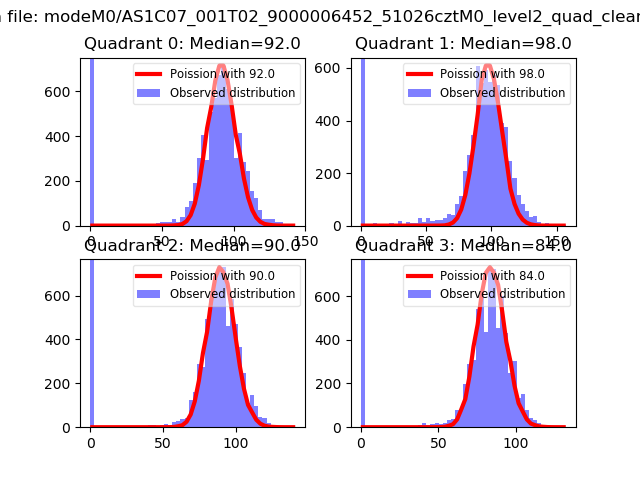 |
 |
| Quadrant-wise count rates Data is divided into 100 sec bins |
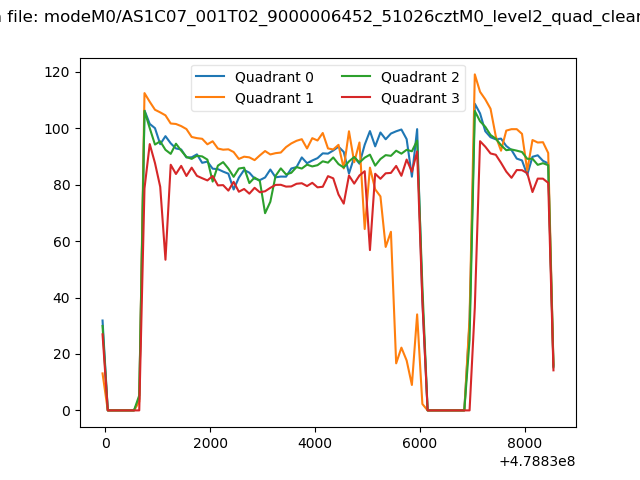 |
|
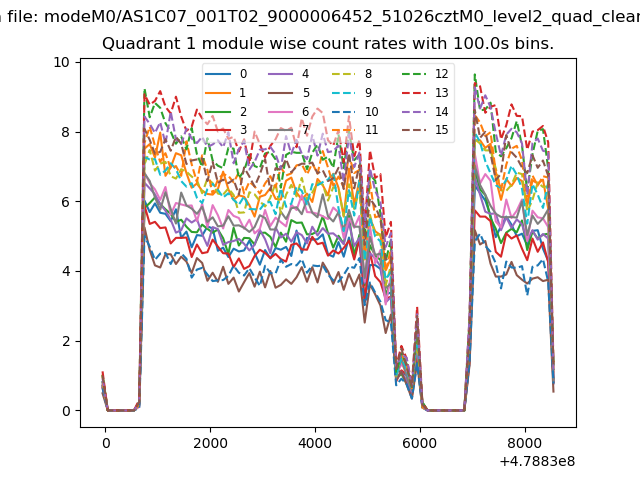
| Module-wise count rates for Quadrant A Data is divided into 100 sec bins |
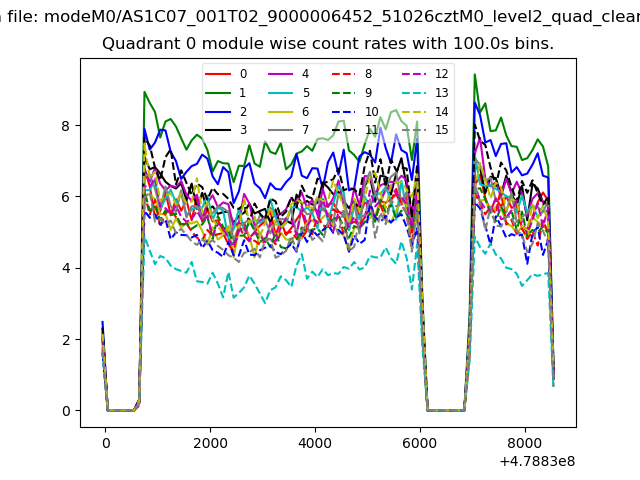 |
 |
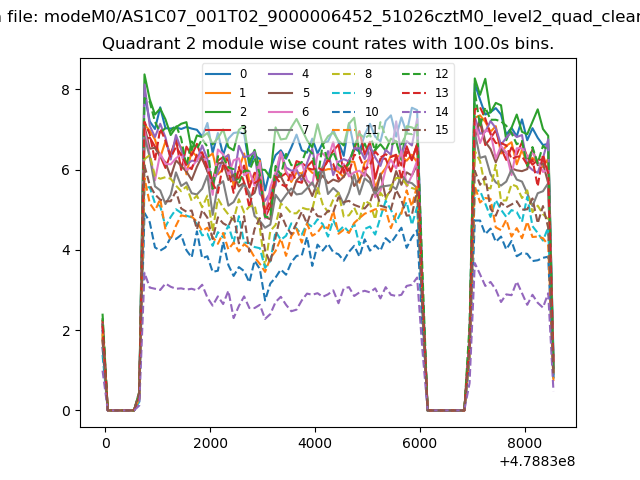
| Module-wise count rates for Quadrant B Data is divided into 100 sec bins |
 |
 |
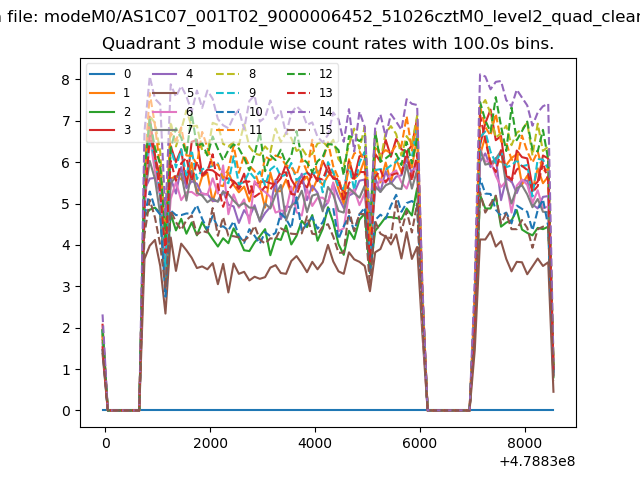
| Module-wise count rates for Quadrant C Data is divided into 100 sec bins |
 |
 |
| Module-wise count rates for Quadrant D Data is divided into 100 sec bins |
 |
 |
| Parameter | Plot |
|---|---|
| CZT HV Monitor | 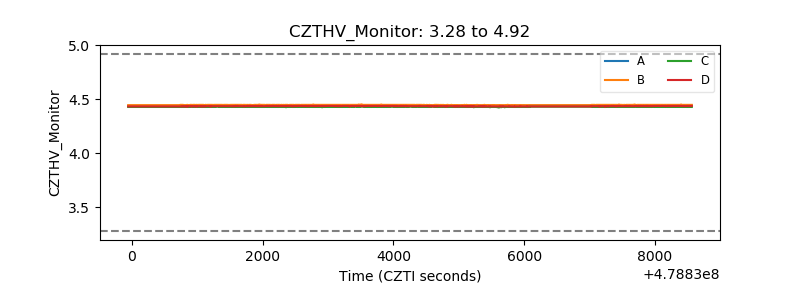 |
| D_VDD | 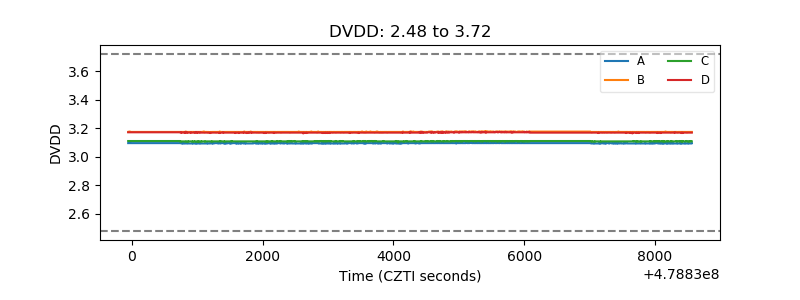 |
| Temperature 1 | 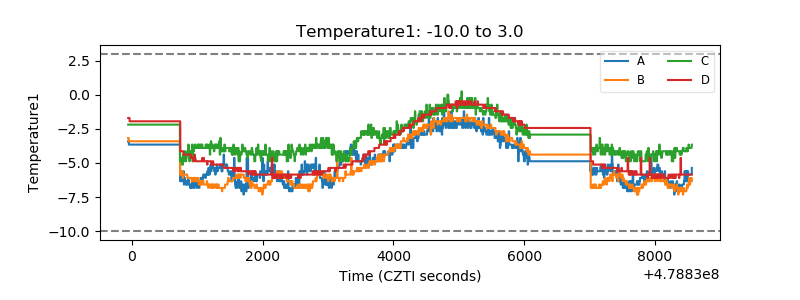 |
| Veto HV Monitor | 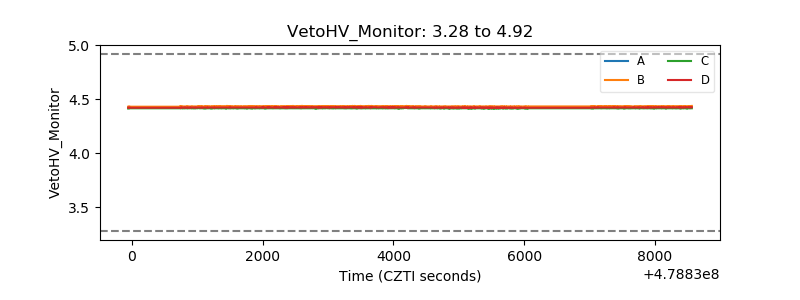 |
| Veto LLD | 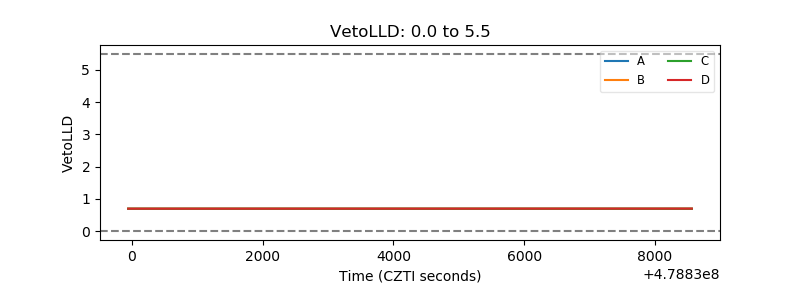 |
| Alpha Counter | 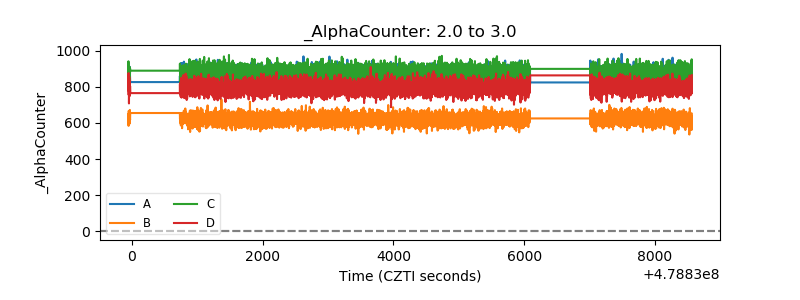 |
| _CPM_Rate | 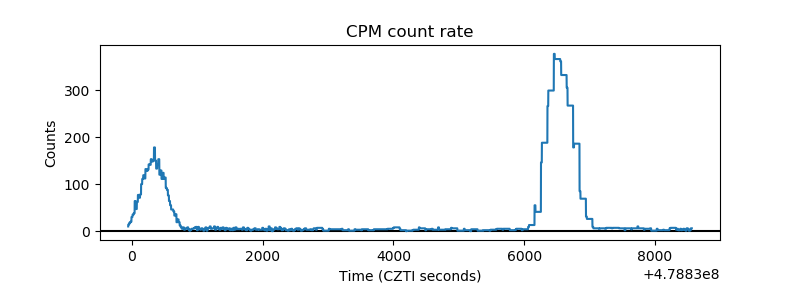 |
| CZT Counter | 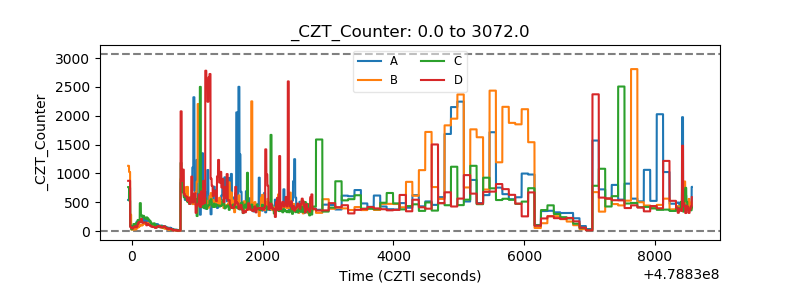 |
| +2.5 Volts monitor | 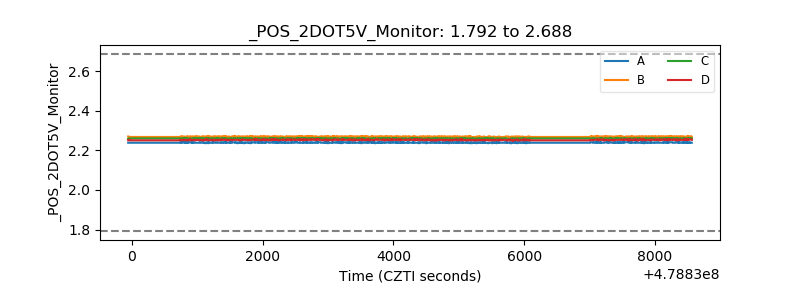 |
| +5 Volts monitor | 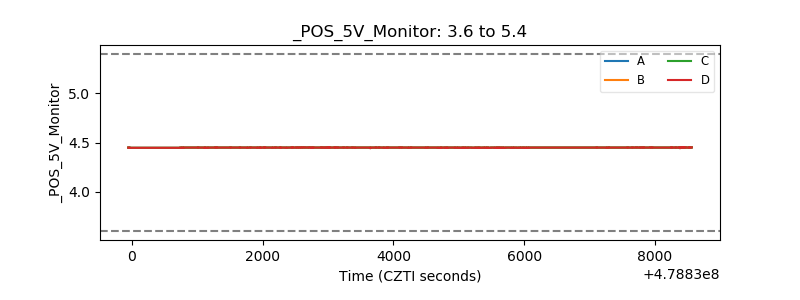 |
| _ROLL_ROT | 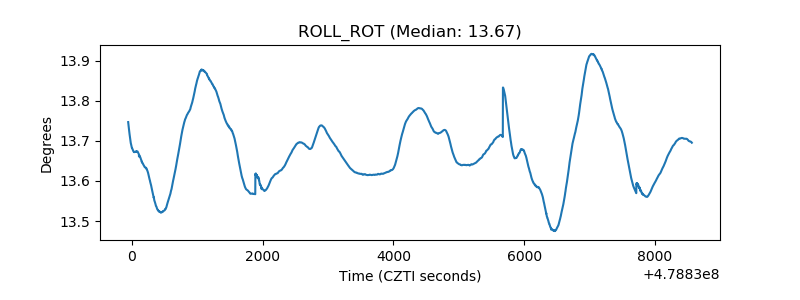 |
| _Roll_DEC | 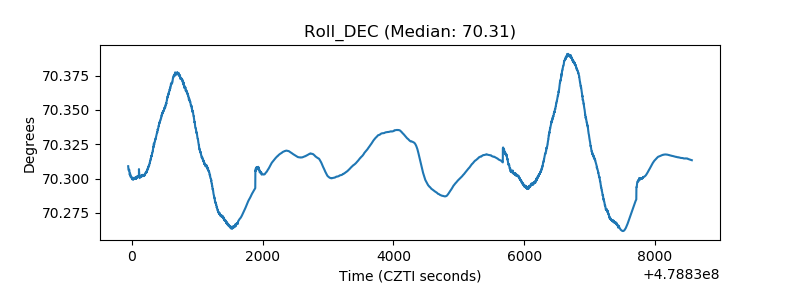 |
| _Roll_RA | 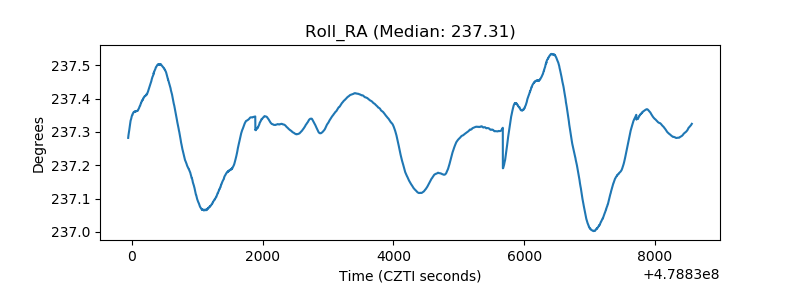 |
| Veto Counter | 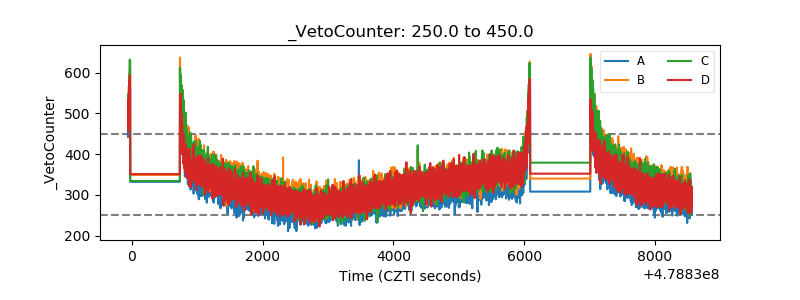 |