| Param | Original file | Final file |
|---|---|---|
| Filename | modeM0/AS1C07_001T02_9000006452_51028cztM0_level2.fits | modeM0/AS1C07_001T02_9000006452_51028cztM0_level2_quad_clean.evt |
| Size (bytes) | 553,501,440 | 93,674,880 |
| Size | 527.9 MB | 89.3 MB |
| Events in quadrant A | 5,546,723 | 595,846 |
| Events in quadrant B | 4,658,352 | 651,339 |
| Events in quadrant C | 3,962,328 | 607,583 |
| Events in quadrant D | 5,801,884 | 514,655 |
| Mode SS | |||
|---|---|---|---|
| Quadrant | BADHDUFLAG | Total packets | Discarded packets |
| A | 0 | 136 | 0 |
| B | 0 | 136 | 0 |
| C | 0 | 136 | 0 |
| D | 0 | 136 | 0 |
| Mode M9 | |||
|---|---|---|---|
| Quadrant | BADHDUFLAG | Total packets | Discarded packets |
| A | 0 | 15 | 0 |
| B | 0 | 15 | 0 |
| C | 0 | 16 | 0 |
| D | 0 | 16 | 0 |
| Mode M0 | |||
|---|---|---|---|
| Quadrant | BADHDUFLAG | Total packets | Discarded packets |
| A | 0 | 21124 | 2 |
| B | 0 | 18608 | 2 |
| C | 0 | 16502 | 2 |
| D | 0 | 22211 | 2 |
| Quadrant | Total seconds | Saturated seconds | Saturation percentage |
|---|---|---|---|
| A | 6696 | 514 | 7.676225% |
| B | 6696 | 478 | 7.138590% |
| C | 6696 | 172 | 2.568698% |
| D | 6696 | 832 | 12.425329% |
Noise dominated data is calculated using 1-second bins in cleaned event files. If a bin has >2000 counts, and if more than 50% of those come from <1% of pixels, then it is considered to be noise-dominated and hence unusable.
| Quadrant | # 1 sec bins | Bins with >0 counts | Bins with >2000 counts | High rate bins dominated by noise | Noise dominated (total time) | Noise dominated (detector-on time) | Marked lightcurve |
|---|---|---|---|---|---|---|---|
| A | 7731 | 6697 | 367 | 367 | 4.75% | 5.48% | 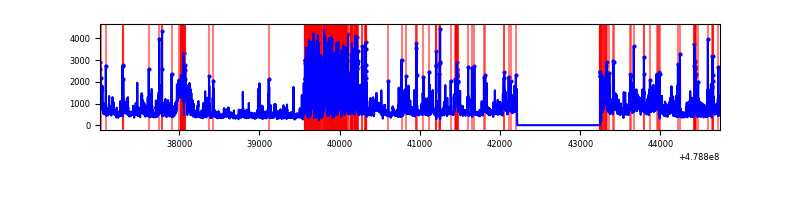 |
| B | 7731 | 6697 | 323 | 323 | 4.18% | 4.82% | 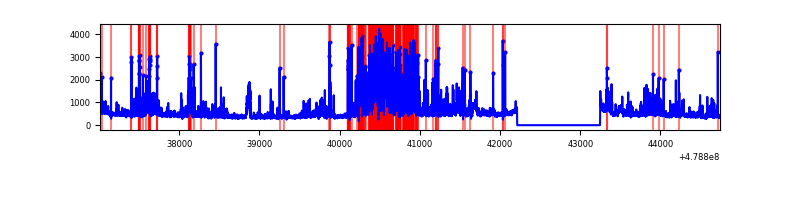 |
| C | 7731 | 6697 | 138 | 138 | 1.79% | 2.06% | 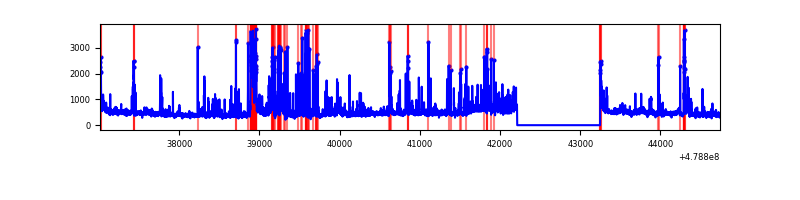 |
| D | 7731 | 6697 | 670 | 670 | 8.67% | 10.00% | 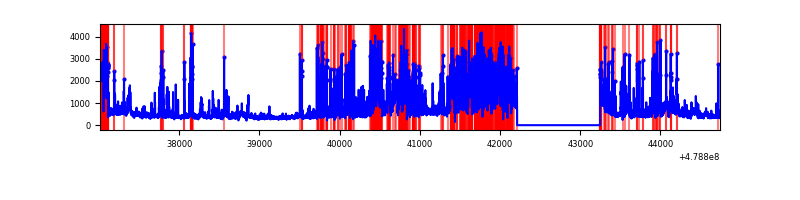 |
Top three noisy pixels from each quadrant. If the there are fewer than three noisy pixels in the level2.evt file, extra rows are filled as -1
| Pixel properties | Quadrant properties | ||||||
|---|---|---|---|---|---|---|---|
| Quadrant | DetID | PixID | Counts | Sigma | Mean | Median | Sigma |
| A | 14 | 238 | 671778 | 3971.79 | 672 | 655 | 169.0 |
| A | 12 | 3 | 657435 | 3886.91 | 672 | 655 | 169.0 |
| A | 14 | 254 | 299141 | 1766.48 | 672 | 655 | 169.0 |
| B | 12 | 32 | 982256 | 6844.38 | 674 | 650 | 143.4 |
| B | 4 | 206 | 240898 | 1675.16 | 674 | 650 | 143.4 |
| B | 4 | 81 | 150311 | 1043.53 | 674 | 650 | 143.4 |
| C | 1 | 44 | 346490 | 1875.9 | 671 | 666 | 184.4 |
| C | 15 | 147 | 316783 | 1714.76 | 671 | 666 | 184.4 |
| C | 12 | 247 | 112695 | 607.69 | 671 | 666 | 184.4 |
| D | 2 | 216 | 1265450 | 7185.11 | 627 | 604 | 176.0 |
| D | 12 | 128 | 723705 | 4107.66 | 627 | 604 | 176.0 |
| D | 12 | 191 | 428021 | 2427.99 | 627 | 604 | 176.0 |
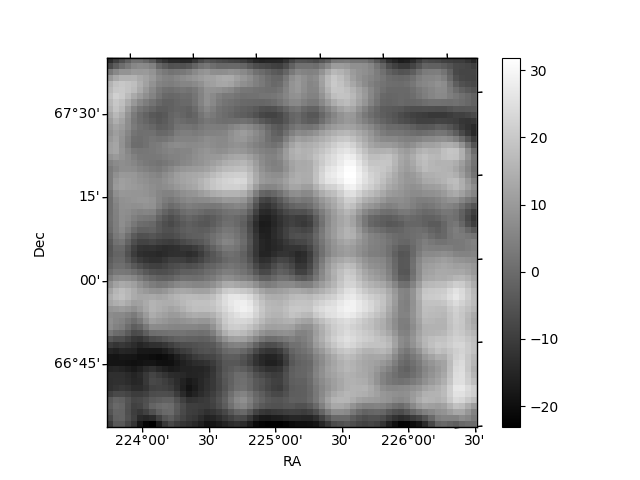
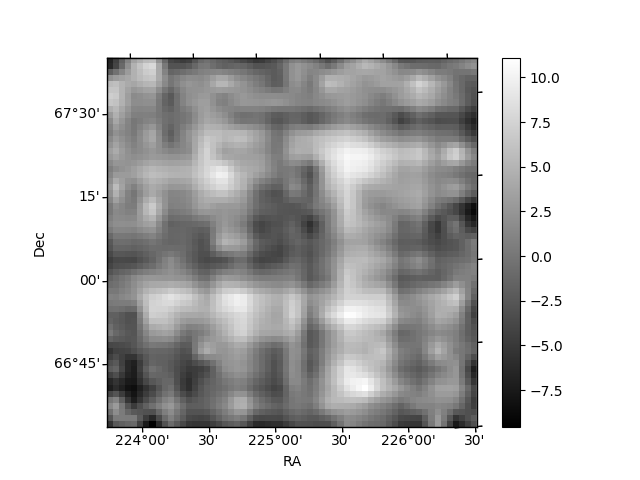
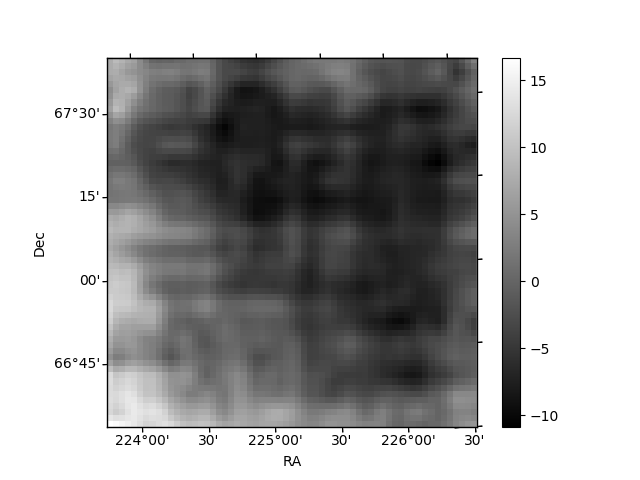
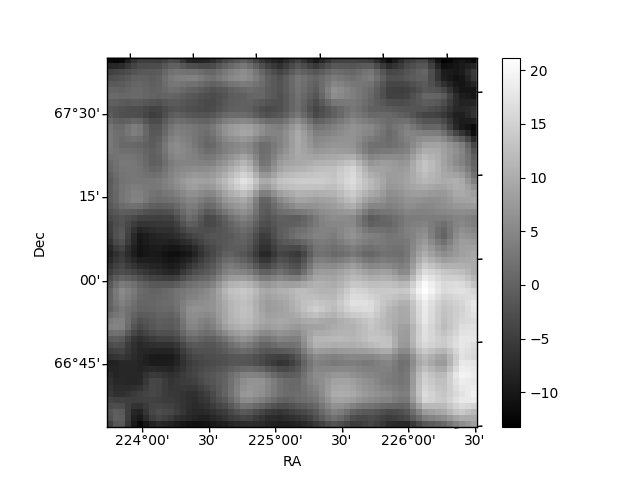
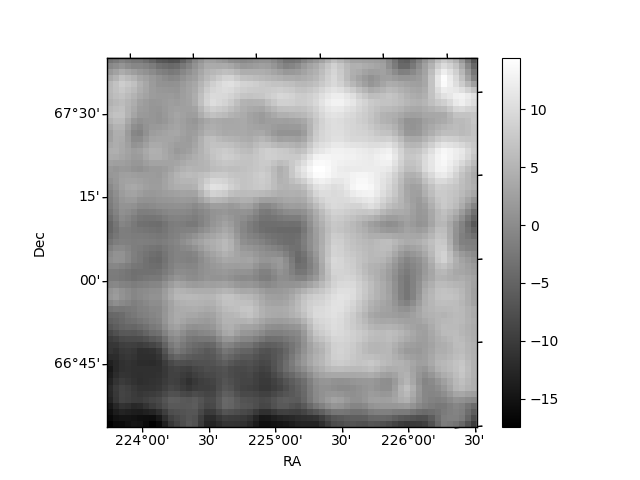
Histogram calculated using DETX and DETY for each event in the final _common_clean file
| Quadrant A | 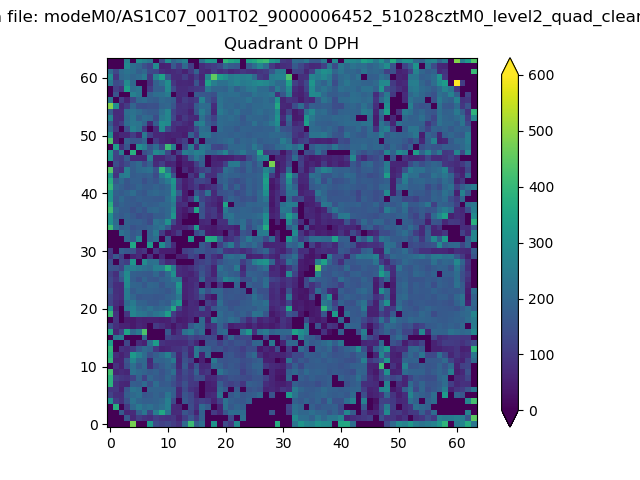 |
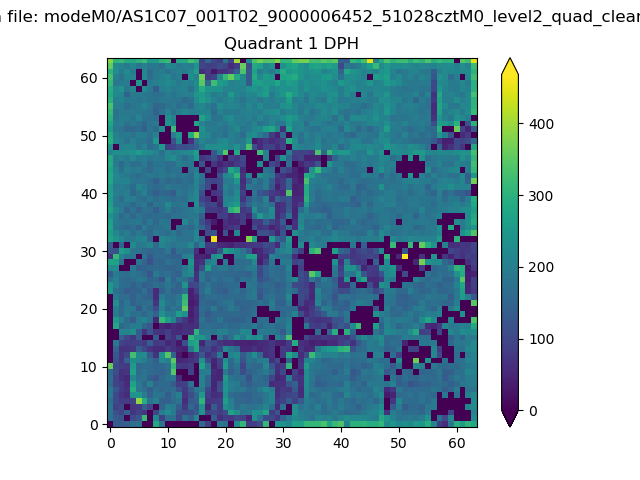 |
Quadrant B |
|---|---|---|---|
| Quadrant D | 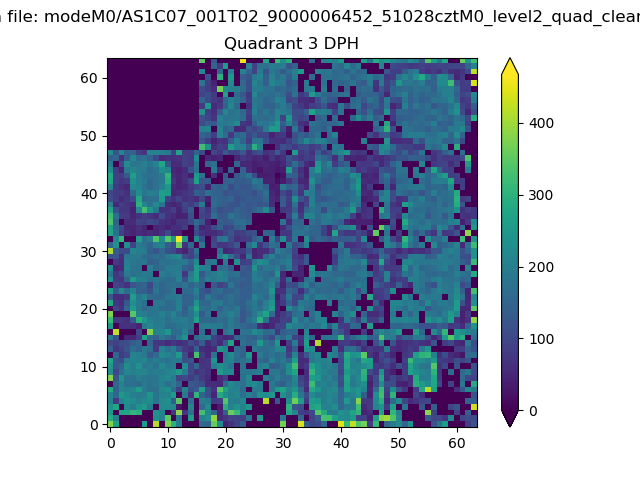 |
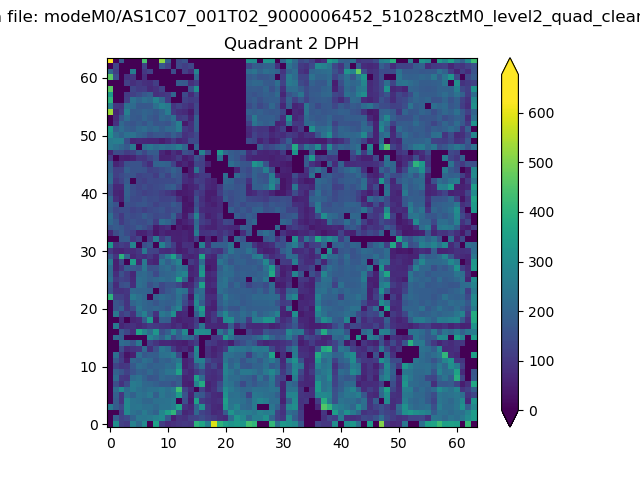 |
Quadrant C |
| Plot type | Count rate plots | Images |
|---|---|---|
| Comparison with Poisson distribution Blue bars denote a histogram of data divided into 1 sec bins. Red curve is a Poisson curve with rate = median count rate of data. |
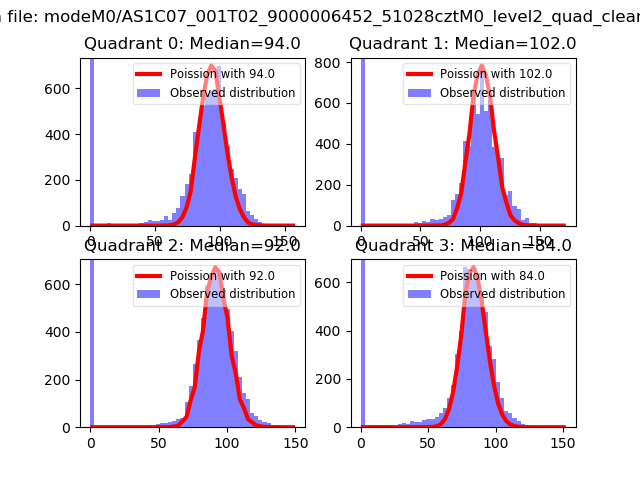 |
 |
| Quadrant-wise count rates Data is divided into 100 sec bins |
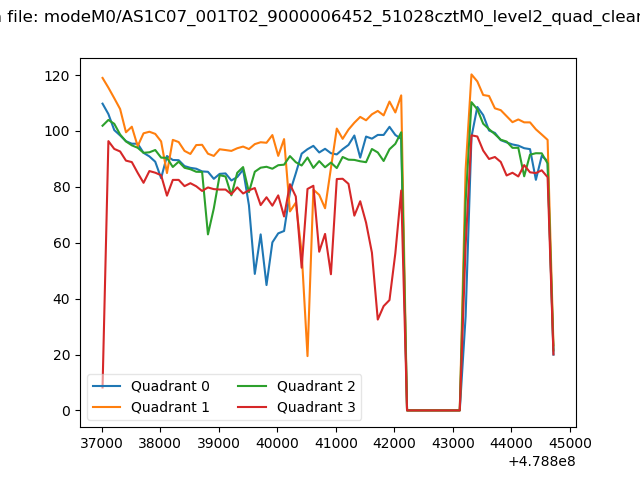 |
|
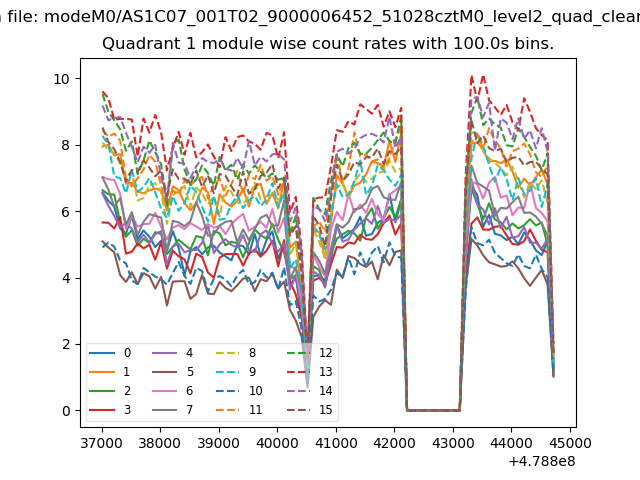
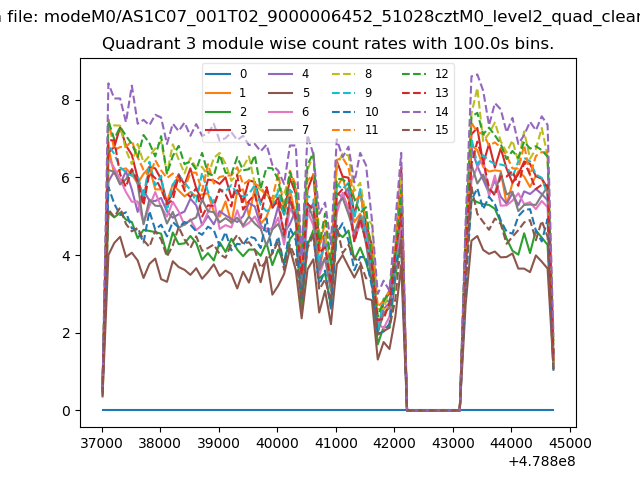
| Module-wise count rates for Quadrant A Data is divided into 100 sec bins |
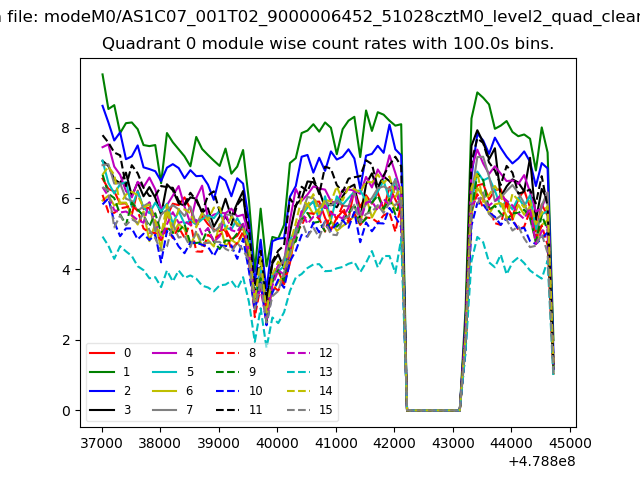 |
 |
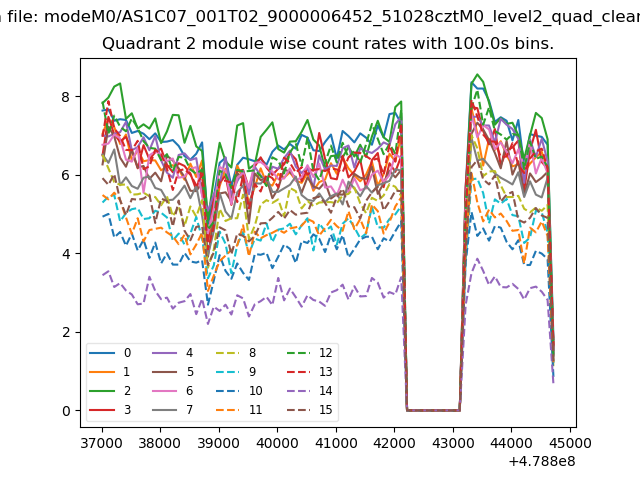
| Module-wise count rates for Quadrant B Data is divided into 100 sec bins |
 |
 |
| Module-wise count rates for Quadrant C Data is divided into 100 sec bins |
 |
 |
| Module-wise count rates for Quadrant D Data is divided into 100 sec bins |
 |
 |
| Parameter | Plot |
|---|---|
| CZT HV Monitor | 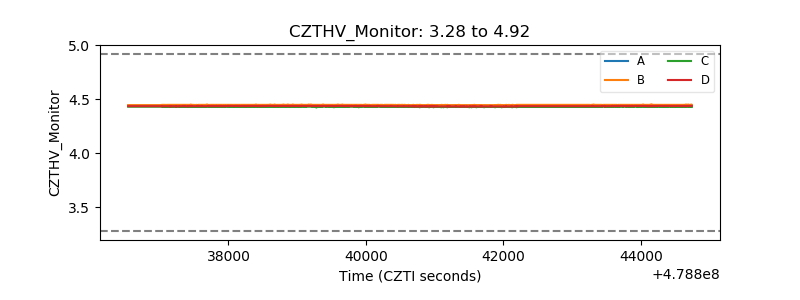 |
| D_VDD | 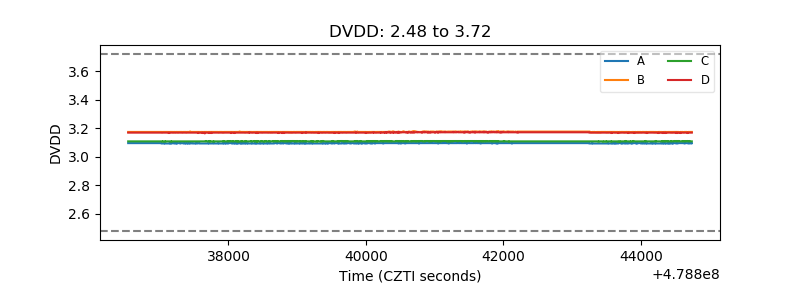 |
| Temperature 1 | 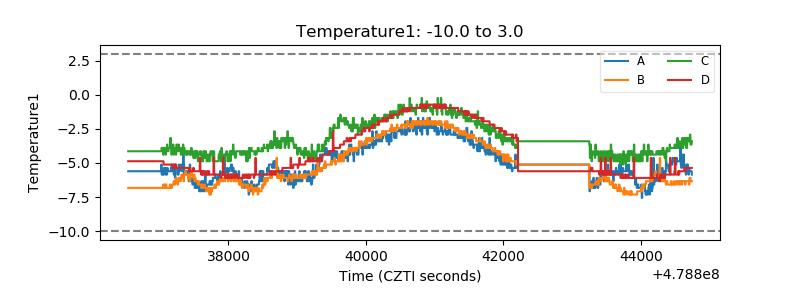 |
| Veto HV Monitor | 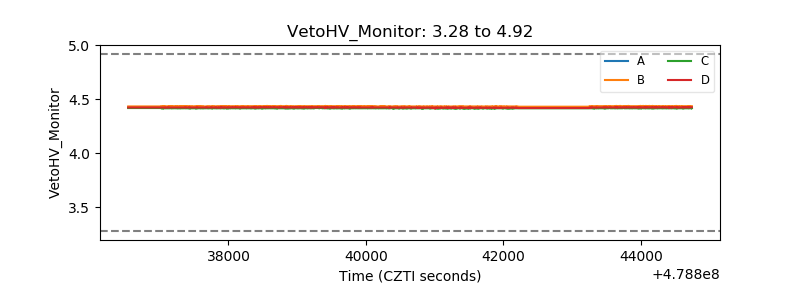 |
| Veto LLD | 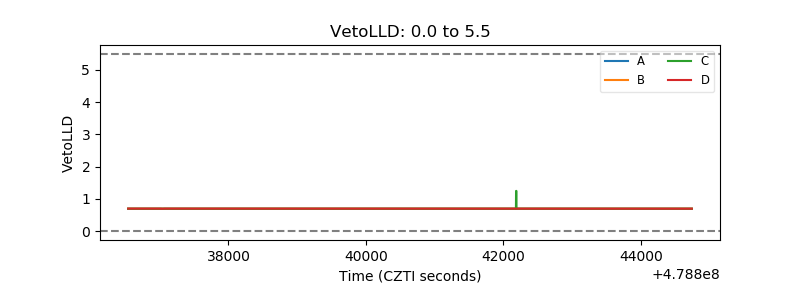 |
| Alpha Counter | 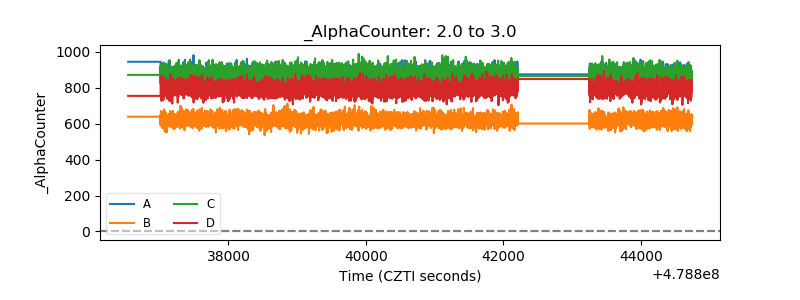 |
| _CPM_Rate | 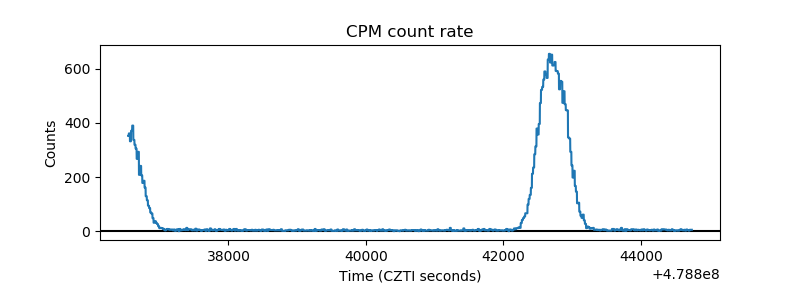 |
| CZT Counter | 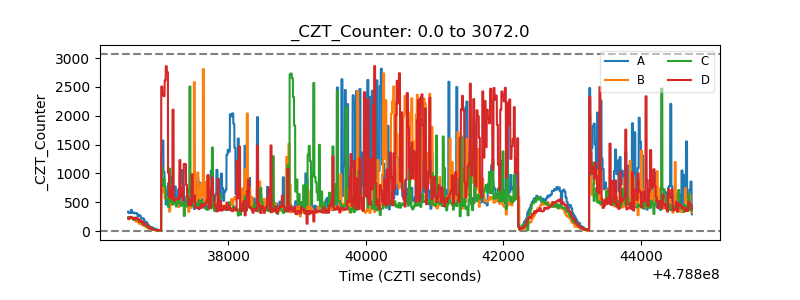 |
| +2.5 Volts monitor | 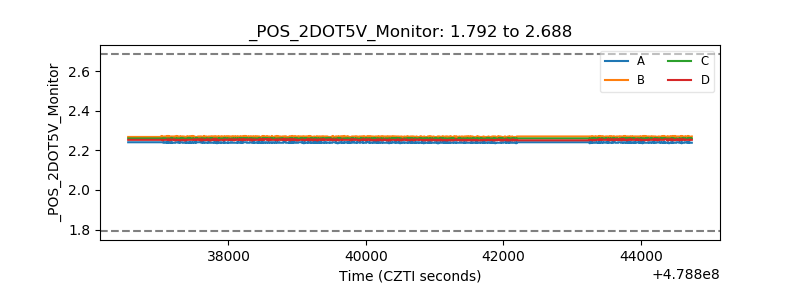 |
| +5 Volts monitor | 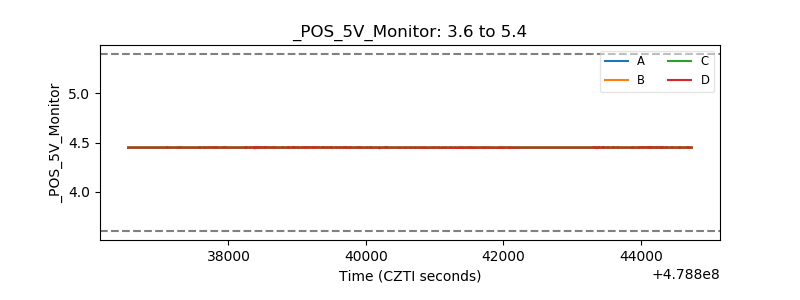 |
| _ROLL_ROT | 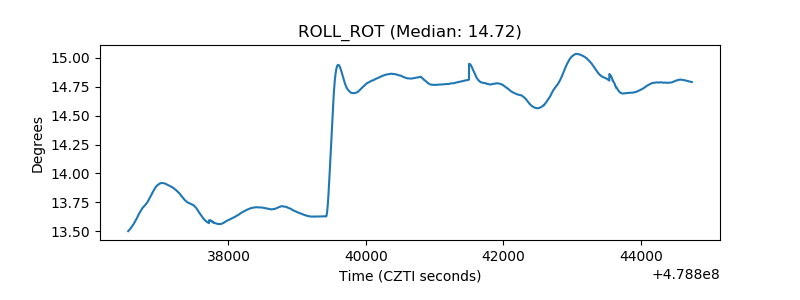 |
| _Roll_DEC | 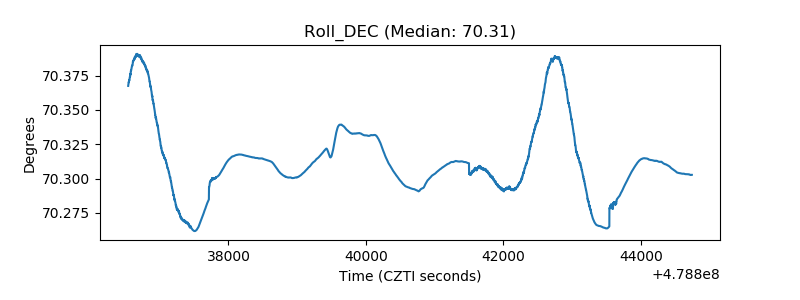 |
| _Roll_RA | 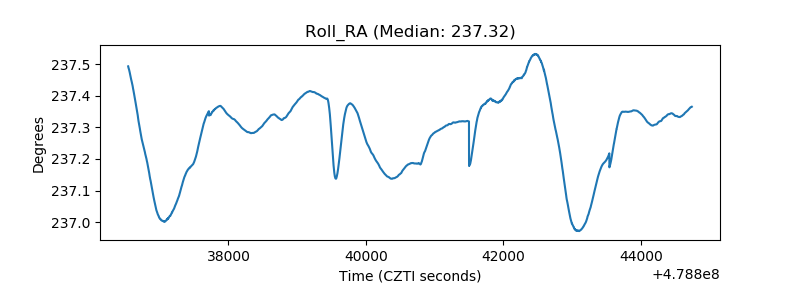 |
| Veto Counter | 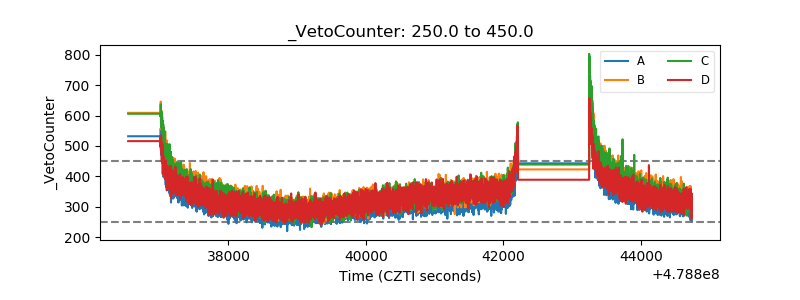 |