| Param | Original file | Final file |
|---|---|---|
| Filename | modeM0/AS1C07_001T02_9000006452_51030cztM0_level2.fits | modeM0/AS1C07_001T02_9000006452_51030cztM0_level2_quad_clean.evt |
| Size (bytes) | 500,777,280 | 87,091,200 |
| Size | 477.6 MB | 83.1 MB |
| Events in quadrant A | 4,405,151 | 583,293 |
| Events in quadrant B | 5,304,516 | 564,850 |
| Events in quadrant C | 4,006,508 | 549,781 |
| Events in quadrant D | 4,351,971 | 516,832 |
| Mode SS | |||
|---|---|---|---|
| Quadrant | BADHDUFLAG | Total packets | Discarded packets |
| A | 0 | 124 | 0 |
| B | 0 | 124 | 0 |
| C | 0 | 124 | 0 |
| D | 0 | 124 | 0 |
| Mode M9 | |||
|---|---|---|---|
| Quadrant | BADHDUFLAG | Total packets | Discarded packets |
| A | 0 | 11 | 0 |
| B | 0 | 11 | 0 |
| C | 0 | 11 | 0 |
| D | 0 | 11 | 0 |
| Mode M0 | |||
|---|---|---|---|
| Quadrant | BADHDUFLAG | Total packets | Discarded packets |
| A | 0 | 17281 | 1 |
| B | 0 | 19977 | 1 |
| C | 0 | 16255 | 1 |
| D | 0 | 17297 | 1 |
| Quadrant | Total seconds | Saturated seconds | Saturation percentage |
|---|---|---|---|
| A | 6043 | 138 | 2.283634% |
| B | 6043 | 871 | 14.413371% |
| C | 6043 | 281 | 4.650008% |
| D | 6042 | 274 | 4.534922% |
Noise dominated data is calculated using 1-second bins in cleaned event files. If a bin has >2000 counts, and if more than 50% of those come from <1% of pixels, then it is considered to be noise-dominated and hence unusable.
| Quadrant | # 1 sec bins | Bins with >0 counts | Bins with >2000 counts | High rate bins dominated by noise | Noise dominated (total time) | Noise dominated (detector-on time) | Marked lightcurve |
|---|---|---|---|---|---|---|---|
| A | 7203 | 6044 | 95 | 95 | 1.32% | 1.57% | 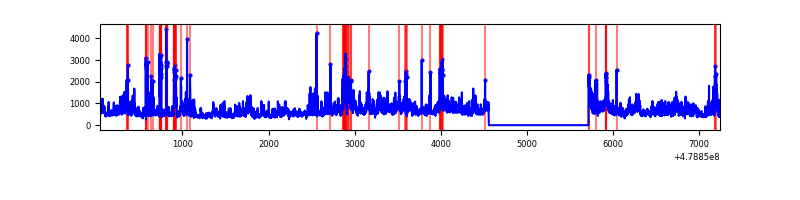 |
| B | 7203 | 6044 | 660 | 660 | 9.16% | 10.92% | 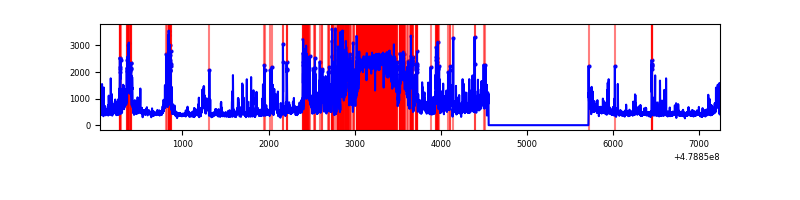 |
| C | 7203 | 6044 | 228 | 228 | 3.17% | 3.77% | 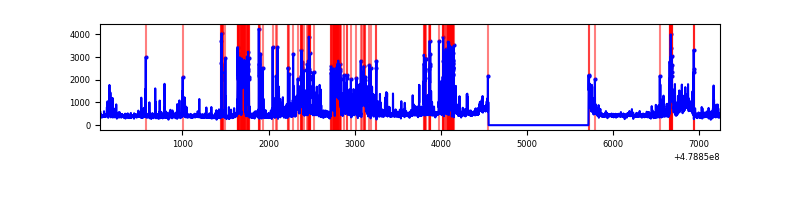 |
| D | 7202 | 6043 | 248 | 248 | 3.44% | 4.10% | 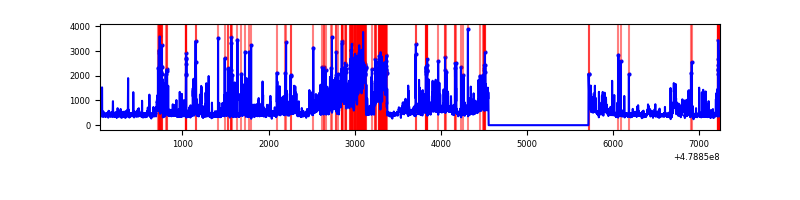 |
Top three noisy pixels from each quadrant. If the there are fewer than three noisy pixels in the level2.evt file, extra rows are filled as -1
| Pixel properties | Quadrant properties | ||||||
|---|---|---|---|---|---|---|---|
| Quadrant | DetID | PixID | Counts | Sigma | Mean | Median | Sigma |
| A | 12 | 3 | 909680 | 5715.15 | 635 | 620 | 159.1 |
| A | 4 | 3 | 188265 | 1179.7 | 635 | 620 | 159.1 |
| A | 13 | 248 | 144791 | 906.38 | 635 | 620 | 159.1 |
| B | 12 | 32 | 1420082 | 11199.24 | 596 | 577 | 126.8 |
| B | 4 | 81 | 1119786 | 8830.04 | 596 | 577 | 126.8 |
| B | 5 | 185 | 137036 | 1076.6 | 596 | 577 | 126.8 |
| C | 15 | 157 | 576677 | 3420.72 | 605 | 600 | 168.4 |
| C | 9 | 38 | 561536 | 3330.81 | 605 | 600 | 168.4 |
| C | 1 | 44 | 94448 | 557.26 | 605 | 600 | 168.4 |
| D | 12 | 128 | 858106 | 5115.1 | 603 | 582 | 167.6 |
| D | 2 | 216 | 265541 | 1580.47 | 603 | 582 | 167.6 |
| D | 10 | 181 | 154521 | 918.24 | 603 | 582 | 167.6 |
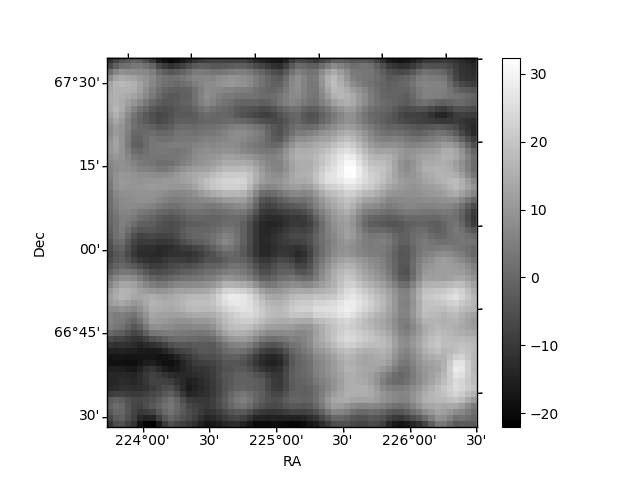
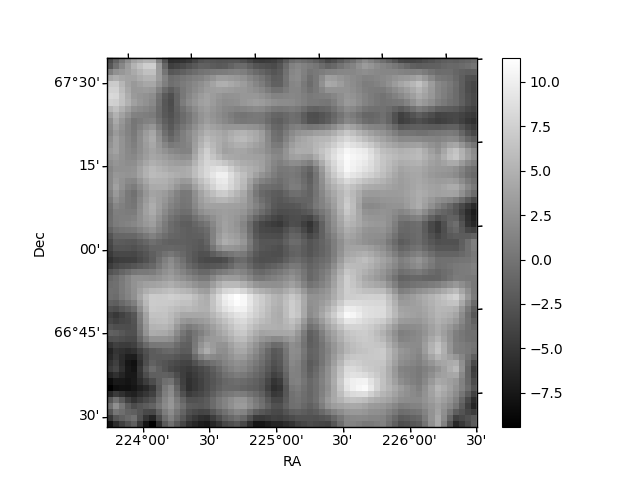
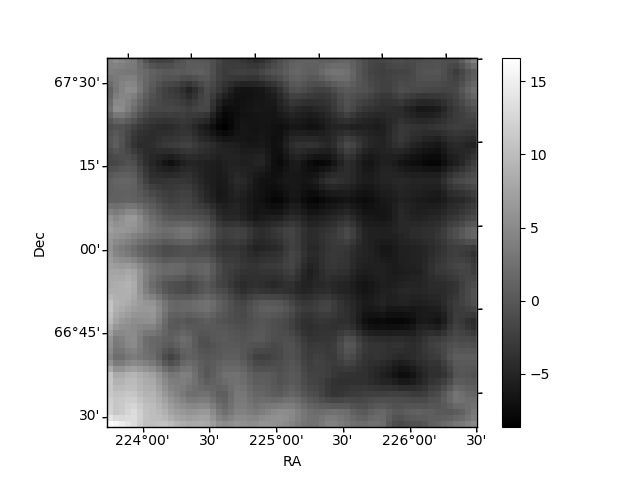
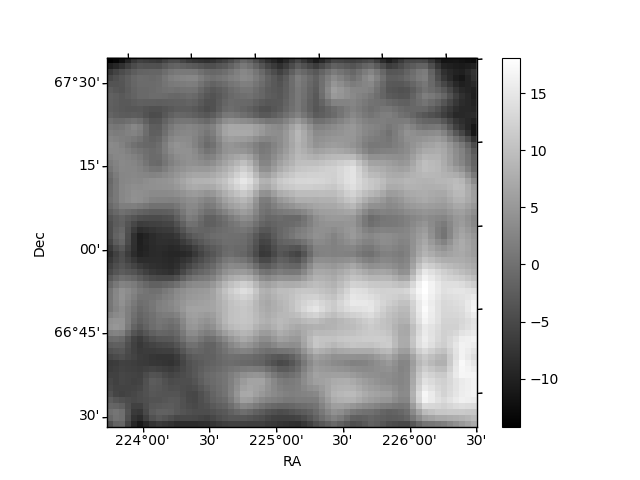
Histogram calculated using DETX and DETY for each event in the final _common_clean file
| Quadrant A | 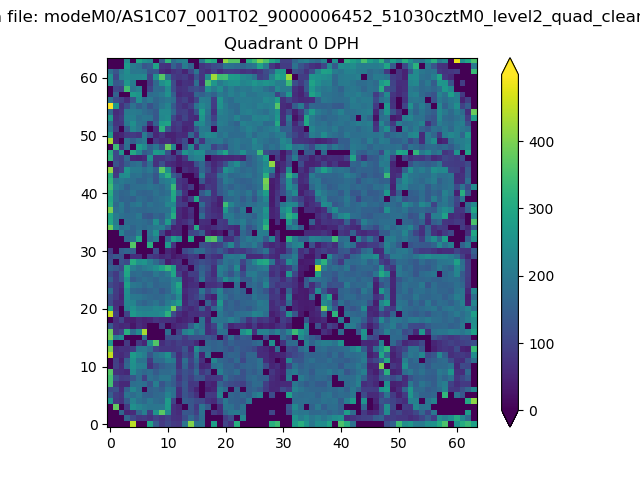 |
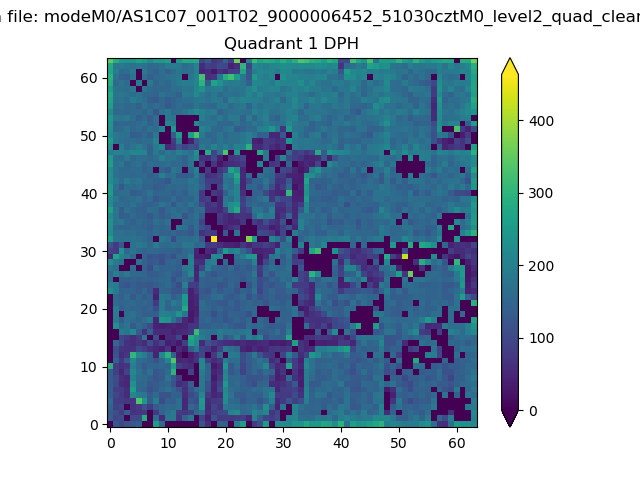 |
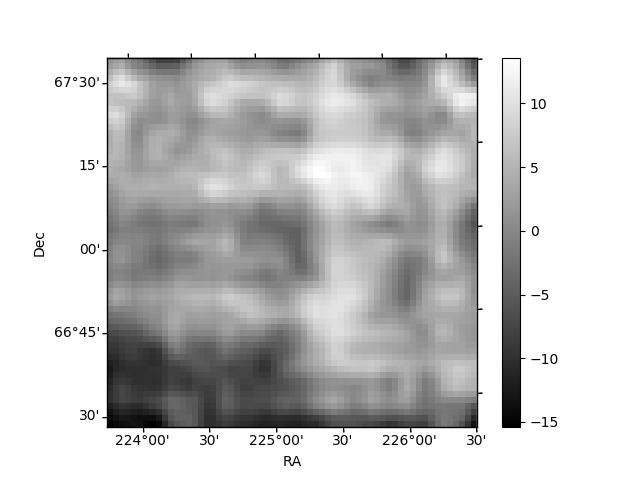
Quadrant B |
|---|---|---|---|
| Quadrant D | 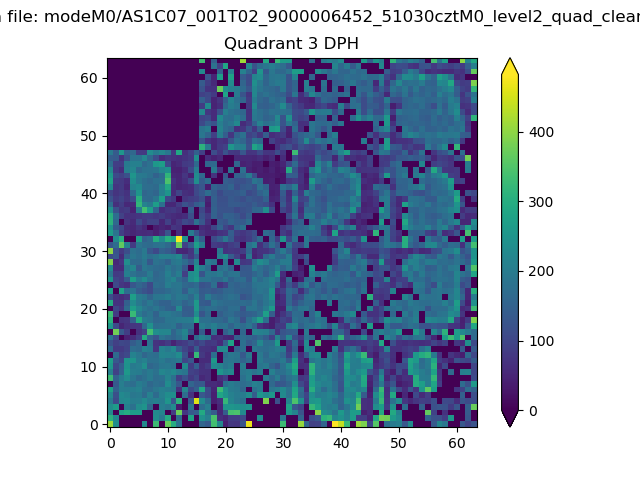 |
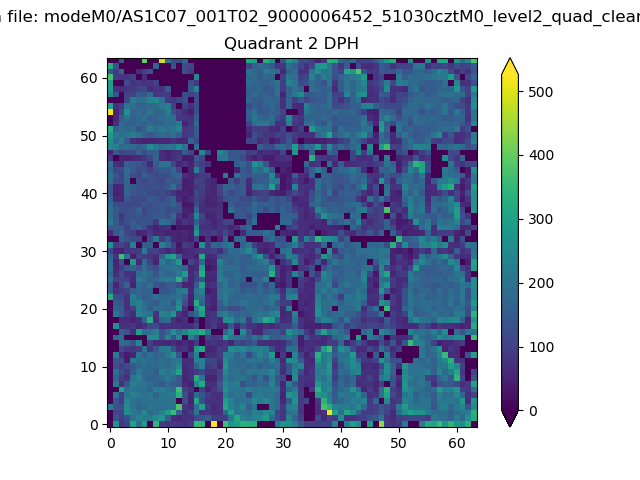 |
Quadrant C |
| Plot type | Count rate plots | Images |
|---|---|---|
| Comparison with Poisson distribution Blue bars denote a histogram of data divided into 1 sec bins. Red curve is a Poisson curve with rate = median count rate of data. |
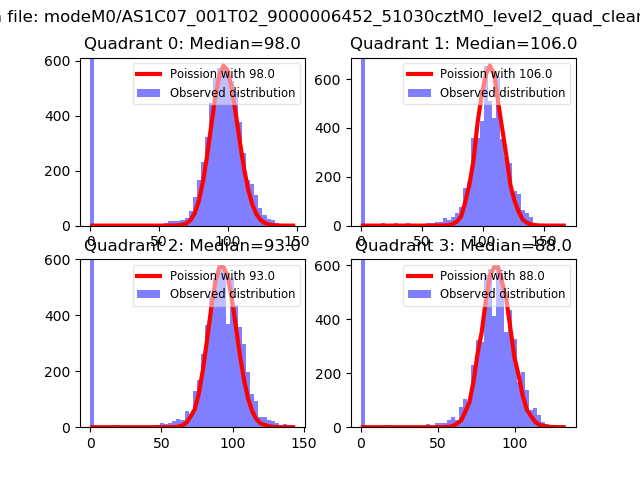 |
 |
| Quadrant-wise count rates Data is divided into 100 sec bins |
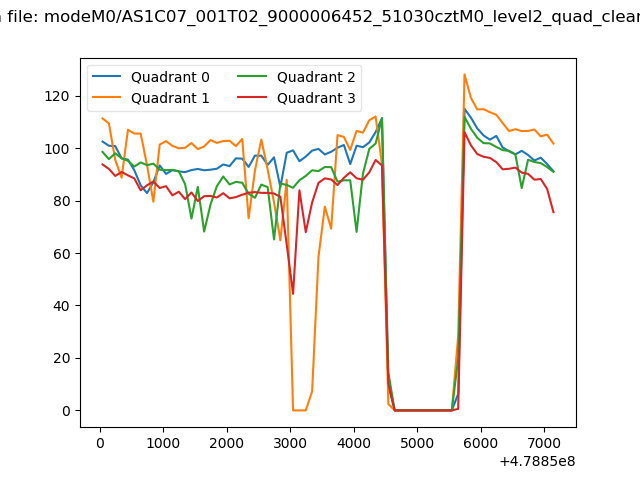 |
|
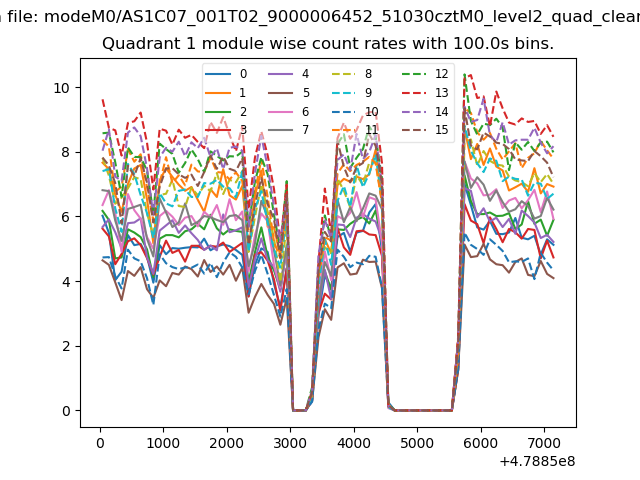
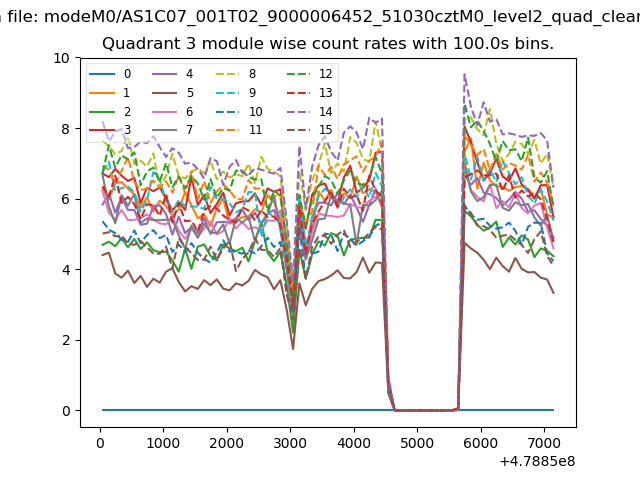
| Module-wise count rates for Quadrant A Data is divided into 100 sec bins |
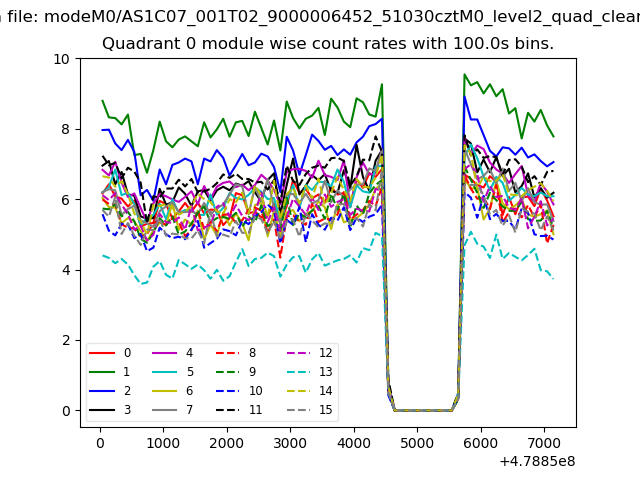 |
 |
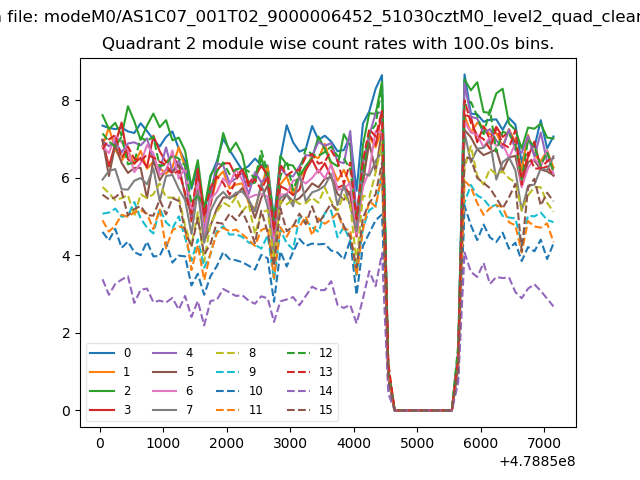
| Module-wise count rates for Quadrant B Data is divided into 100 sec bins |
 |
 |
| Module-wise count rates for Quadrant C Data is divided into 100 sec bins |
 |
 |
| Module-wise count rates for Quadrant D Data is divided into 100 sec bins |
 |
 |
| Parameter | Plot |
|---|---|
| CZT HV Monitor | 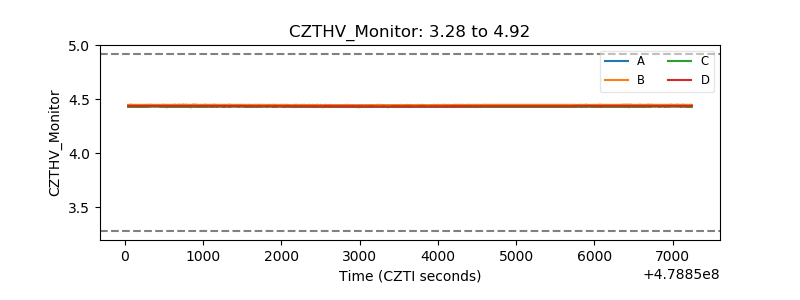 |
| D_VDD | 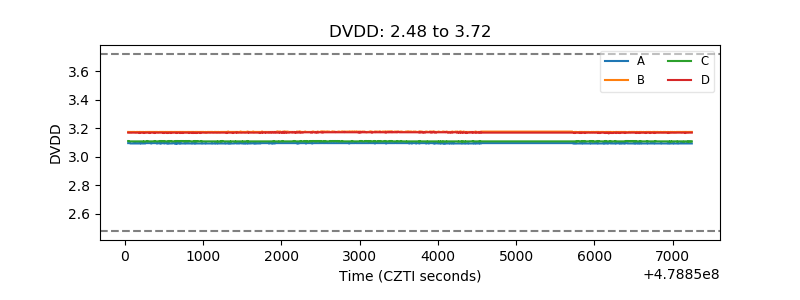 |
| Temperature 1 | 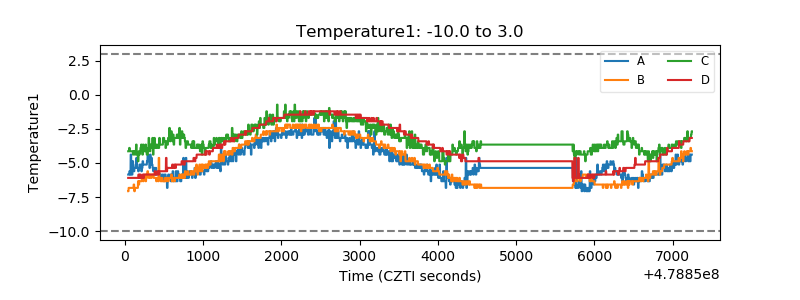 |
| Veto HV Monitor | 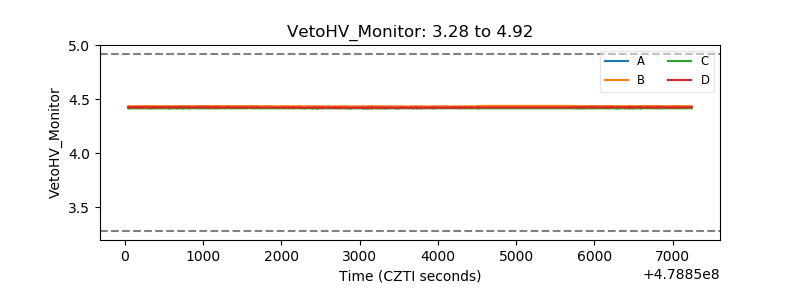 |
| Veto LLD | 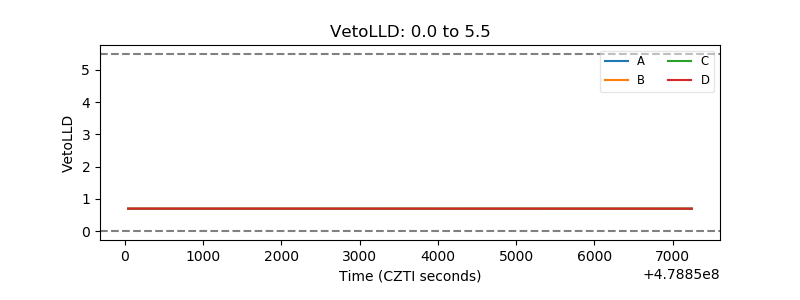 |
| Alpha Counter | 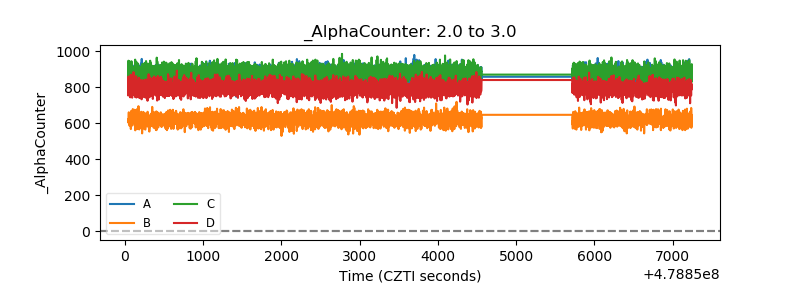 |
| _CPM_Rate | 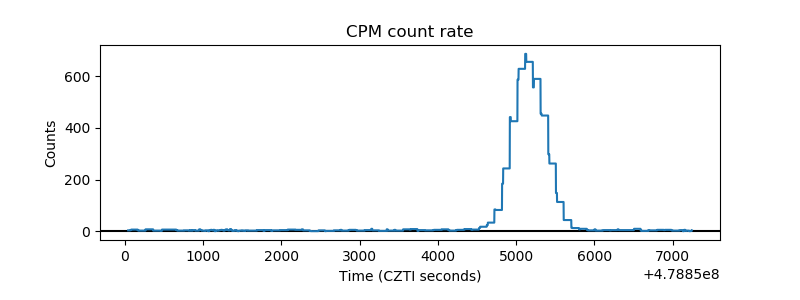 |
| CZT Counter | 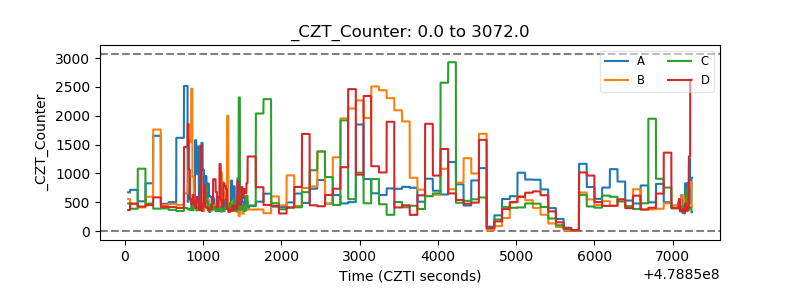 |
| +2.5 Volts monitor | 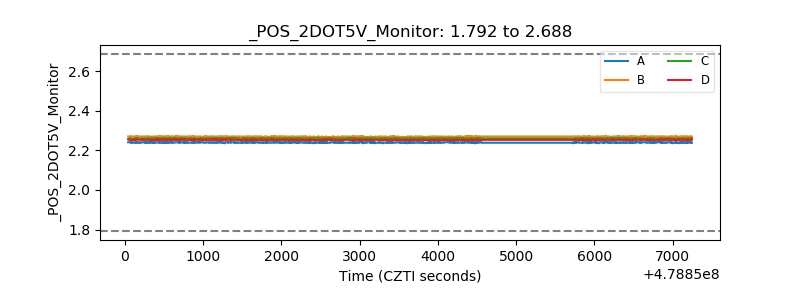 |
| +5 Volts monitor | 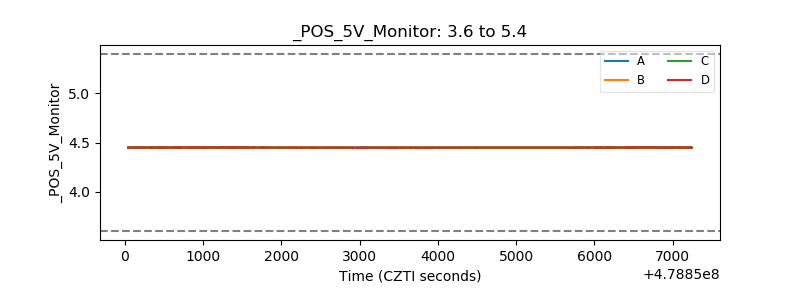 |
| _ROLL_ROT | 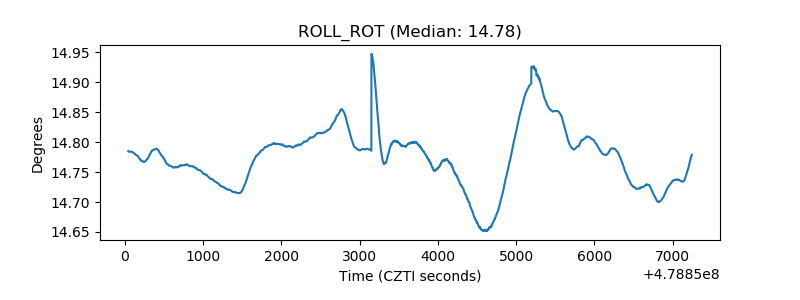 |
| _Roll_DEC | 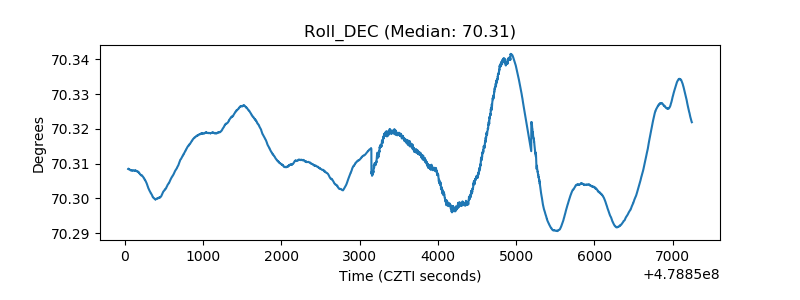 |
| _Roll_RA | 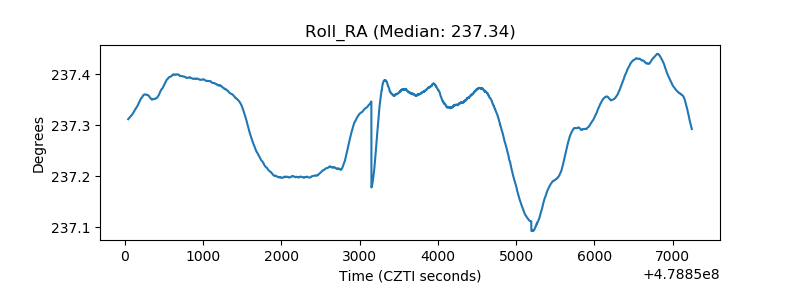 |
| Veto Counter | 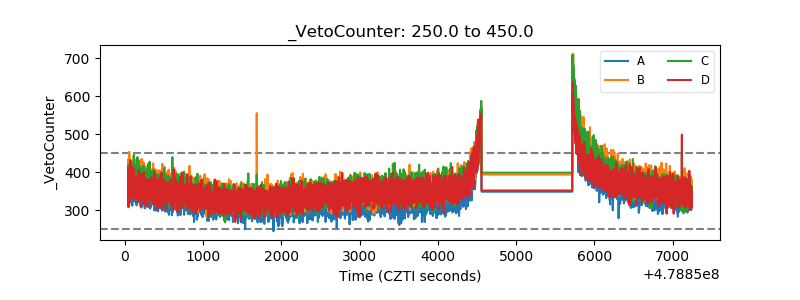 |