| Param | Original file | Final file |
|---|---|---|
| Filename | modeM0/AS1C07_001T02_9000006452_51031cztM0_level2.fits | modeM0/AS1C07_001T02_9000006452_51031cztM0_level2_quad_clean.evt |
| Size (bytes) | 577,589,760 | 86,984,640 |
| Size | 550.8 MB | 83.0 MB |
| Events in quadrant A | 5,047,038 | 598,116 |
| Events in quadrant B | 4,891,758 | 627,056 |
| Events in quadrant C | 7,204,771 | 425,836 |
| Events in quadrant D | 3,750,615 | 545,143 |
| Mode SS | |||
|---|---|---|---|
| Quadrant | BADHDUFLAG | Total packets | Discarded packets |
| A | 0 | 128 | 0 |
| B | 0 | 128 | 0 |
| C | 0 | 128 | 0 |
| D | 0 | 128 | 0 |
| Mode M9 | |||
|---|---|---|---|
| Quadrant | BADHDUFLAG | Total packets | Discarded packets |
| A | 0 | 11 | 0 |
| B | 0 | 11 | 0 |
| C | 0 | 11 | 0 |
| D | 0 | 11 | 0 |
| Mode M0 | |||
|---|---|---|---|
| Quadrant | BADHDUFLAG | Total packets | Discarded packets |
| A | 0 | 19321 | 1 |
| B | 0 | 18898 | 1 |
| C | 0 | 25901 | 7 |
| D | 0 | 15627 | 1 |
| Quadrant | Total seconds | Saturated seconds | Saturation percentage |
|---|---|---|---|
| A | 6268 | 255 | 4.068283% |
| B | 6268 | 503 | 8.024888% |
| C | 6265 | 1856 | 29.624900% |
| D | 6268 | 157 | 2.504786% |
Noise dominated data is calculated using 1-second bins in cleaned event files. If a bin has >2000 counts, and if more than 50% of those come from <1% of pixels, then it is considered to be noise-dominated and hence unusable.
| Quadrant | # 1 sec bins | Bins with >0 counts | Bins with >2000 counts | High rate bins dominated by noise | Noise dominated (total time) | Noise dominated (detector-on time) | Marked lightcurve |
|---|---|---|---|---|---|---|---|
| A | 7388 | 6269 | 168 | 168 | 2.27% | 2.68% | 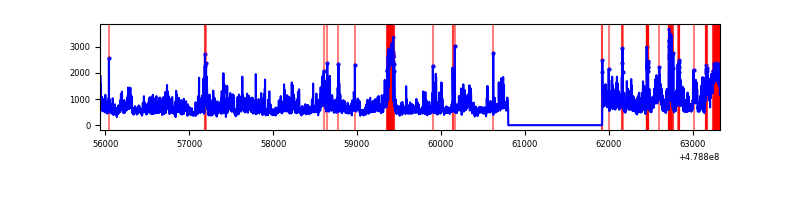 |
| B | 7388 | 6269 | 324 | 324 | 4.39% | 5.17% | 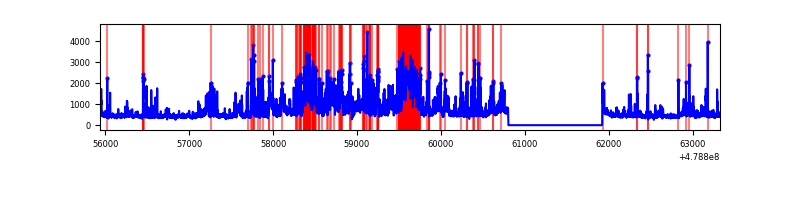 |
| C | 7388 | 6267 | 1759 | 1759 | 23.81% | 28.07% |  |
| D | 7388 | 6269 | 112 | 112 | 1.52% | 1.79% | 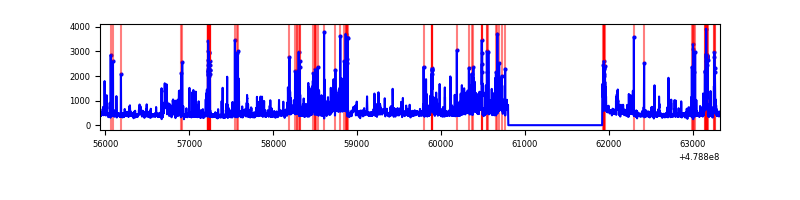 |
Top three noisy pixels from each quadrant. If the there are fewer than three noisy pixels in the level2.evt file, extra rows are filled as -1
| Pixel properties | Quadrant properties | ||||||
|---|---|---|---|---|---|---|---|
| Quadrant | DetID | PixID | Counts | Sigma | Mean | Median | Sigma |
| A | 12 | 3 | 1172086 | 7107.69 | 661 | 646 | 164.8 |
| A | 12 | 80 | 335936 | 2034.36 | 661 | 646 | 164.8 |
| A | 3 | 110 | 170217 | 1028.87 | 661 | 646 | 164.8 |
| B | 12 | 32 | 895905 | 6482.55 | 643 | 620 | 138.1 |
| B | 4 | 81 | 797782 | 5772.06 | 643 | 620 | 138.1 |
| B | 1 | 223 | 126962 | 914.81 | 643 | 620 | 138.1 |
| C | 9 | 38 | 4112110 | 26295.95 | 564 | 560 | 156.4 |
| C | 6 | 13 | 274813 | 1754.02 | 564 | 560 | 156.4 |
| C | 14 | 96 | 174984 | 1115.55 | 564 | 560 | 156.4 |
| D | 9 | 1 | 243730 | 1358.94 | 637 | 615 | 178.9 |
| D | 2 | 216 | 230764 | 1286.46 | 637 | 615 | 178.9 |
| D | 10 | 181 | 115808 | 643.89 | 637 | 615 | 178.9 |
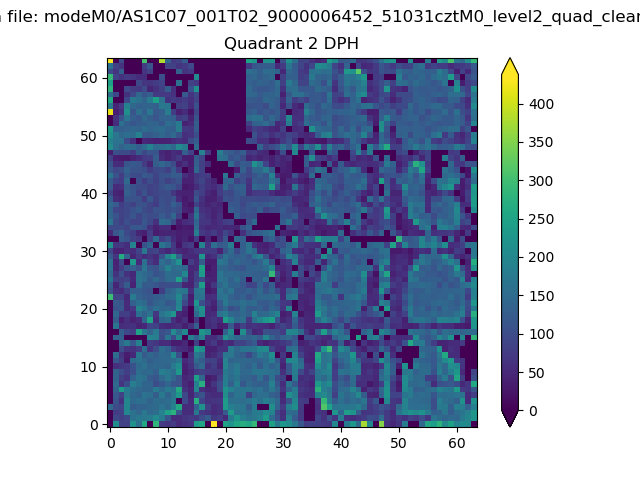
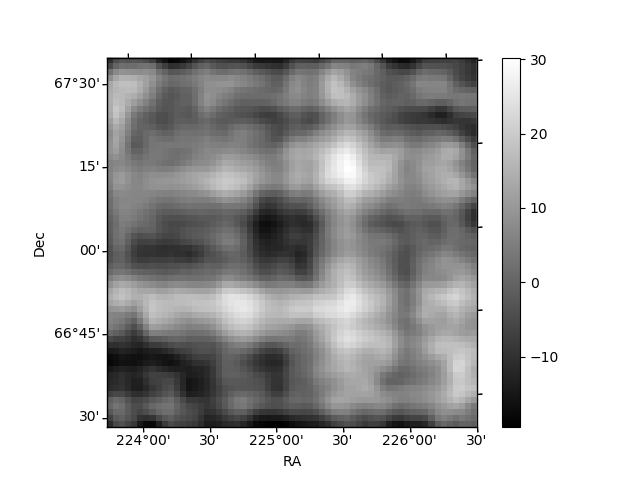
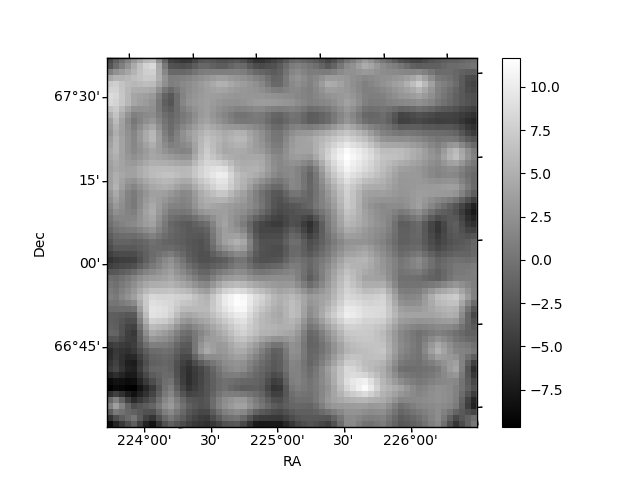
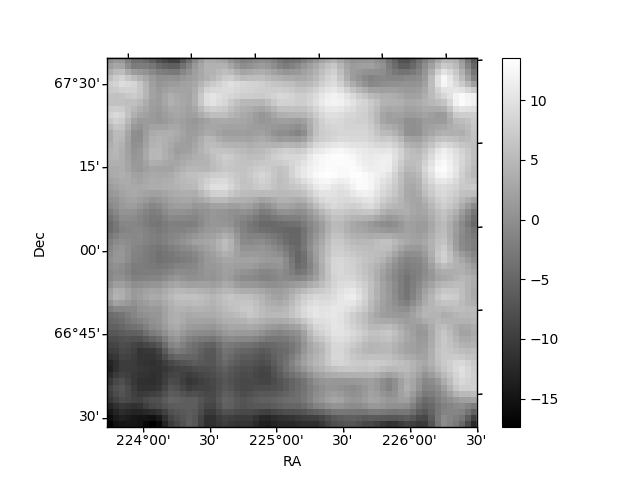
Histogram calculated using DETX and DETY for each event in the final _common_clean file
| Quadrant A | 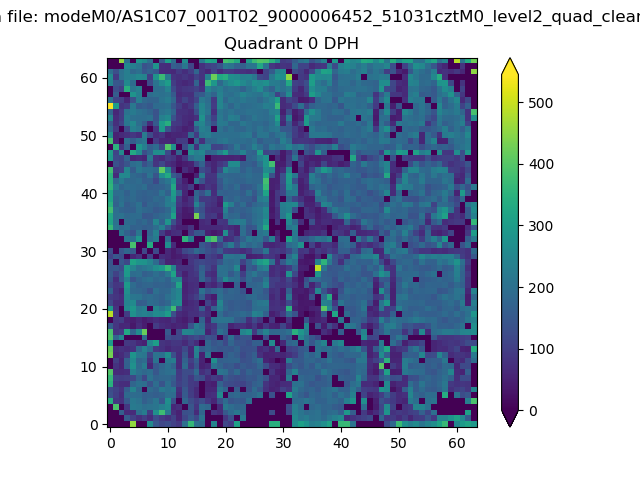 |
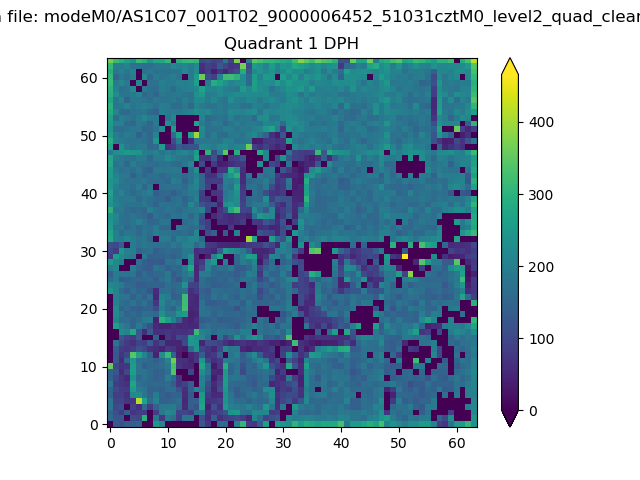 |
Quadrant B |
|---|---|---|---|
| Quadrant D | 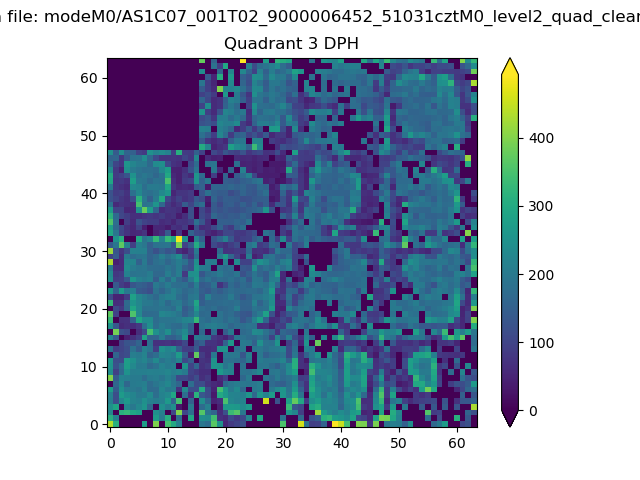 |
 |
Quadrant C |
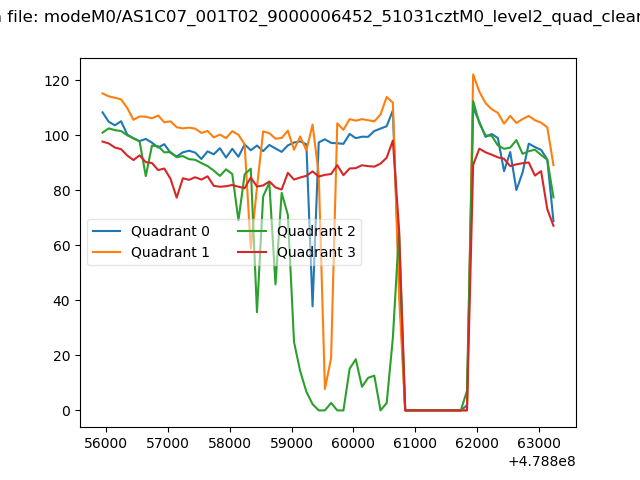
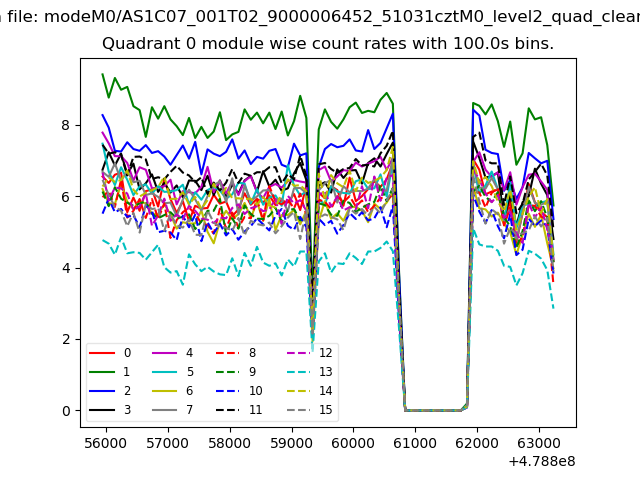
| Plot type | Count rate plots | Images |
|---|---|---|
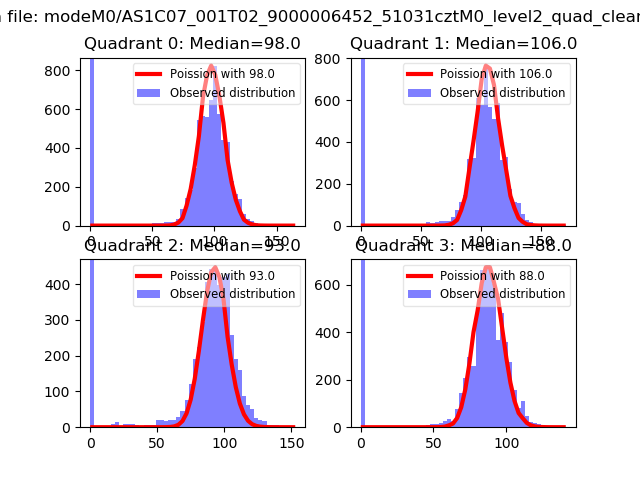
| Comparison with Poisson distribution Blue bars denote a histogram of data divided into 1 sec bins. Red curve is a Poisson curve with rate = median count rate of data. |
 |
 |
| Quadrant-wise count rates Data is divided into 100 sec bins |
 |
|
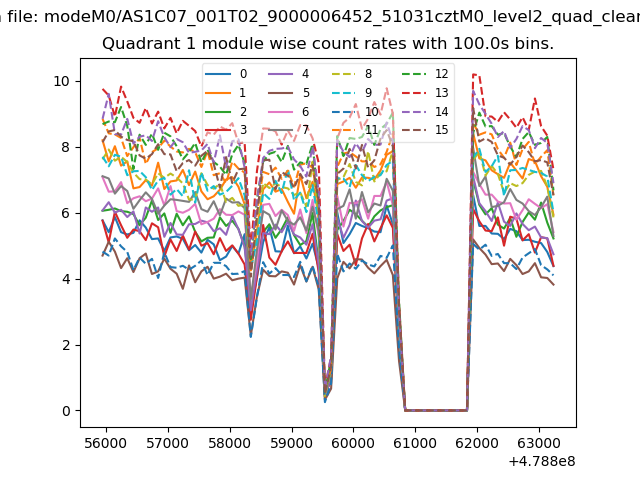
| Module-wise count rates for Quadrant A Data is divided into 100 sec bins |
 |
 |
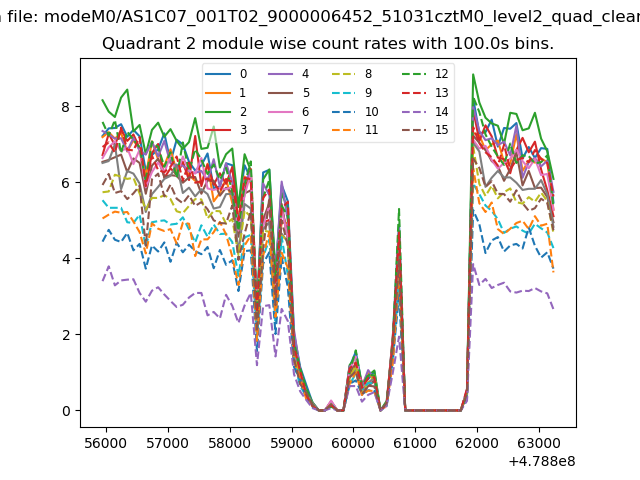
| Module-wise count rates for Quadrant B Data is divided into 100 sec bins |
 |
 |
| Module-wise count rates for Quadrant C Data is divided into 100 sec bins |
 |
 |
| Module-wise count rates for Quadrant D Data is divided into 100 sec bins |
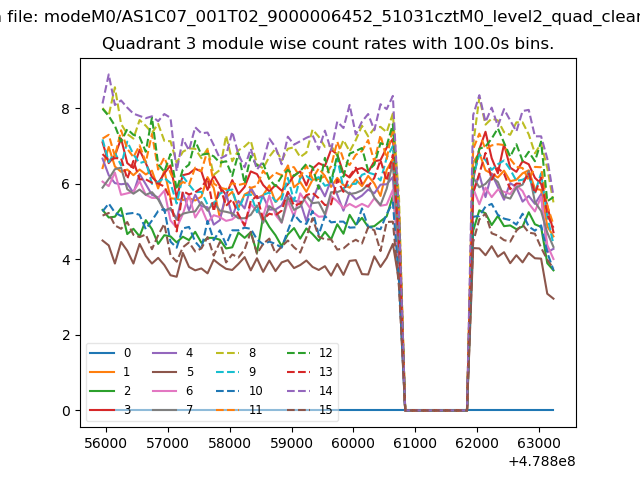 |
 |
| Parameter | Plot |
|---|---|
| CZT HV Monitor | 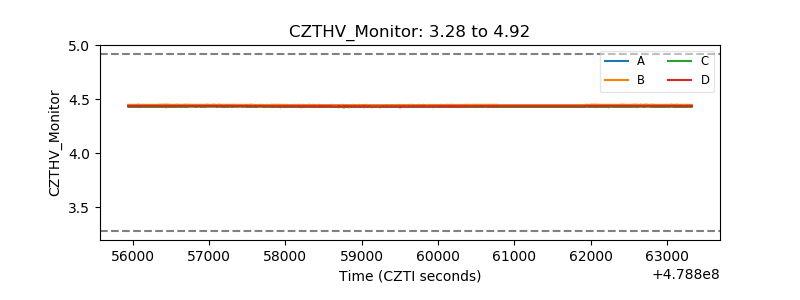 |
| D_VDD | 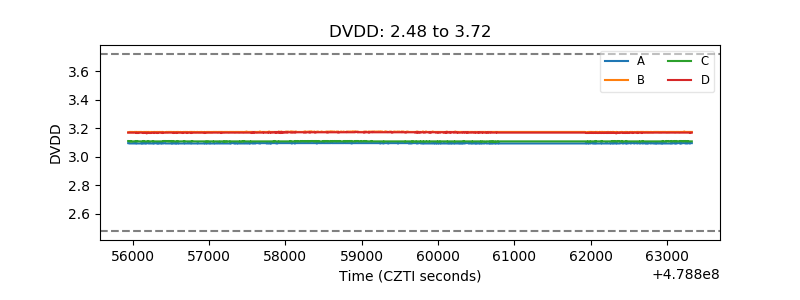 |
| Temperature 1 | 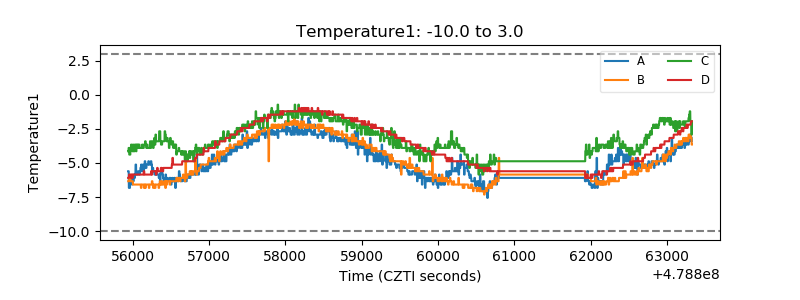 |
| Veto HV Monitor | 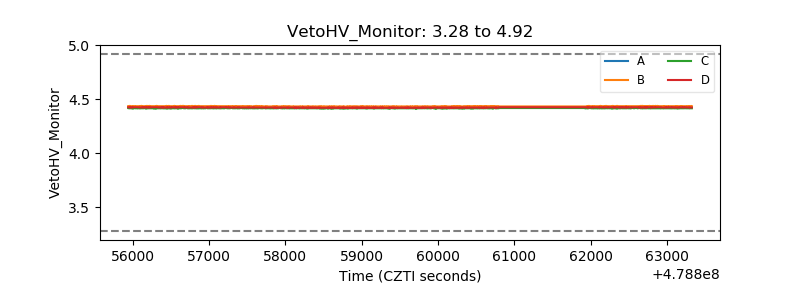 |
| Veto LLD | 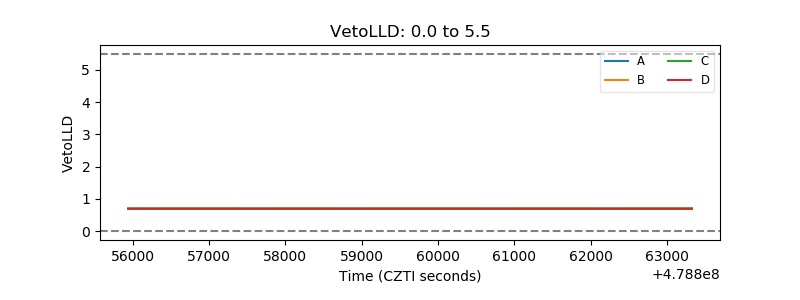 |
| Alpha Counter | 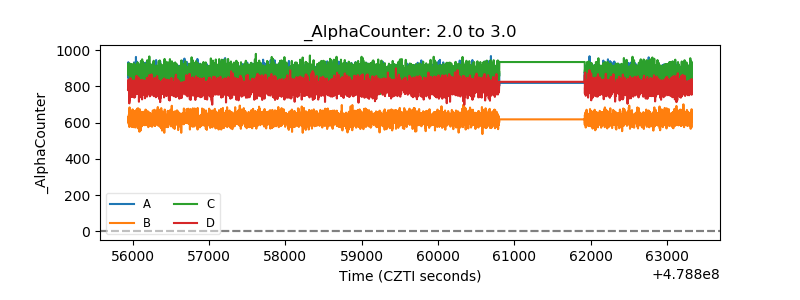 |
| _CPM_Rate | 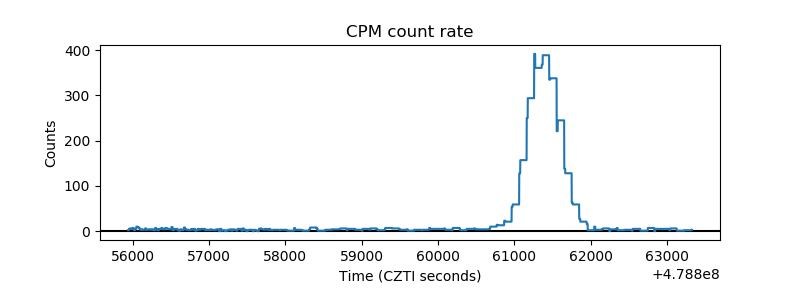 |
| CZT Counter | 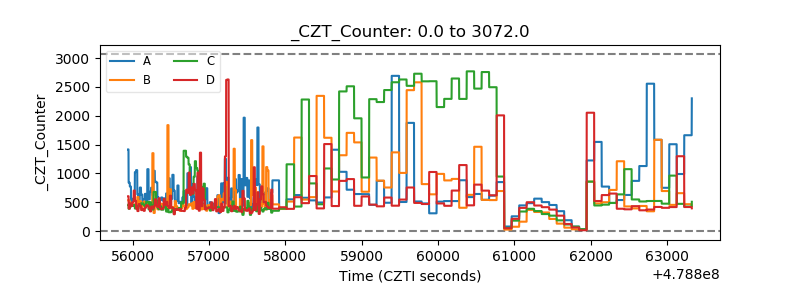 |
| +2.5 Volts monitor | 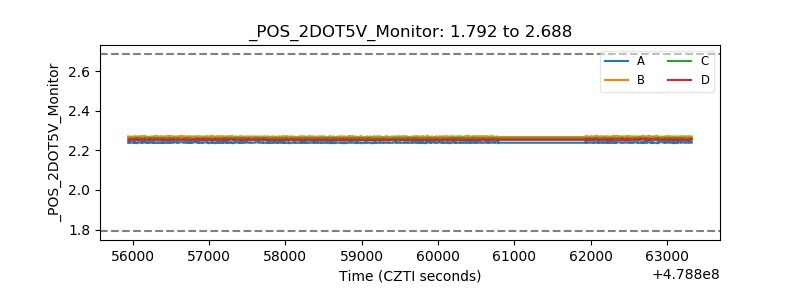 |
| +5 Volts monitor | 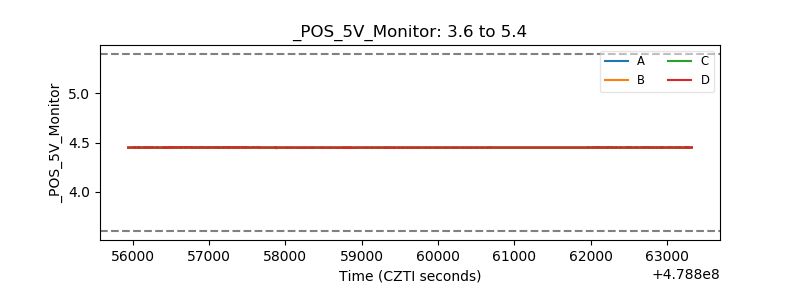 |
| _ROLL_ROT | 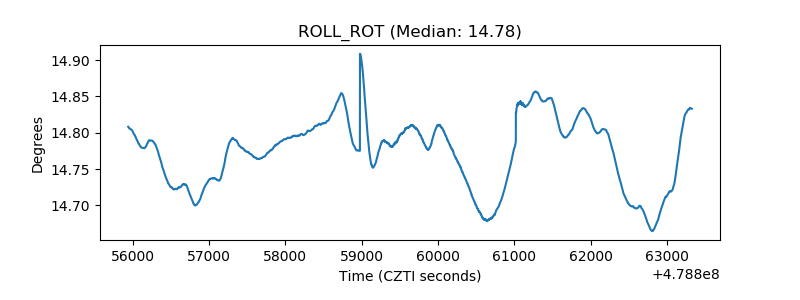 |
| _Roll_DEC | 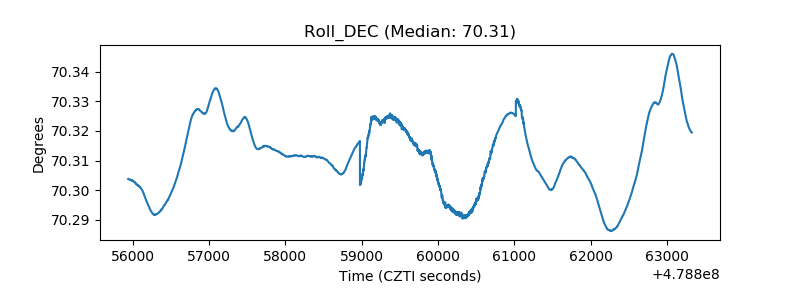 |
| _Roll_RA | 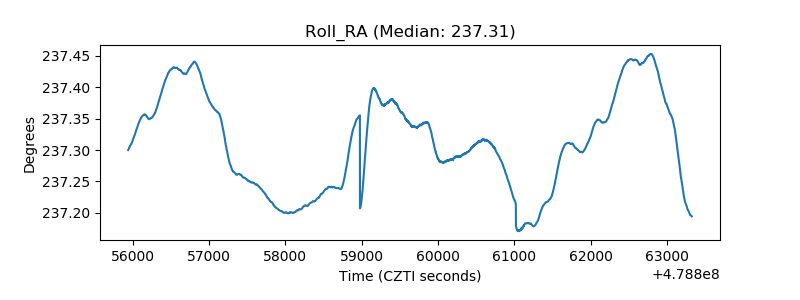 |
| Veto Counter | 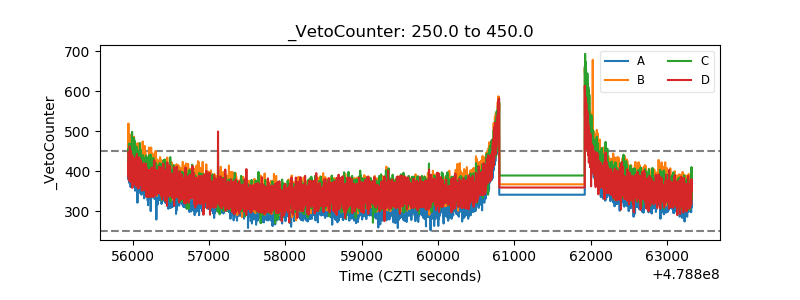 |