| Param | Original file | Final file |
|---|---|---|
| Filename | modeM0/AS1C07_001T02_9000006452_51032cztM0_level2.fits | modeM0/AS1C07_001T02_9000006452_51032cztM0_level2_quad_clean.evt |
| Size (bytes) | 594,682,560 | 93,562,560 |
| Size | 567.1 MB | 89.2 MB |
| Events in quadrant A | 6,439,796 | 622,360 |
| Events in quadrant B | 6,304,158 | 573,926 |
| Events in quadrant C | 4,383,041 | 606,542 |
| Events in quadrant D | 4,364,709 | 561,555 |
| Mode SS | |||
|---|---|---|---|
| Quadrant | BADHDUFLAG | Total packets | Discarded packets |
| A | 0 | 136 | 0 |
| B | 0 | 136 | 0 |
| C | 0 | 136 | 0 |
| D | 0 | 136 | 0 |
| Mode M9 | |||
|---|---|---|---|
| Quadrant | BADHDUFLAG | Total packets | Discarded packets |
| A | 0 | 10 | 0 |
| B | 0 | 11 | 0 |
| C | 0 | 11 | 0 |
| D | 0 | 11 | 0 |
| Mode M0 | |||
|---|---|---|---|
| Quadrant | BADHDUFLAG | Total packets | Discarded packets |
| A | 0 | 23930 | 2 |
| B | 0 | 23368 | 2 |
| C | 0 | 17862 | 2 |
| D | 0 | 17683 | 2 |
| Quadrant | Total seconds | Saturated seconds | Saturation percentage |
|---|---|---|---|
| A | 6724 | 403 | 5.993456% |
| B | 6724 | 1372 | 20.404521% |
| C | 6724 | 292 | 4.342653% |
| D | 6724 | 314 | 4.669839% |
Noise dominated data is calculated using 1-second bins in cleaned event files. If a bin has >2000 counts, and if more than 50% of those come from <1% of pixels, then it is considered to be noise-dominated and hence unusable.
| Quadrant | # 1 sec bins | Bins with >0 counts | Bins with >2000 counts | High rate bins dominated by noise | Noise dominated (total time) | Noise dominated (detector-on time) | Marked lightcurve |
|---|---|---|---|---|---|---|---|
| A | 7704 | 6725 | 210 | 210 | 2.73% | 3.12% | 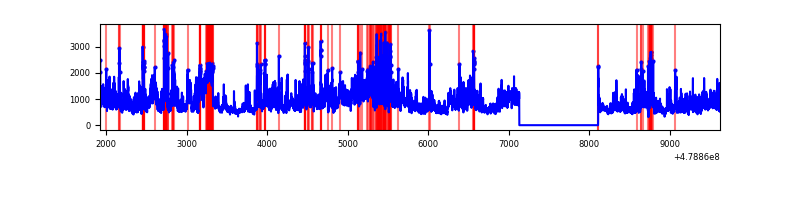 |
| B | 7704 | 6725 | 658 | 658 | 8.54% | 9.78% | 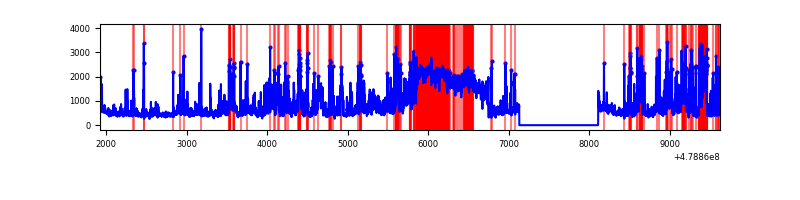 |
| C | 7704 | 6724 | 183 | 183 | 2.38% | 2.72% | 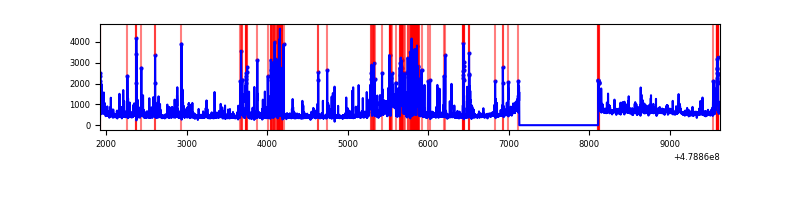 |
| D | 7704 | 6725 | 191 | 191 | 2.48% | 2.84% | 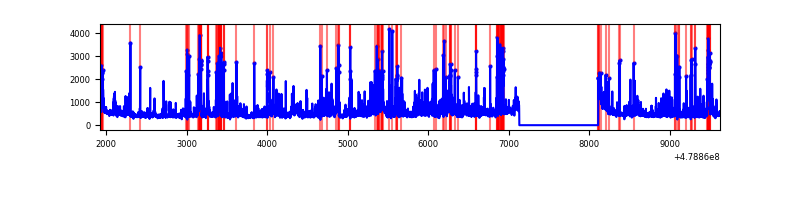 |
Top three noisy pixels from each quadrant. If the there are fewer than three noisy pixels in the level2.evt file, extra rows are filled as -1
| Pixel properties | Quadrant properties | ||||||
|---|---|---|---|---|---|---|---|
| Quadrant | DetID | PixID | Counts | Sigma | Mean | Median | Sigma |
| A | 12 | 3 | 1445663 | 8351.44 | 708 | 693 | 173.0 |
| A | 10 | 253 | 547376 | 3159.64 | 708 | 693 | 173.0 |
| A | 12 | 80 | 438333 | 2529.41 | 708 | 693 | 173.0 |
| B | 12 | 32 | 2063725 | 15516.08 | 626 | 606 | 133.0 |
| B | 4 | 81 | 953936 | 7169.7 | 626 | 606 | 133.0 |
| B | 5 | 185 | 321495 | 2413.31 | 626 | 606 | 133.0 |
| C | 15 | 157 | 300505 | 1590.8 | 686 | 679 | 188.5 |
| C | 10 | 69 | 261405 | 1383.35 | 686 | 679 | 188.5 |
| C | 15 | 147 | 192023 | 1015.22 | 686 | 679 | 188.5 |
| D | 2 | 216 | 331185 | 1726.34 | 682 | 657 | 191.5 |
| D | 9 | 1 | 211087 | 1099.07 | 682 | 657 | 191.5 |
| D | 15 | 174 | 186170 | 968.93 | 682 | 657 | 191.5 |
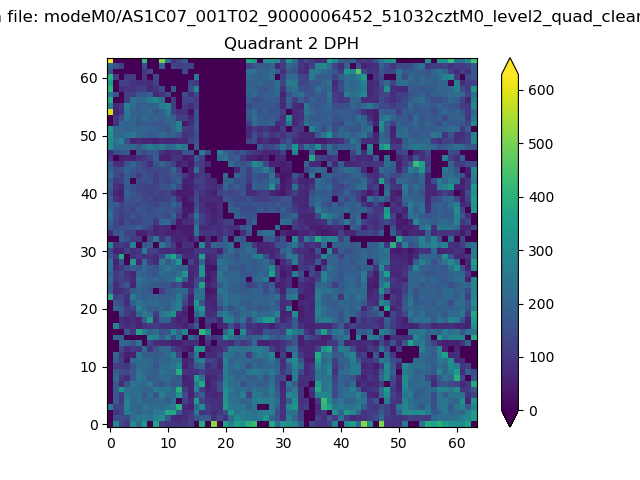
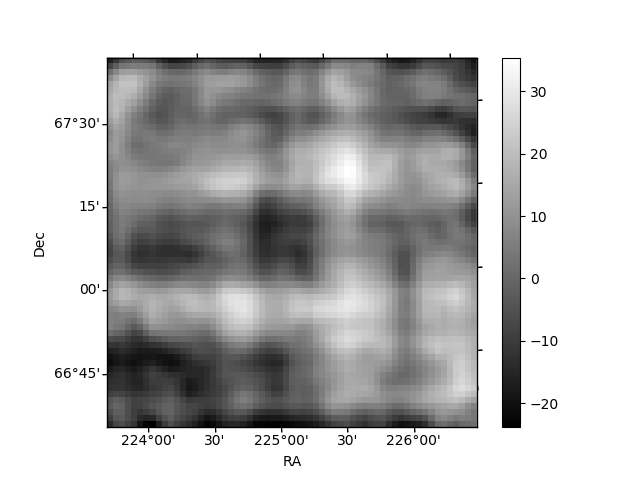
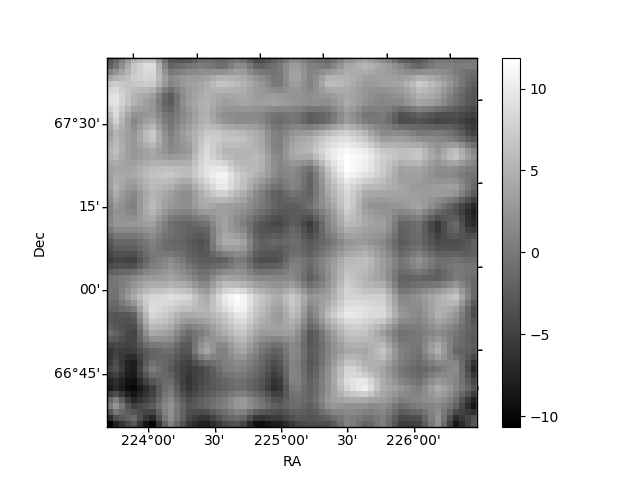
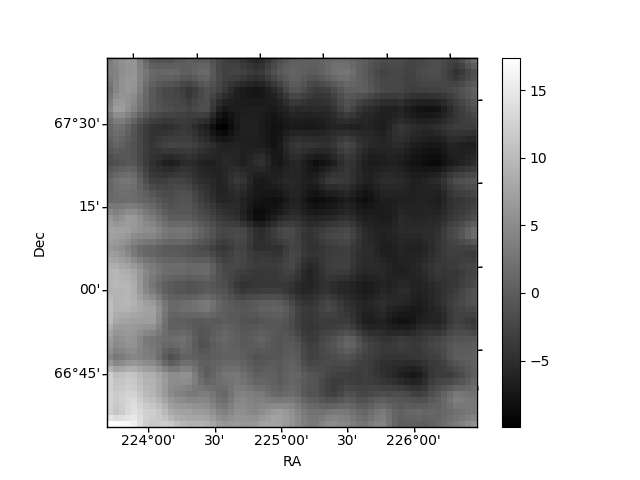
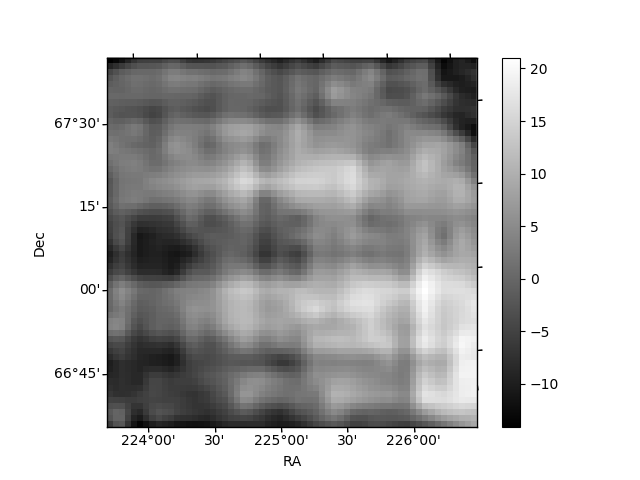
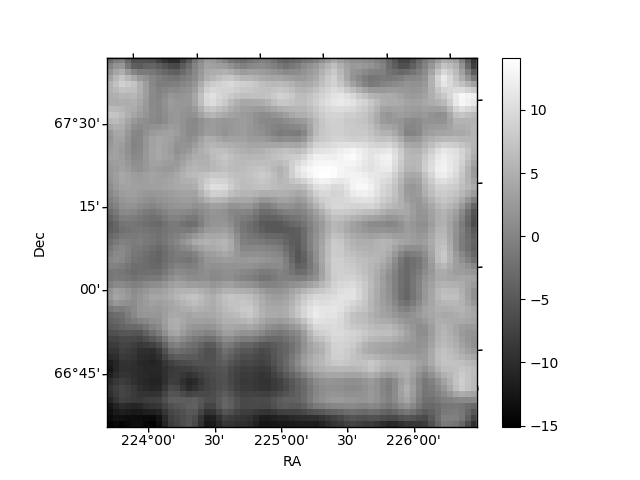
Histogram calculated using DETX and DETY for each event in the final _common_clean file
| Quadrant A | 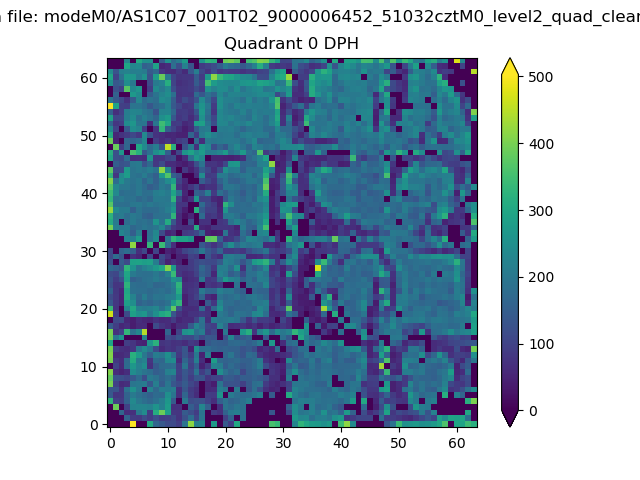 |
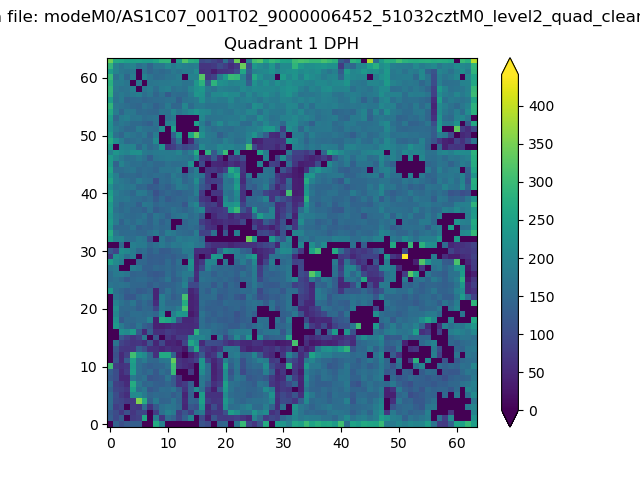 |
Quadrant B |
|---|---|---|---|
| Quadrant D | 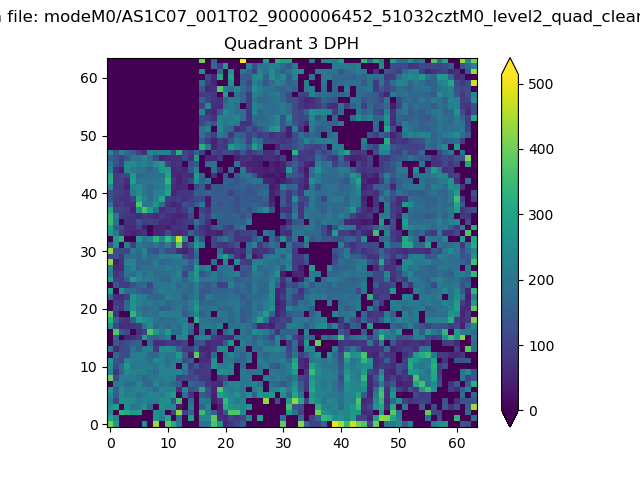 |
 |
Quadrant C |
| Plot type | Count rate plots | Images |
|---|---|---|
| Comparison with Poisson distribution Blue bars denote a histogram of data divided into 1 sec bins. Red curve is a Poisson curve with rate = median count rate of data. |
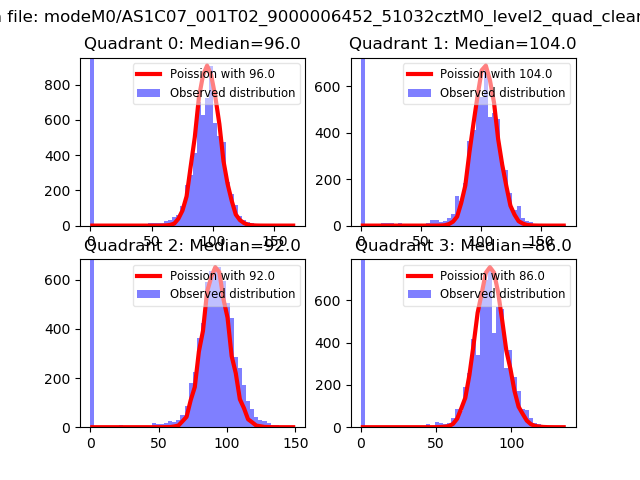 |
 |
| Quadrant-wise count rates Data is divided into 100 sec bins |
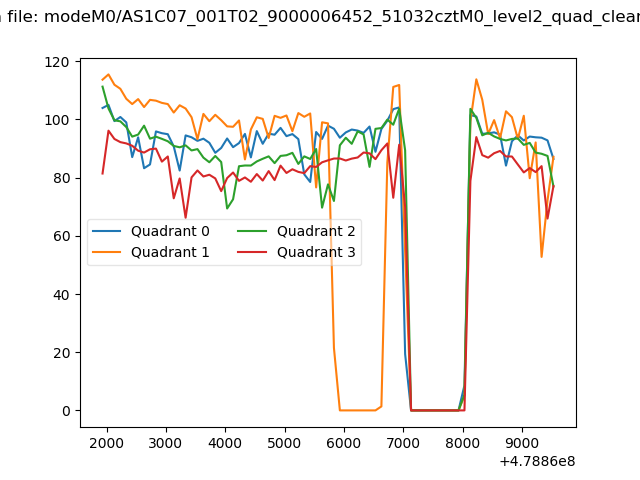 |
|
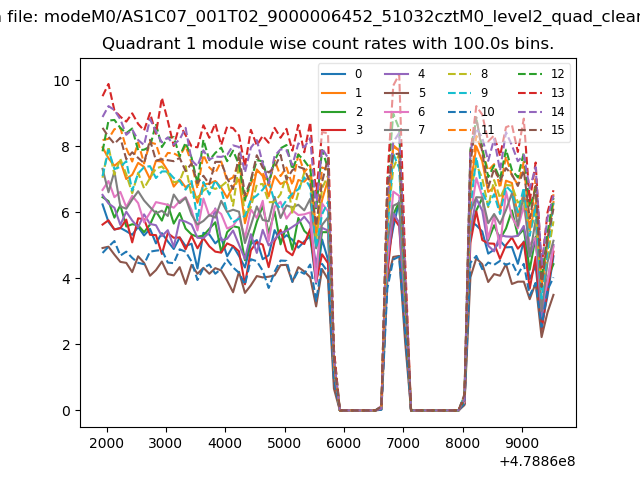
| Module-wise count rates for Quadrant A Data is divided into 100 sec bins |
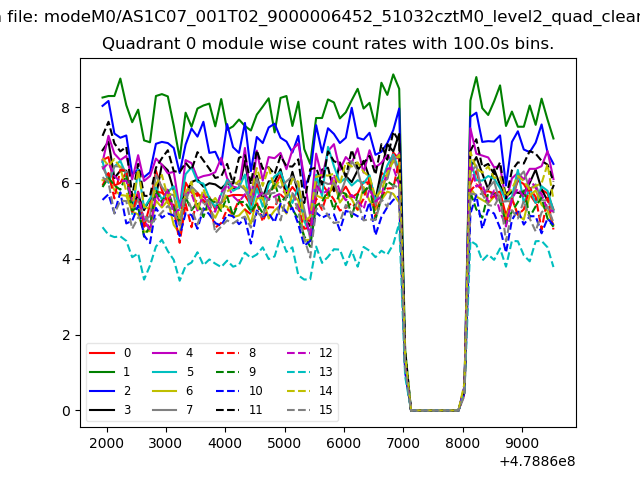 |
 |
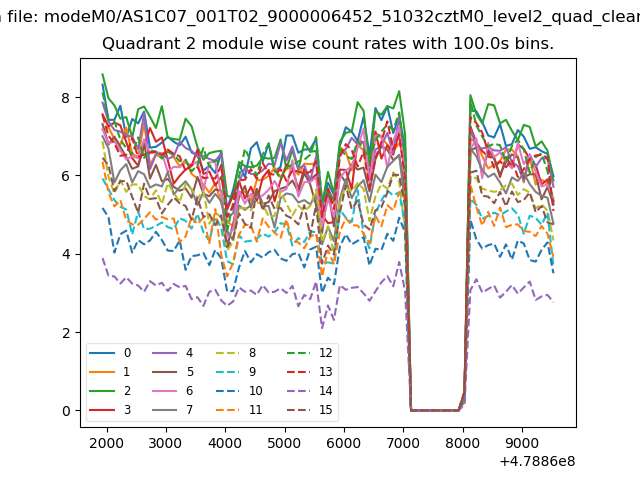
| Module-wise count rates for Quadrant B Data is divided into 100 sec bins |
 |
 |
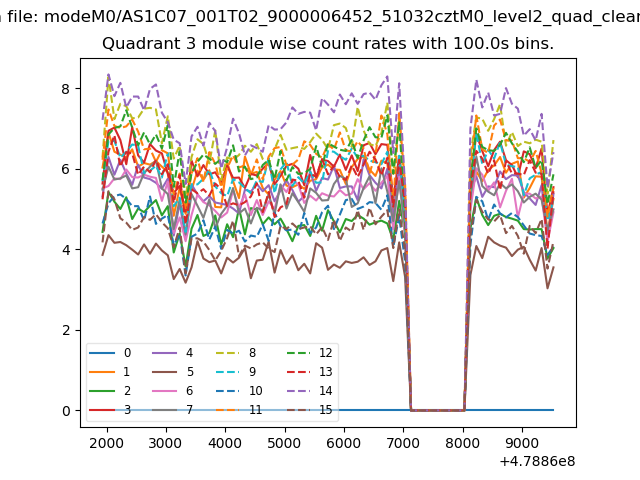
| Module-wise count rates for Quadrant C Data is divided into 100 sec bins |
 |
 |
| Module-wise count rates for Quadrant D Data is divided into 100 sec bins |
 |
 |
| Parameter | Plot |
|---|---|
| CZT HV Monitor | 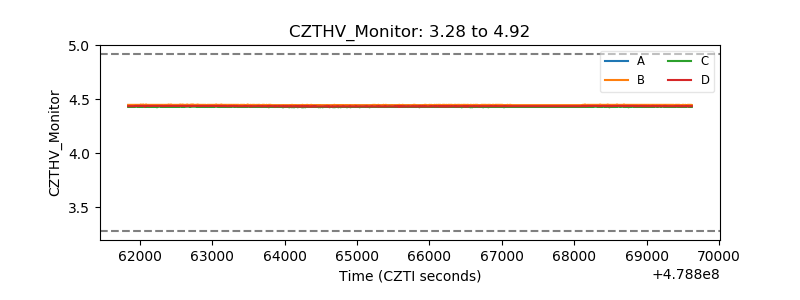 |
| D_VDD | 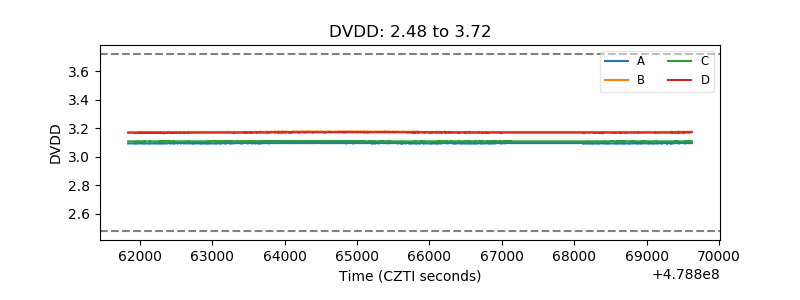 |
| Temperature 1 | 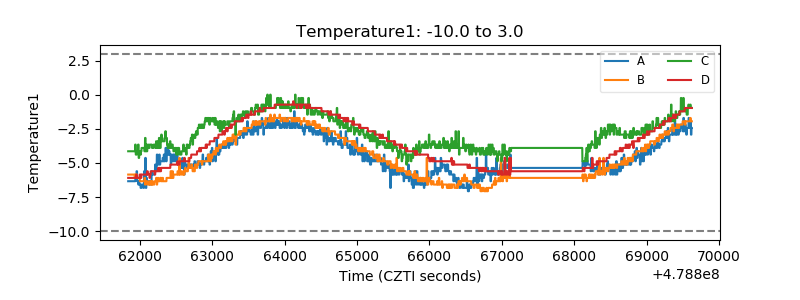 |
| Veto HV Monitor | 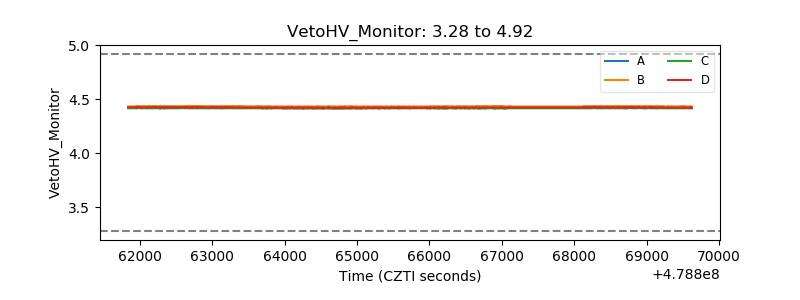 |
| Veto LLD | 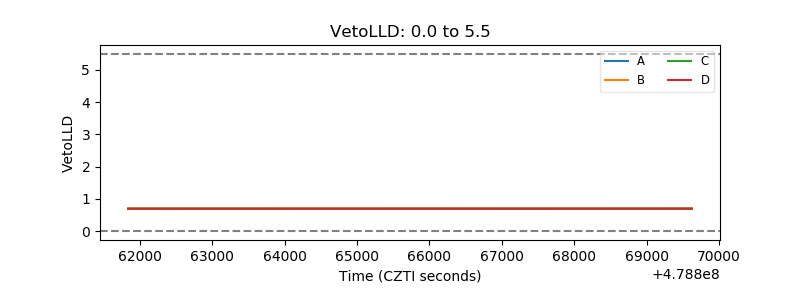 |
| Alpha Counter | 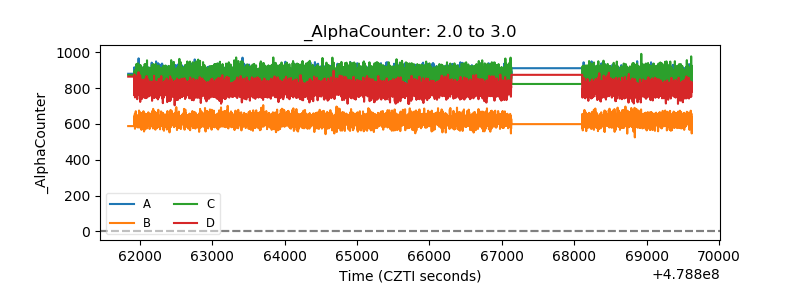 |
| _CPM_Rate | 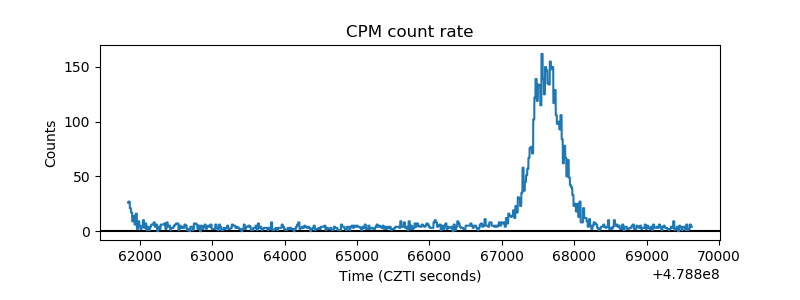 |
| CZT Counter | 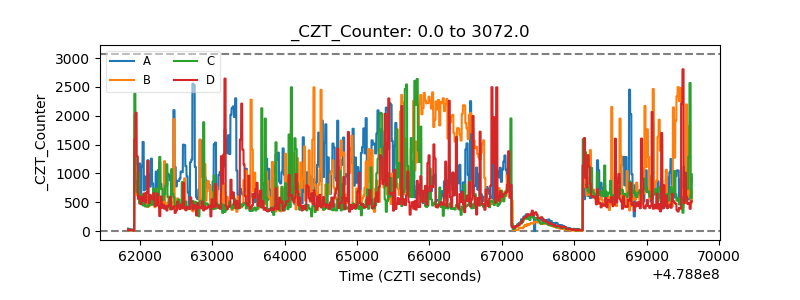 |
| +2.5 Volts monitor | 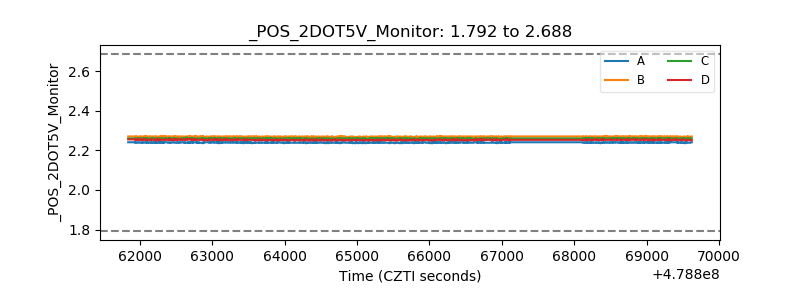 |
| +5 Volts monitor | 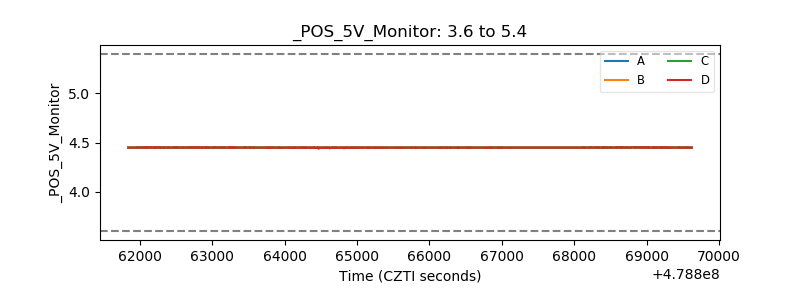 |
| _ROLL_ROT | 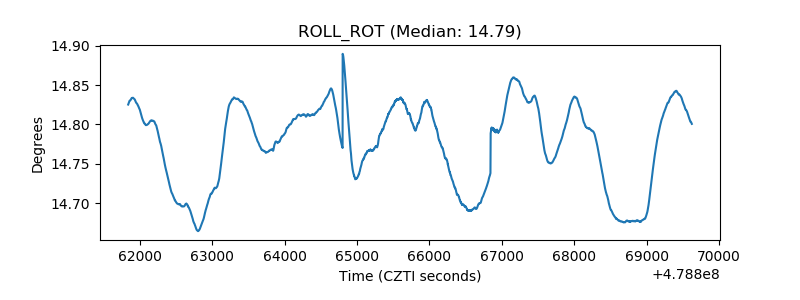 |
| _Roll_DEC | 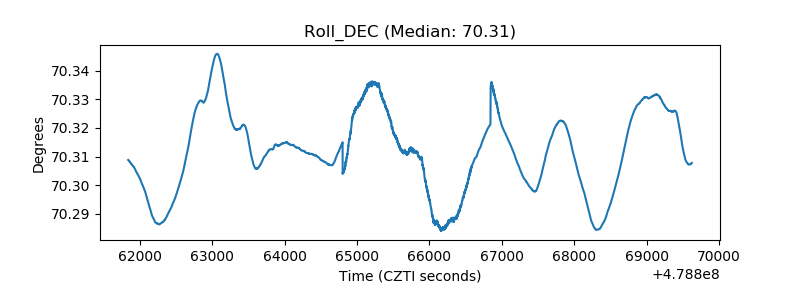 |
| _Roll_RA | 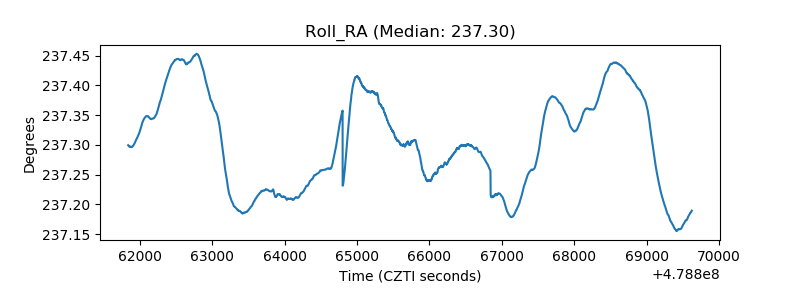 |
| Veto Counter | 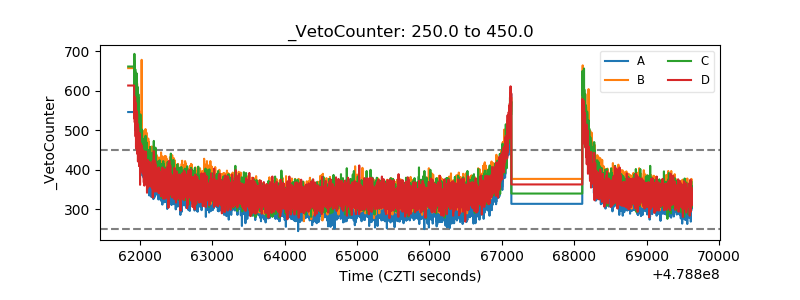 |