| Param | Original file | Final file |
|---|---|---|
| Filename | modeM0/AS1C07_001T02_9000006452_51033cztM0_level2.fits | modeM0/AS1C07_001T02_9000006452_51033cztM0_level2_quad_clean.evt |
| Size (bytes) | 740,321,280 | 88,326,720 |
| Size | 706.0 MB | 84.2 MB |
| Events in quadrant A | 7,354,860 | 585,372 |
| Events in quadrant B | 6,523,960 | 599,944 |
| Events in quadrant C | 5,093,123 | 586,185 |
| Events in quadrant D | 7,900,300 | 423,550 |
| Mode SS | |||
|---|---|---|---|
| Quadrant | BADHDUFLAG | Total packets | Discarded packets |
| A | 0 | 140 | 0 |
| B | 0 | 140 | 0 |
| C | 0 | 140 | 0 |
| D | 0 | 140 | 0 |
| Mode M9 | |||
|---|---|---|---|
| Quadrant | BADHDUFLAG | Total packets | Discarded packets |
| A | 0 | 6 | 0 |
| B | 0 | 6 | 0 |
| C | 0 | 6 | 0 |
| D | 0 | 6 | 0 |
| Mode M0 | |||
|---|---|---|---|
| Quadrant | BADHDUFLAG | Total packets | Discarded packets |
| A | 0 | 26758 | 4 |
| B | 0 | 24156 | 1 |
| C | 0 | 19842 | 1 |
| D | 0 | 28294 | 1 |
| Quadrant | Total seconds | Saturated seconds | Saturation percentage |
|---|---|---|---|
| A | 6873 | 769 | 11.188709% |
| B | 6874 | 1160 | 16.875182% |
| C | 6874 | 458 | 6.662787% |
| D | 6874 | 1956 | 28.455048% |
Noise dominated data is calculated using 1-second bins in cleaned event files. If a bin has >2000 counts, and if more than 50% of those come from <1% of pixels, then it is considered to be noise-dominated and hence unusable.
| Quadrant | # 1 sec bins | Bins with >0 counts | Bins with >2000 counts | High rate bins dominated by noise | Noise dominated (total time) | Noise dominated (detector-on time) | Marked lightcurve |
|---|---|---|---|---|---|---|---|
| A | 7473 | 6873 | 620 | 620 | 8.30% | 9.02% | 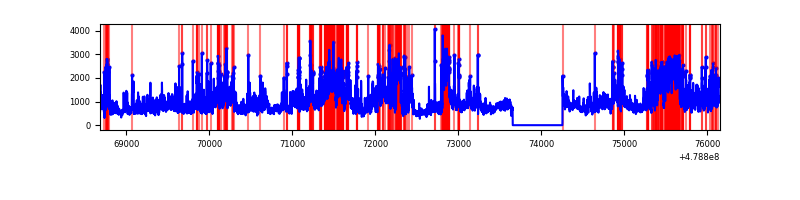 |
| B | 7474 | 6874 | 697 | 697 | 9.33% | 10.14% | 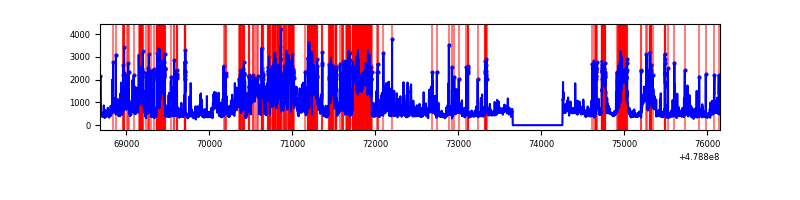 |
| C | 7474 | 6875 | 251 | 251 | 3.36% | 3.65% | 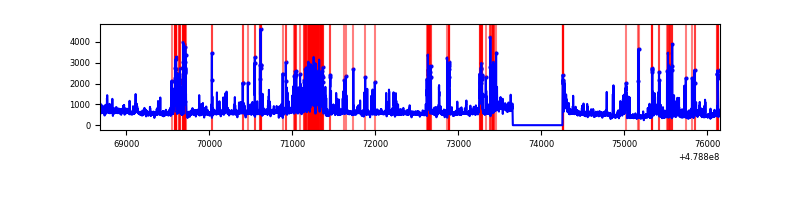 |
| D | 7474 | 6875 | 1747 | 1747 | 23.37% | 25.41% | 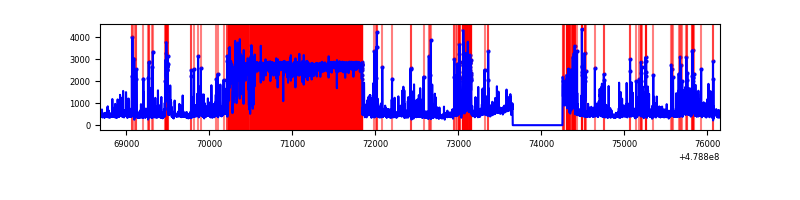 |
Top three noisy pixels from each quadrant. If the there are fewer than three noisy pixels in the level2.evt file, extra rows are filled as -1
| Pixel properties | Quadrant properties | ||||||
|---|---|---|---|---|---|---|---|
| Quadrant | DetID | PixID | Counts | Sigma | Mean | Median | Sigma |
| A | 12 | 3 | 1413125 | 8074.85 | 708 | 692 | 174.9 |
| A | 12 | 80 | 1138053 | 6502.27 | 708 | 692 | 174.9 |
| A | 10 | 253 | 881141 | 5033.51 | 708 | 692 | 174.9 |
| B | 12 | 32 | 1691285 | 11794.76 | 680 | 657 | 143.3 |
| B | 4 | 81 | 1061433 | 7400.56 | 680 | 657 | 143.3 |
| B | 5 | 185 | 336753 | 2344.79 | 680 | 657 | 143.3 |
| C | 10 | 69 | 884189 | 4688.31 | 693 | 687 | 188.4 |
| C | 1 | 44 | 365400 | 1935.35 | 693 | 687 | 188.4 |
| C | 3 | 233 | 207059 | 1095.11 | 693 | 687 | 188.4 |
| D | 8 | 176 | 4138105 | 24826.41 | 595 | 573 | 166.7 |
| D | 2 | 216 | 827397 | 4961.18 | 595 | 573 | 166.7 |
| D | 15 | 174 | 83071 | 495.01 | 595 | 573 | 166.7 |
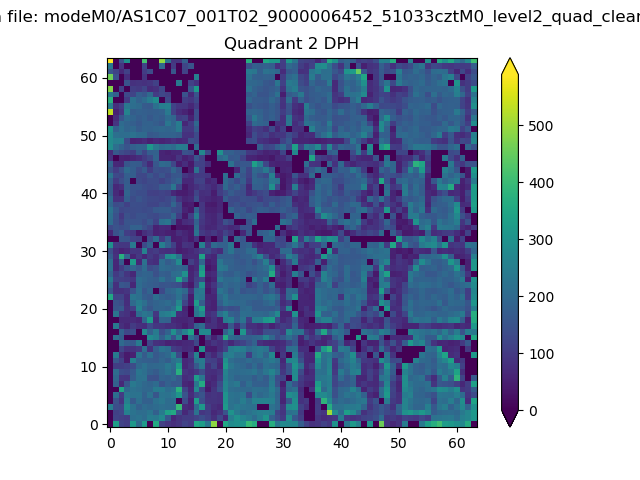
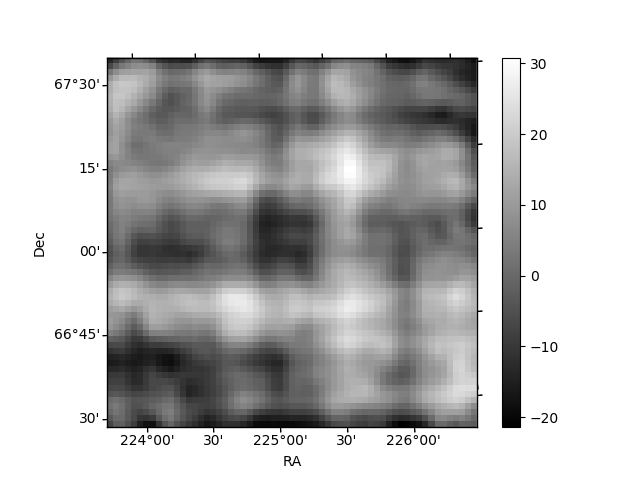
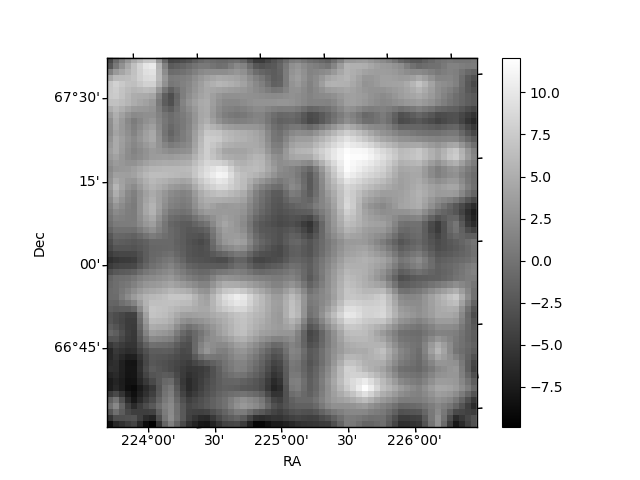
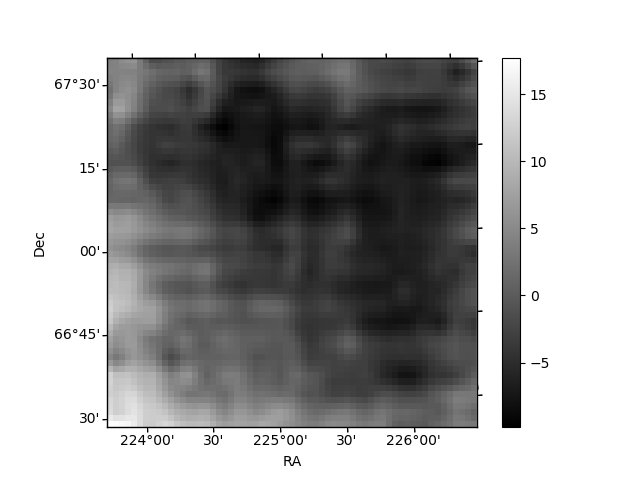
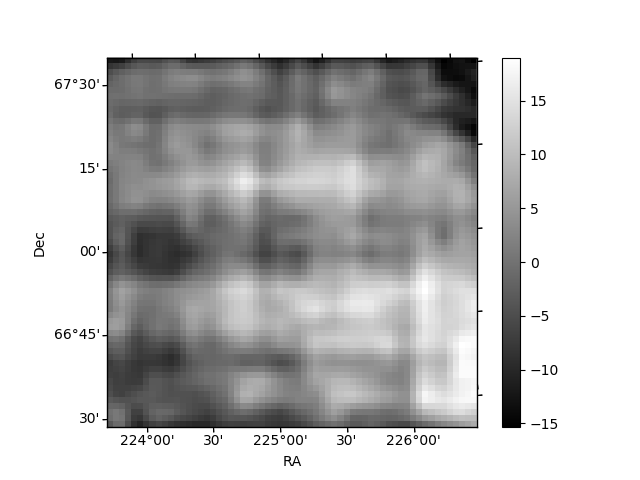
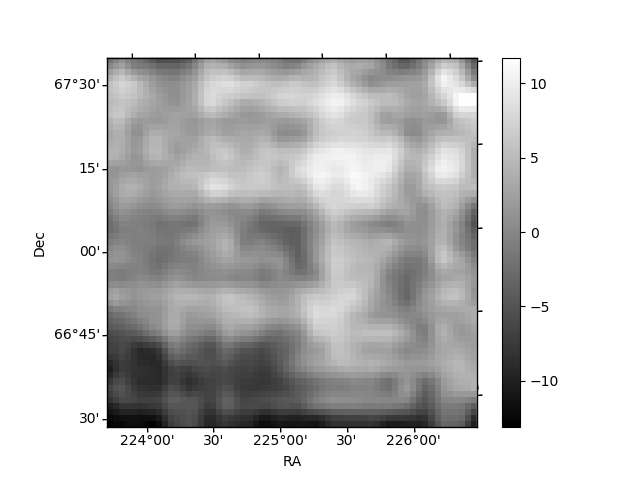
Histogram calculated using DETX and DETY for each event in the final _common_clean file
| Quadrant A | 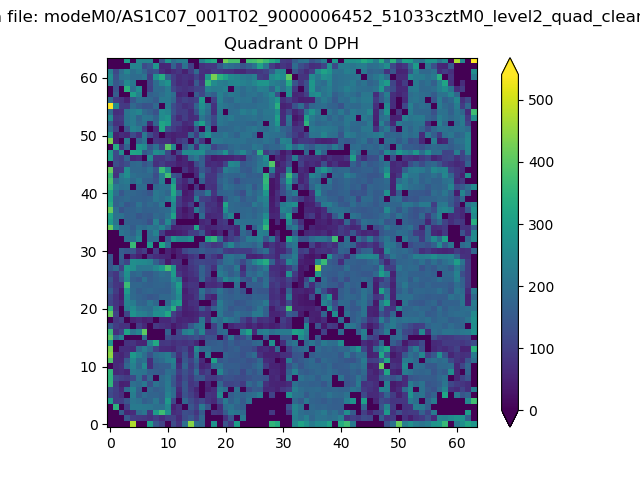 |
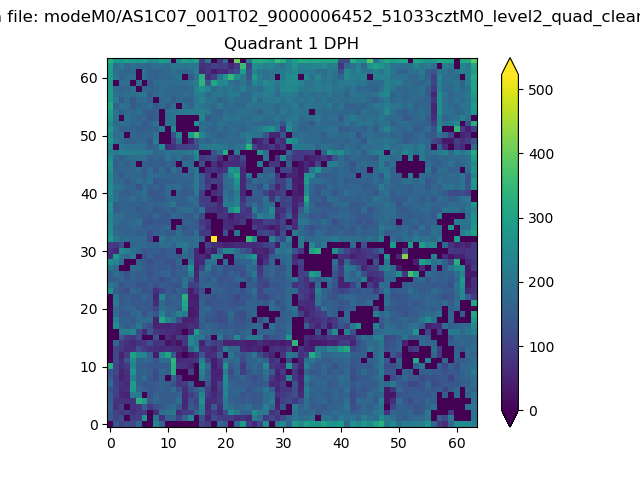 |
Quadrant B |
|---|---|---|---|
| Quadrant D | 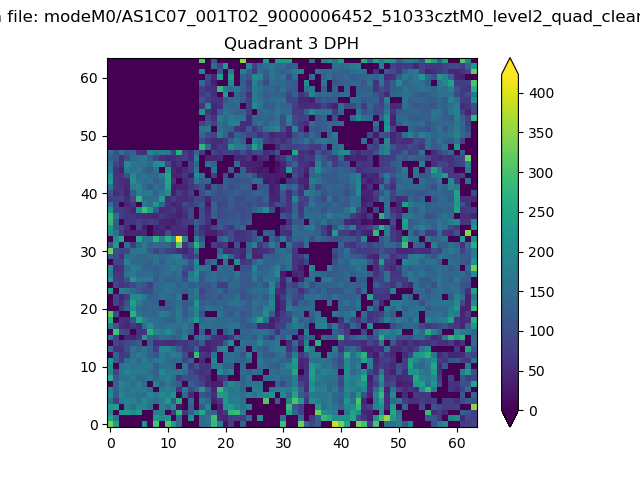 |
 |
Quadrant C |
| Plot type | Count rate plots | Images |
|---|---|---|
| Comparison with Poisson distribution Blue bars denote a histogram of data divided into 1 sec bins. Red curve is a Poisson curve with rate = median count rate of data. |
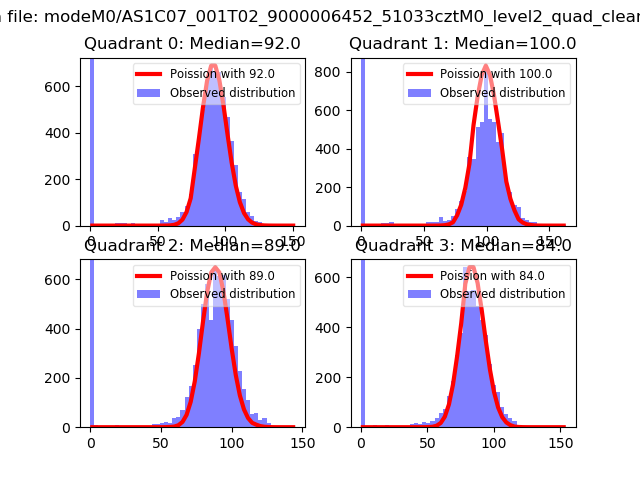 |
 |
| Quadrant-wise count rates Data is divided into 100 sec bins |
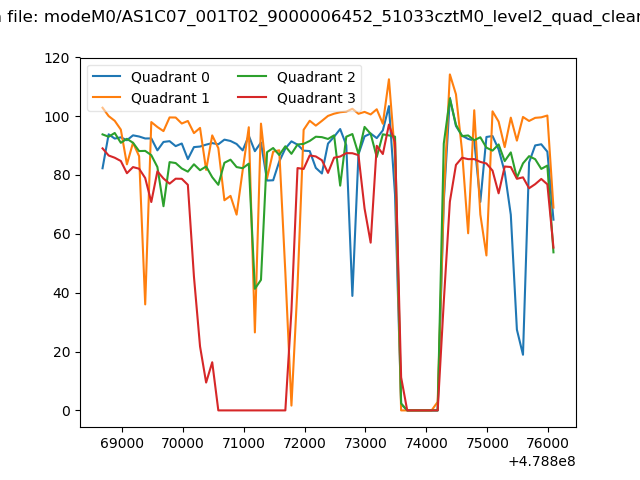 |
|
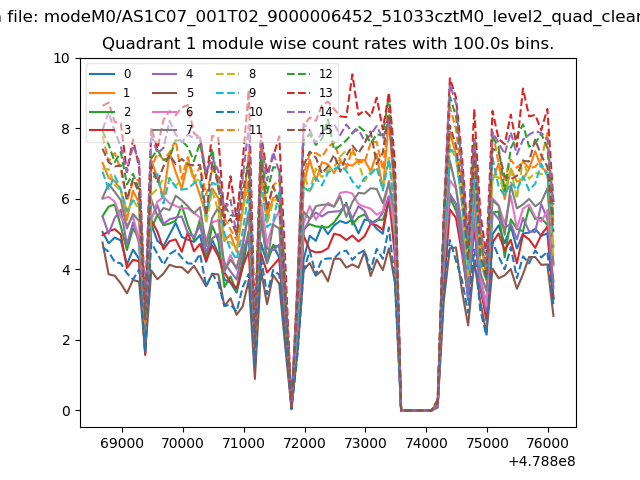
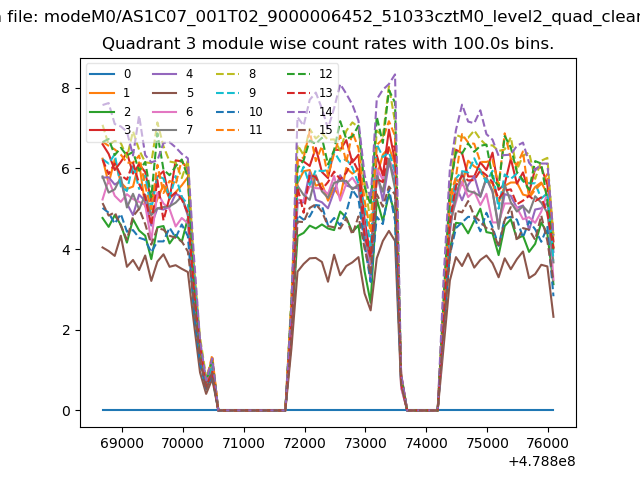
| Module-wise count rates for Quadrant A Data is divided into 100 sec bins |
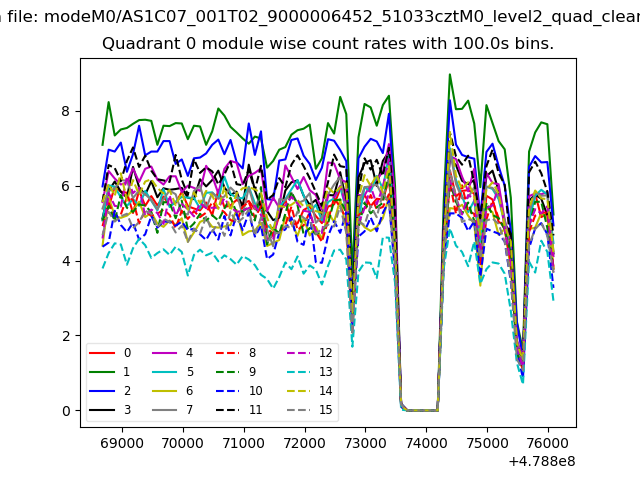 |
 |
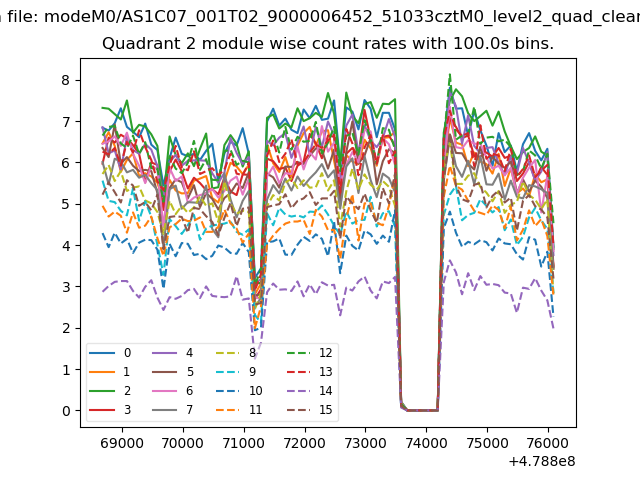
| Module-wise count rates for Quadrant B Data is divided into 100 sec bins |
 |
 |
| Module-wise count rates for Quadrant C Data is divided into 100 sec bins |
 |
 |
| Module-wise count rates for Quadrant D Data is divided into 100 sec bins |
 |
 |
| Parameter | Plot |
|---|---|
| CZT HV Monitor | 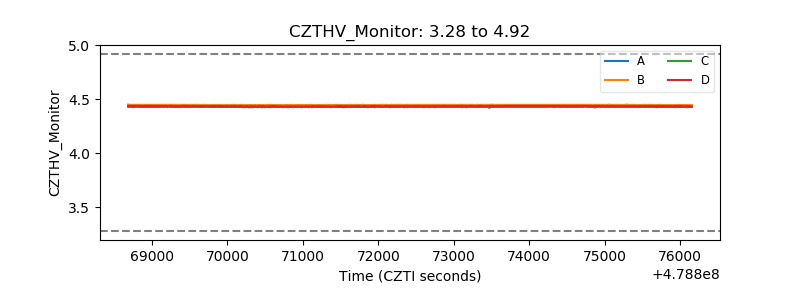 |
| D_VDD | 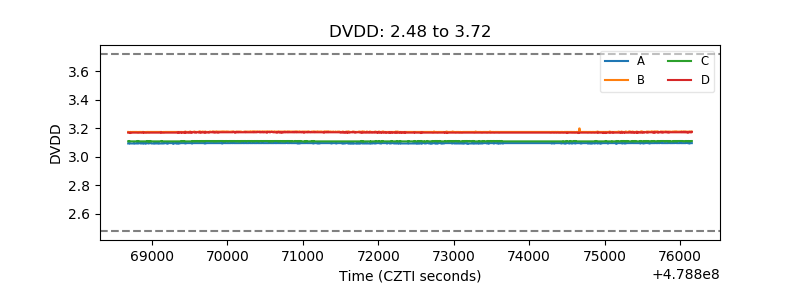 |
| Temperature 1 | 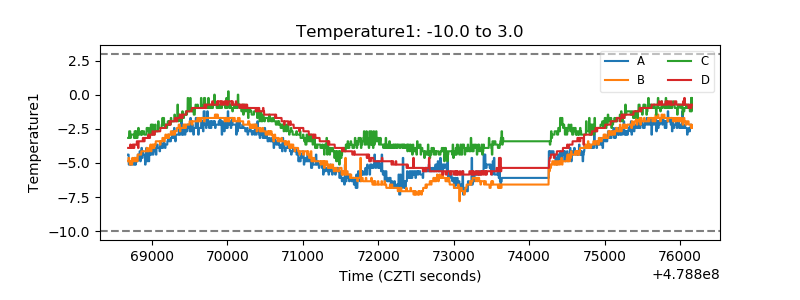 |
| Veto HV Monitor |  |
| Veto LLD | 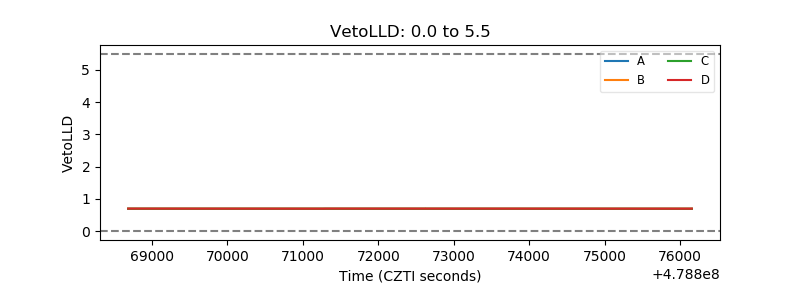 |
| Alpha Counter | 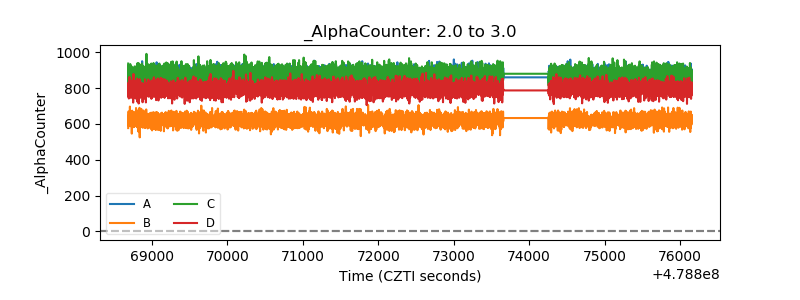 |
| _CPM_Rate | 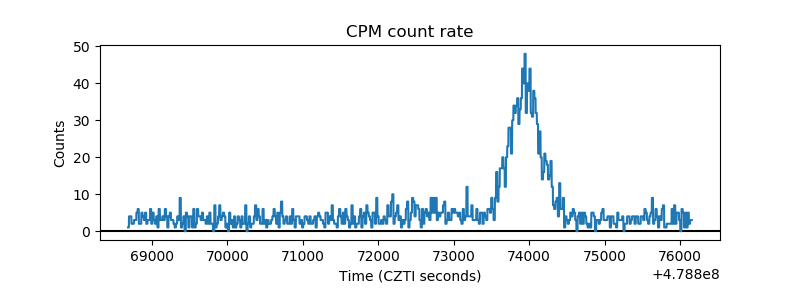 |
| CZT Counter | 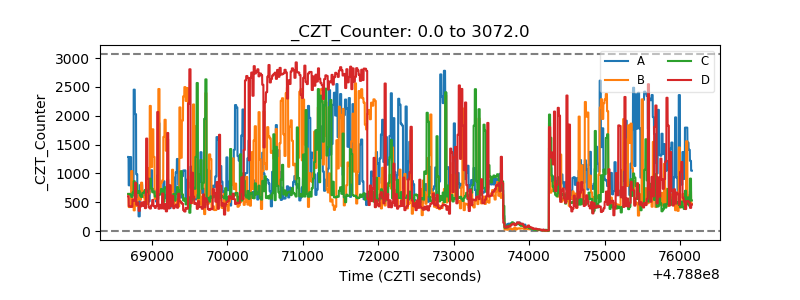 |
| +2.5 Volts monitor | 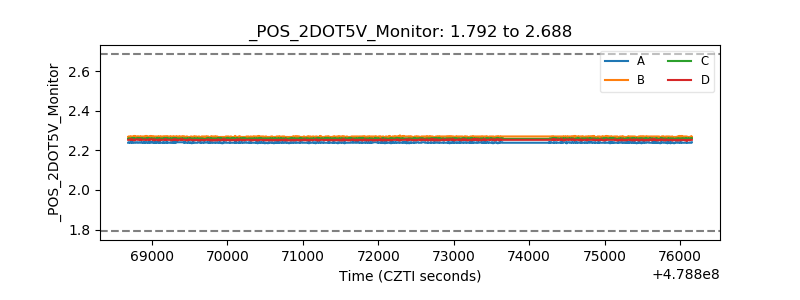 |
| +5 Volts monitor | 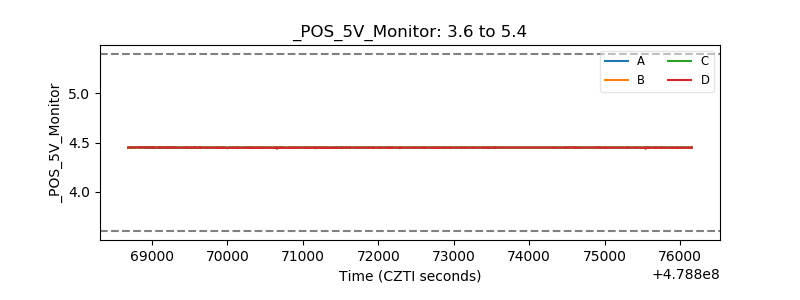 |
| _ROLL_ROT | 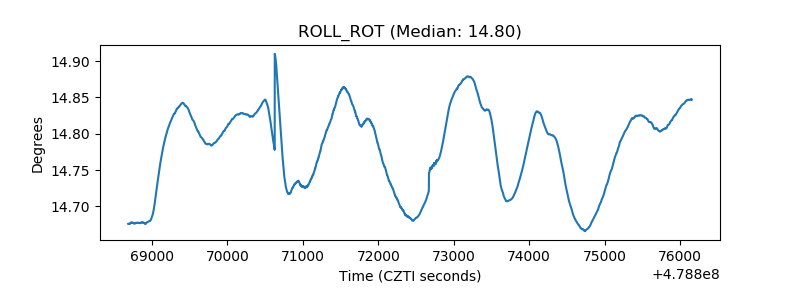 |
| _Roll_DEC | 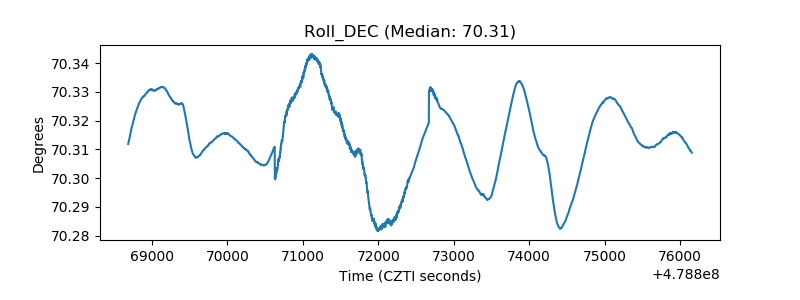 |
| _Roll_RA | 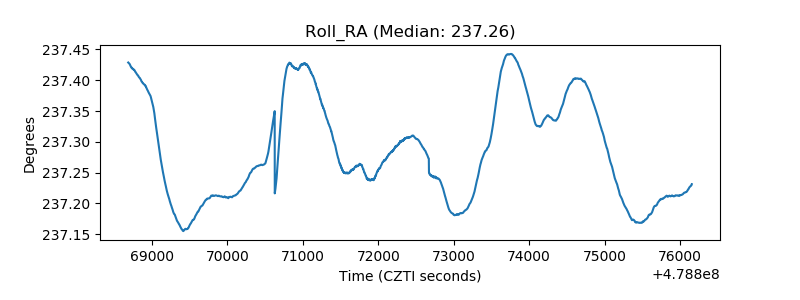 |
| Veto Counter | 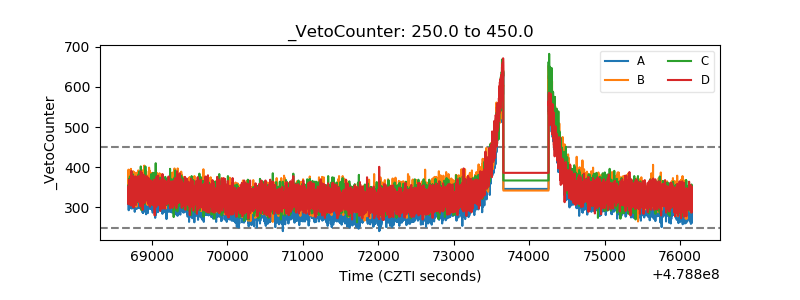 |