| Param | Original file | Final file |
|---|---|---|
| Filename | modeM0/AS1C07_001T02_9000006452_51034cztM0_level2.fits | modeM0/AS1C07_001T02_9000006452_51034cztM0_level2_quad_clean.evt |
| Size (bytes) | 731,459,520 | 98,452,800 |
| Size | 697.6 MB | 93.9 MB |
| Events in quadrant A | 8,350,361 | 625,773 |
| Events in quadrant B | 6,827,356 | 637,667 |
| Events in quadrant C | 5,546,022 | 621,634 |
| Events in quadrant D | 5,789,316 | 589,003 |
| Mode SS | |||
|---|---|---|---|
| Quadrant | BADHDUFLAG | Total packets | Discarded packets |
| A | 0 | 144 | 0 |
| B | 0 | 144 | 0 |
| C | 0 | 144 | 0 |
| D | 0 | 144 | 0 |
| Mode M0 | |||
|---|---|---|---|
| Quadrant | BADHDUFLAG | Total packets | Discarded packets |
| A | 0 | 30070 | 0 |
| B | 0 | 25334 | 0 |
| C | 0 | 21498 | 0 |
| D | 0 | 22329 | 0 |
| Quadrant | Total seconds | Saturated seconds | Saturation percentage |
|---|---|---|---|
| A | 7281 | 928 | 12.745502% |
| B | 7282 | 1239 | 17.014556% |
| C | 7282 | 493 | 6.770118% |
| D | 7282 | 493 | 6.770118% |
Noise dominated data is calculated using 1-second bins in cleaned event files. If a bin has >2000 counts, and if more than 50% of those come from <1% of pixels, then it is considered to be noise-dominated and hence unusable.
| Quadrant | # 1 sec bins | Bins with >0 counts | Bins with >2000 counts | High rate bins dominated by noise | Noise dominated (total time) | Noise dominated (detector-on time) | Marked lightcurve |
|---|---|---|---|---|---|---|---|
| A | 7281 | 7281 | 707 | 707 | 9.71% | 9.71% | 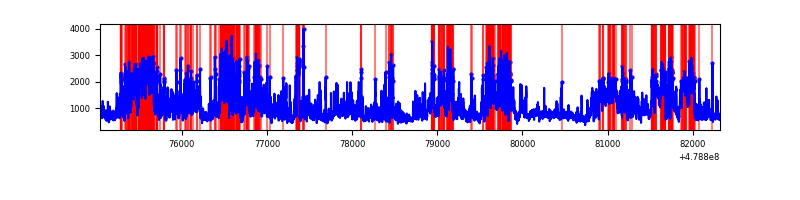 |
| B | 7282 | 7282 | 672 | 672 | 9.23% | 9.23% | 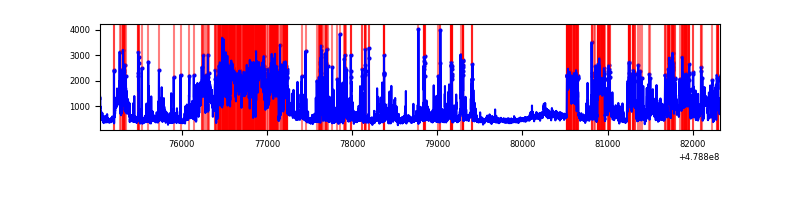 |
| C | 7282 | 7282 | 314 | 314 | 4.31% | 4.31% | 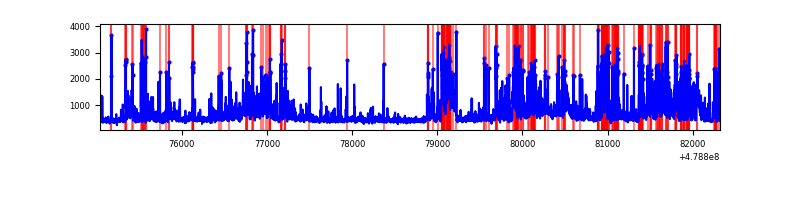 |
| D | 7282 | 7282 | 376 | 376 | 5.16% | 5.16% | 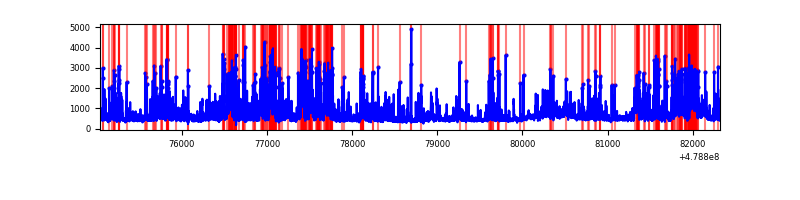 |
Top three noisy pixels from each quadrant. If the there are fewer than three noisy pixels in the level2.evt file, extra rows are filled as -1
| Pixel properties | Quadrant properties | ||||||
|---|---|---|---|---|---|---|---|
| Quadrant | DetID | PixID | Counts | Sigma | Mean | Median | Sigma |
| A | 10 | 253 | 1619255 | 8831.08 | 753 | 736 | 183.3 |
| A | 12 | 80 | 1355312 | 7390.94 | 753 | 736 | 183.3 |
| A | 12 | 3 | 1114422 | 6076.57 | 753 | 736 | 183.3 |
| B | 12 | 32 | 1709444 | 11219.16 | 722 | 698 | 152.3 |
| B | 4 | 81 | 1269255 | 8329.0 | 722 | 698 | 152.3 |
| B | 4 | 206 | 261497 | 1712.33 | 722 | 698 | 152.3 |
| C | 13 | 49 | 615191 | 3029.67 | 740 | 733 | 202.8 |
| C | 15 | 147 | 403912 | 1987.93 | 740 | 733 | 202.8 |
| C | 1 | 44 | 307347 | 1511.8 | 740 | 733 | 202.8 |
| D | 8 | 176 | 925948 | 4469.91 | 736 | 710 | 207.0 |
| D | 2 | 216 | 625074 | 3016.36 | 736 | 710 | 207.0 |
| D | 9 | 1 | 382045 | 1842.27 | 736 | 710 | 207.0 |
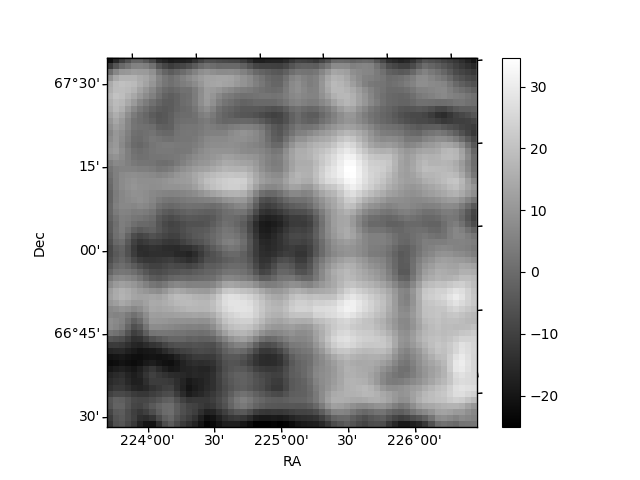
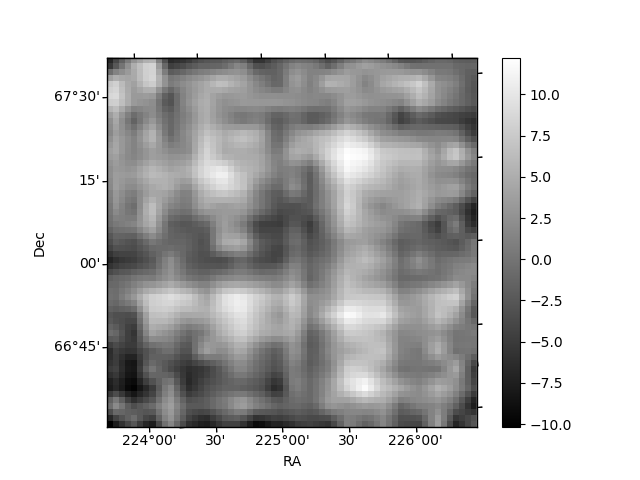
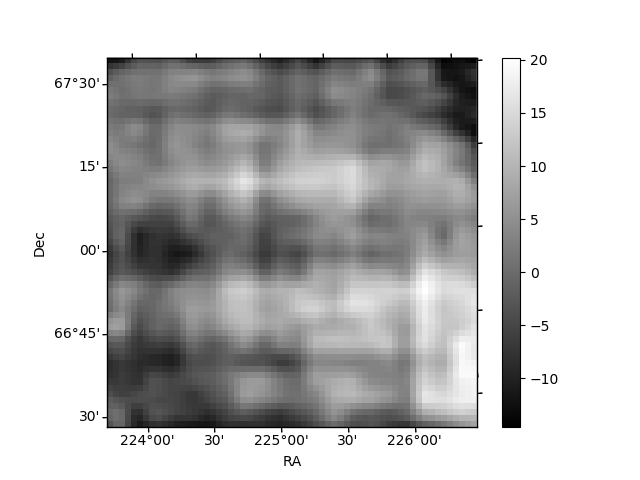
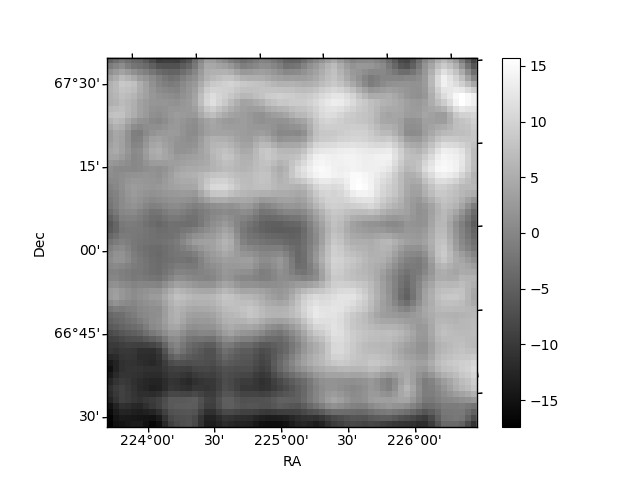
Histogram calculated using DETX and DETY for each event in the final _common_clean file
| Quadrant A | 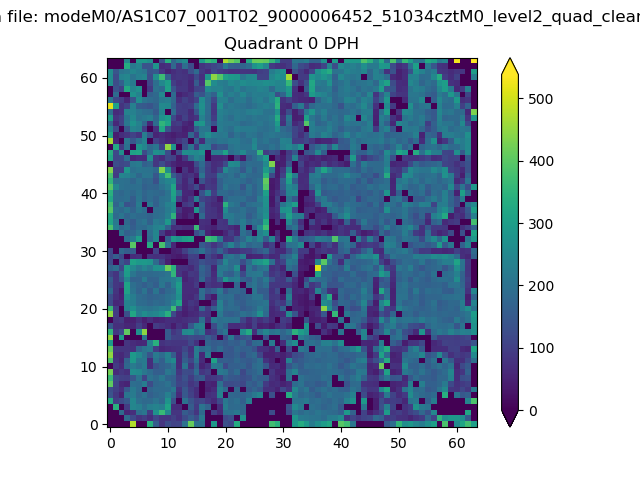 |
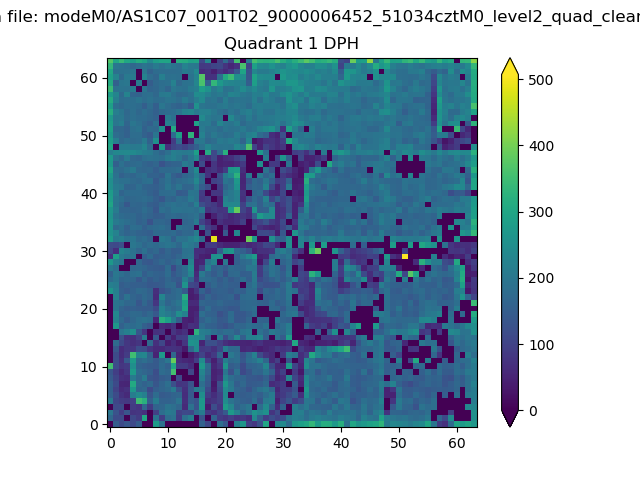 |
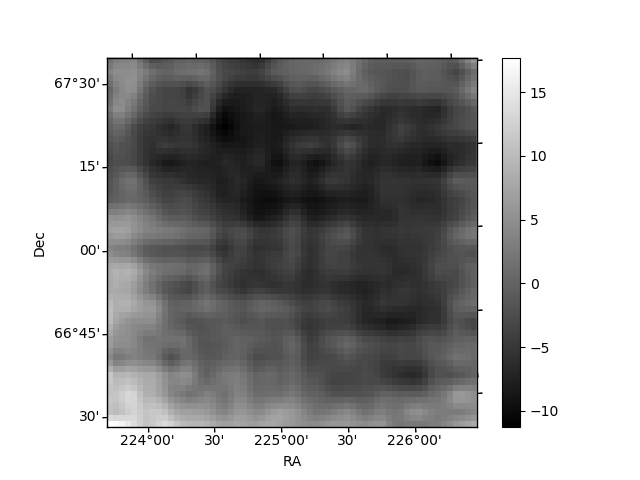
Quadrant B |
|---|---|---|---|
| Quadrant D | 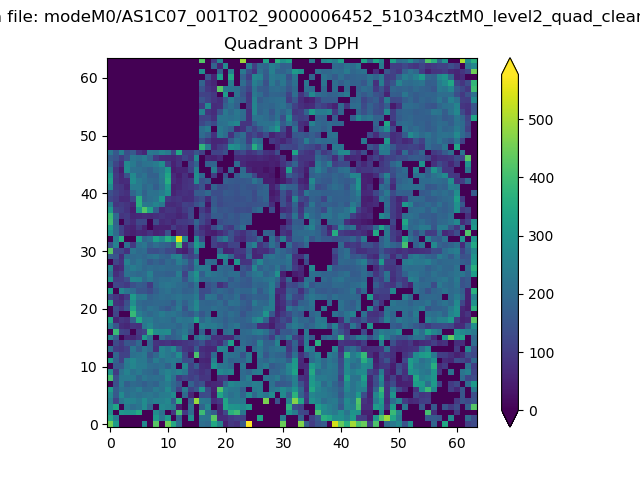 |
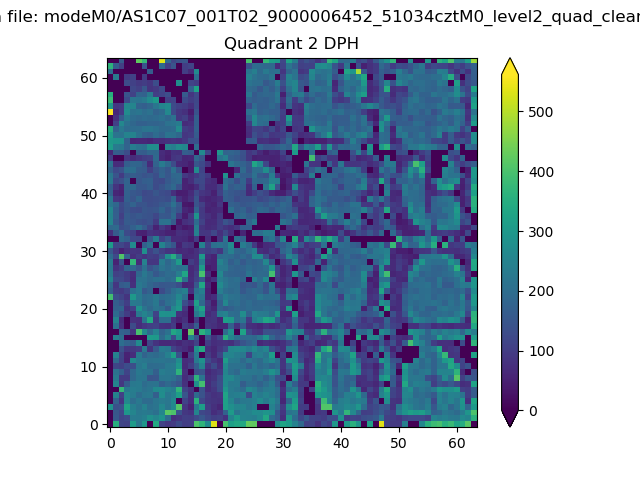 |
Quadrant C |
| Plot type | Count rate plots | Images |
|---|---|---|
| Comparison with Poisson distribution Blue bars denote a histogram of data divided into 1 sec bins. Red curve is a Poisson curve with rate = median count rate of data. |
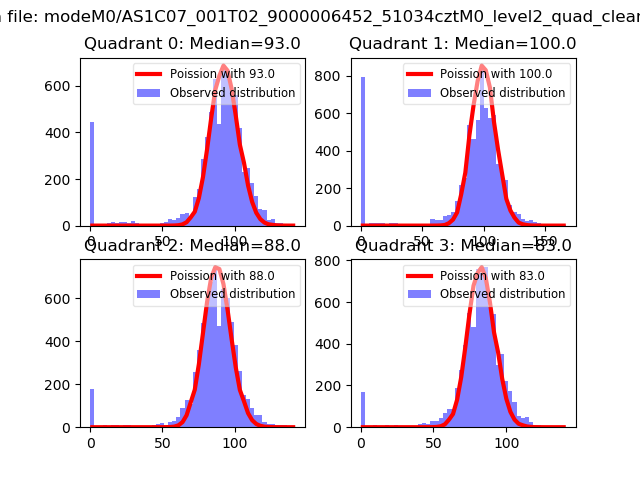 |
 |
| Quadrant-wise count rates Data is divided into 100 sec bins |
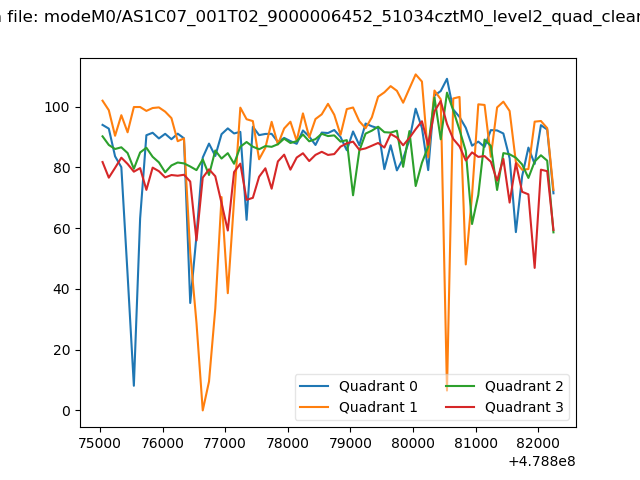 |
|
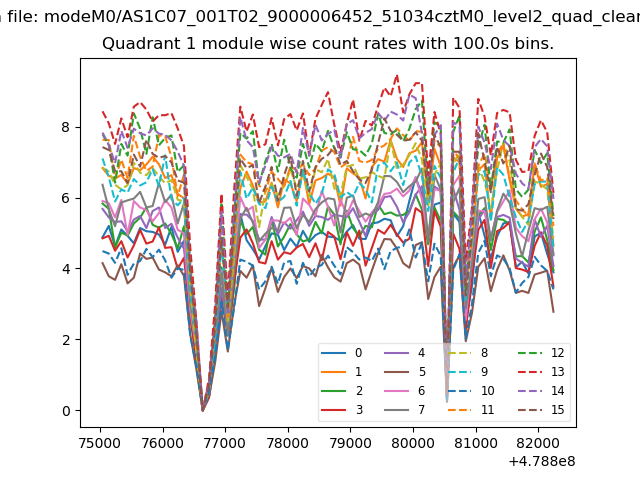
| Module-wise count rates for Quadrant A Data is divided into 100 sec bins |
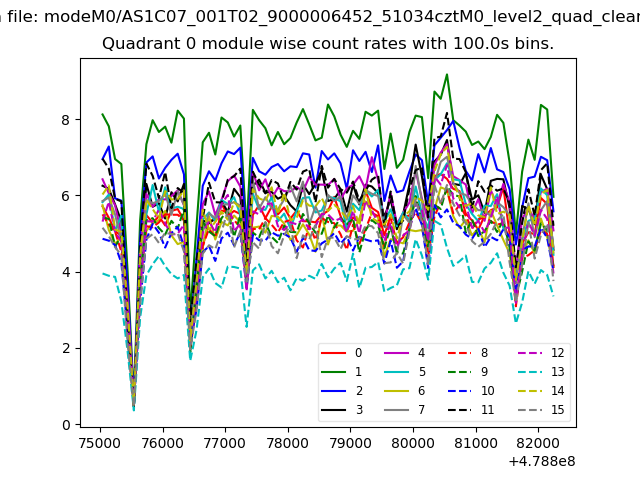 |
 |
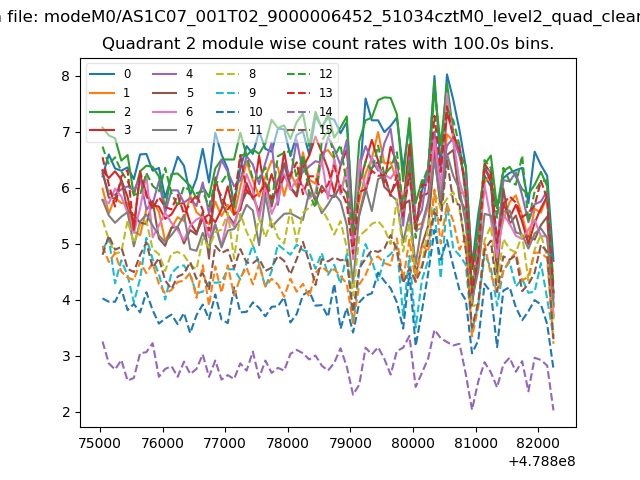
| Module-wise count rates for Quadrant B Data is divided into 100 sec bins |
 |
 |
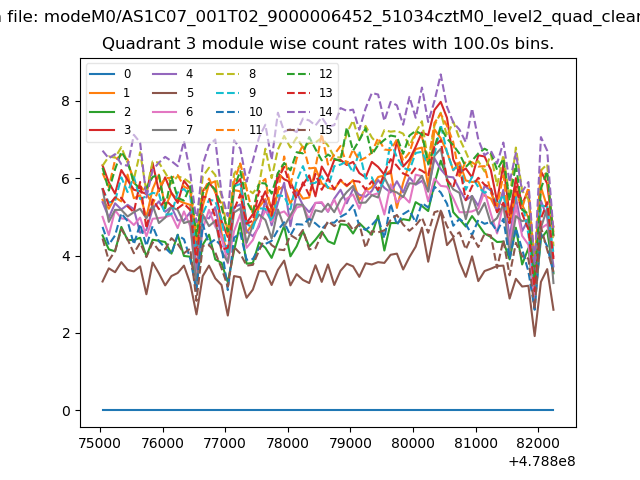
| Module-wise count rates for Quadrant C Data is divided into 100 sec bins |
 |
 |
| Module-wise count rates for Quadrant D Data is divided into 100 sec bins |
 |
 |
| Parameter | Plot |
|---|---|
| CZT HV Monitor | 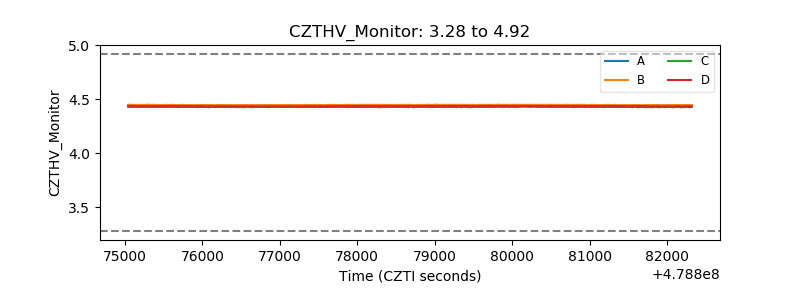 |
| D_VDD | 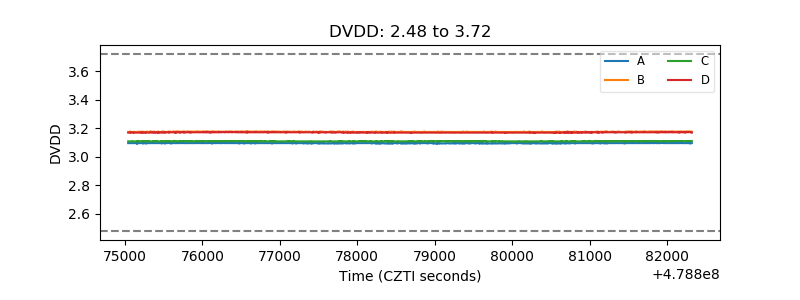 |
| Temperature 1 | 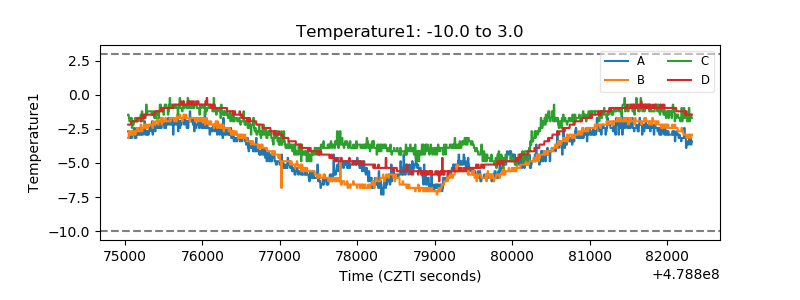 |
| Veto HV Monitor | 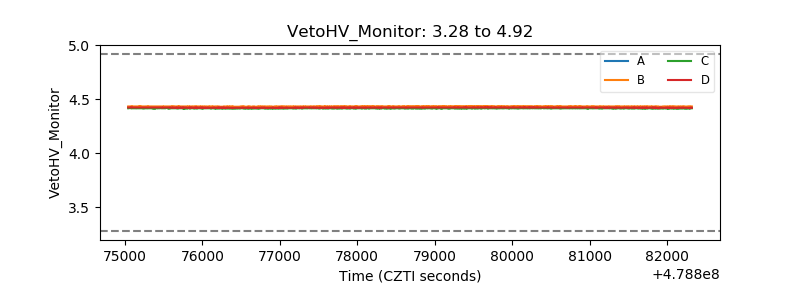 |
| Veto LLD | 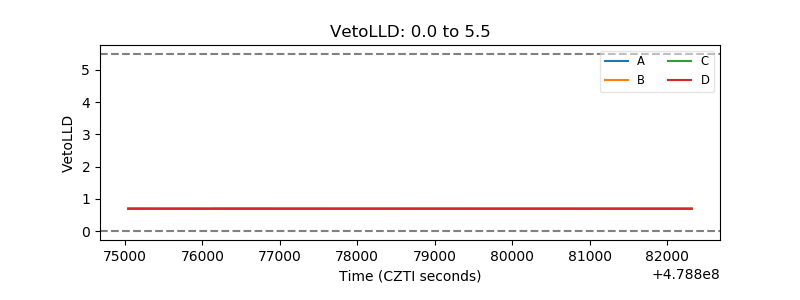 |
| Alpha Counter | 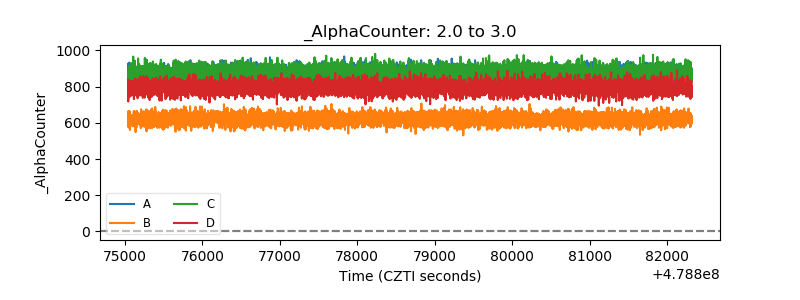 |
| _CPM_Rate | 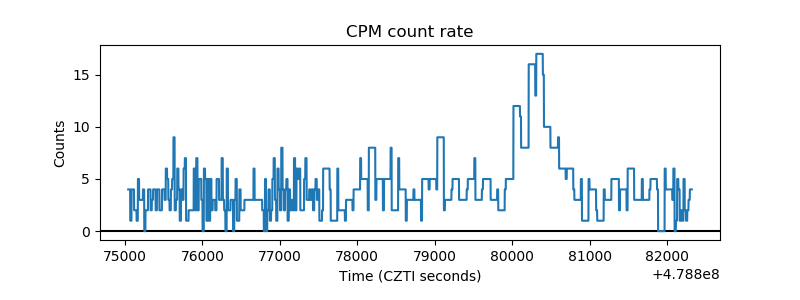 |
| CZT Counter | 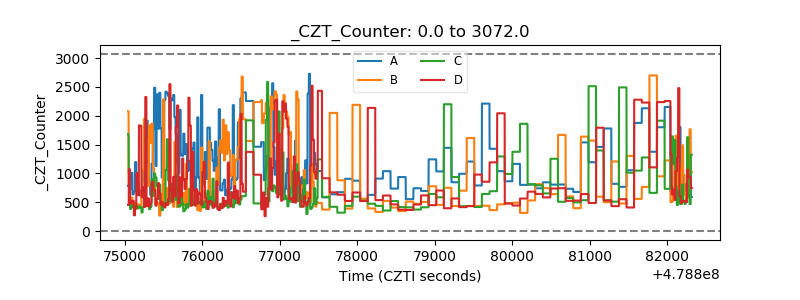 |
| +2.5 Volts monitor | 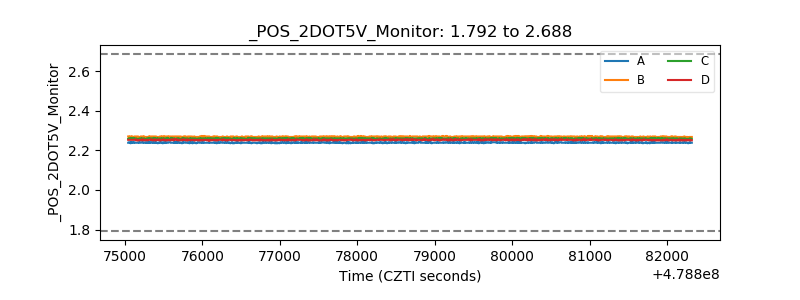 |
| +5 Volts monitor | 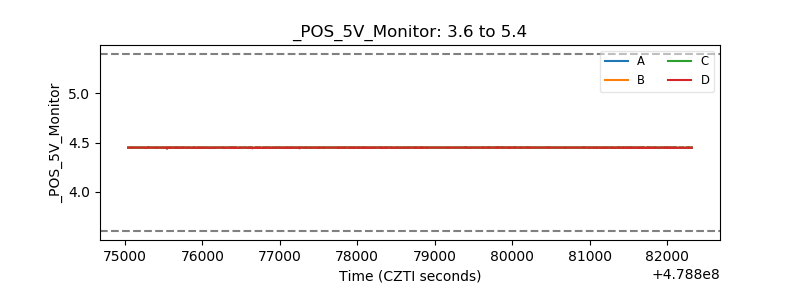 |
| _ROLL_ROT | 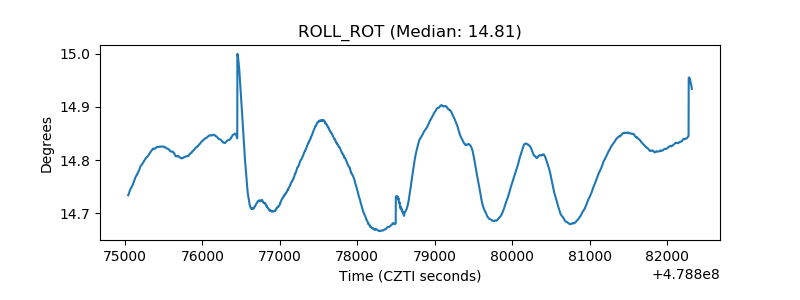 |
| _Roll_DEC | 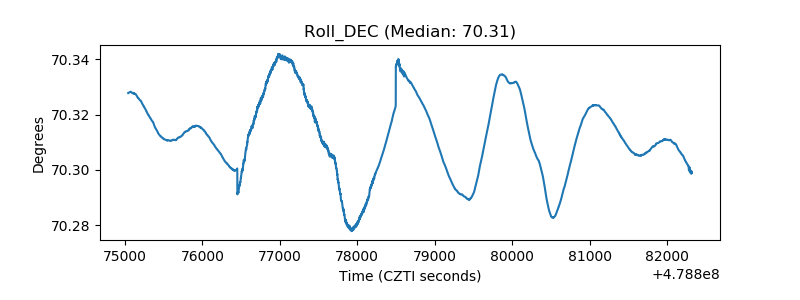 |
| _Roll_RA | 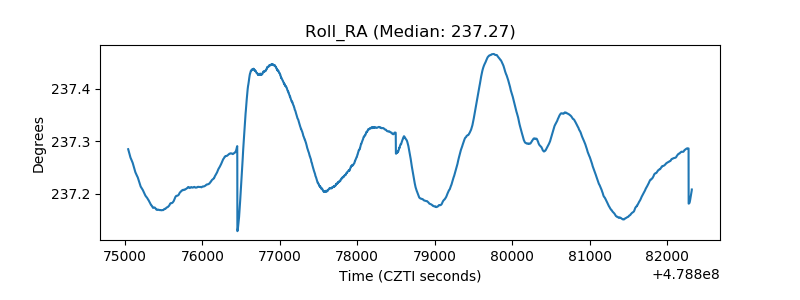 |
| Veto Counter | 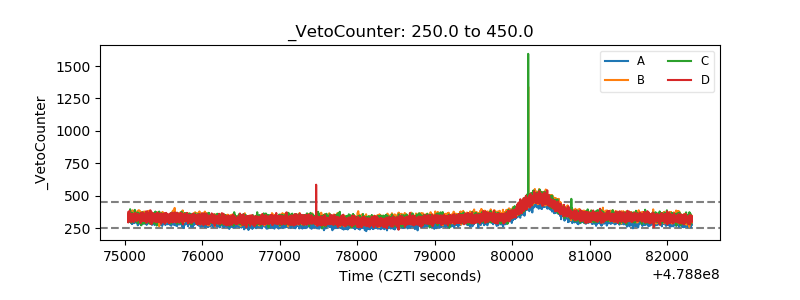 |