| Param | Original file | Final file |
|---|---|---|
| Filename | modeM0/AS1C07_001T02_9000006452_51035cztM0_level2.fits | modeM0/AS1C07_001T02_9000006452_51035cztM0_level2_quad_clean.evt |
| Size (bytes) | 751,561,920 | 89,876,160 |
| Size | 716.7 MB | 85.7 MB |
| Events in quadrant A | 6,859,630 | 604,690 |
| Events in quadrant B | 7,004,459 | 548,385 |
| Events in quadrant C | 6,723,800 | 536,420 |
| Events in quadrant D | 6,695,830 | 547,579 |
| Mode SS | |||
|---|---|---|---|
| Quadrant | BADHDUFLAG | Total packets | Discarded packets |
| A | 0 | 140 | 0 |
| B | 0 | 140 | 0 |
| C | 0 | 140 | 0 |
| D | 0 | 140 | 0 |
| Mode M0 | |||
|---|---|---|---|
| Quadrant | BADHDUFLAG | Total packets | Discarded packets |
| A | 0 | 25225 | 2 |
| B | 0 | 25689 | 0 |
| C | 0 | 24722 | 0 |
| D | 0 | 24747 | 0 |
| Quadrant | Total seconds | Saturated seconds | Saturation percentage |
|---|---|---|---|
| A | 6941 | 636 | 9.162945% |
| B | 6942 | 1612 | 23.220974% |
| C | 6942 | 984 | 14.174589% |
| D | 6942 | 581 | 8.369346% |
Noise dominated data is calculated using 1-second bins in cleaned event files. If a bin has >2000 counts, and if more than 50% of those come from <1% of pixels, then it is considered to be noise-dominated and hence unusable.
| Quadrant | # 1 sec bins | Bins with >0 counts | Bins with >2000 counts | High rate bins dominated by noise | Noise dominated (total time) | Noise dominated (detector-on time) | Marked lightcurve |
|---|---|---|---|---|---|---|---|
| A | 6941 | 6941 | 478 | 478 | 6.89% | 6.89% | 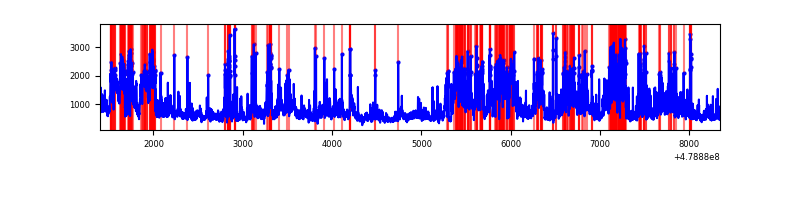 |
| B | 6942 | 6942 | 705 | 705 | 10.16% | 10.16% | 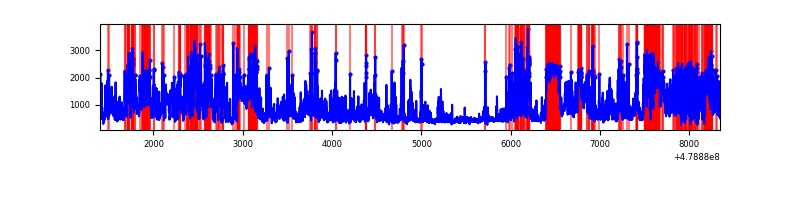 |
| C | 6942 | 6942 | 844 | 844 | 12.16% | 12.16% | 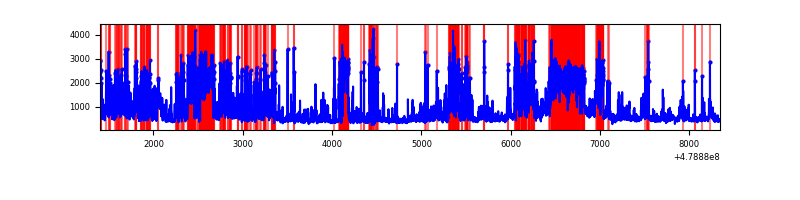 |
| D | 6942 | 6942 | 565 | 565 | 8.14% | 8.14% | 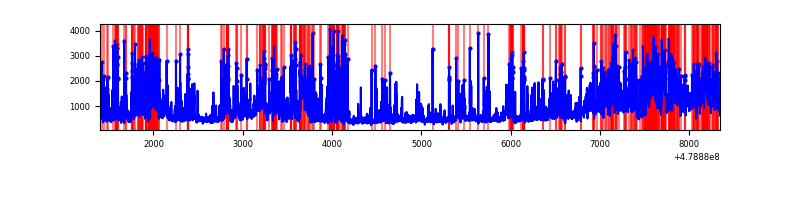 |
Top three noisy pixels from each quadrant. If the there are fewer than three noisy pixels in the level2.evt file, extra rows are filled as -1
| Pixel properties | Quadrant properties | ||||||
|---|---|---|---|---|---|---|---|
| Quadrant | DetID | PixID | Counts | Sigma | Mean | Median | Sigma |
| A | 10 | 253 | 1557824 | 8983.7 | 706 | 689 | 173.3 |
| A | 12 | 80 | 598613 | 3449.65 | 706 | 689 | 173.3 |
| A | 12 | 3 | 570323 | 3286.43 | 706 | 689 | 173.3 |
| B | 12 | 32 | 2138606 | 16196.31 | 619 | 598 | 132.0 |
| B | 4 | 81 | 1255165 | 9503.87 | 619 | 598 | 132.0 |
| B | 5 | 185 | 284427 | 2150.12 | 619 | 598 | 132.0 |
| C | 4 | 5 | 1569299 | 8564.16 | 665 | 660 | 183.2 |
| C | 13 | 49 | 480120 | 2617.67 | 665 | 660 | 183.2 |
| C | 15 | 224 | 351775 | 1916.95 | 665 | 660 | 183.2 |
| D | 8 | 176 | 1706888 | 8969.94 | 678 | 657 | 190.2 |
| D | 2 | 216 | 772145 | 4055.84 | 678 | 657 | 190.2 |
| D | 6 | 173 | 353305 | 1853.93 | 678 | 657 | 190.2 |
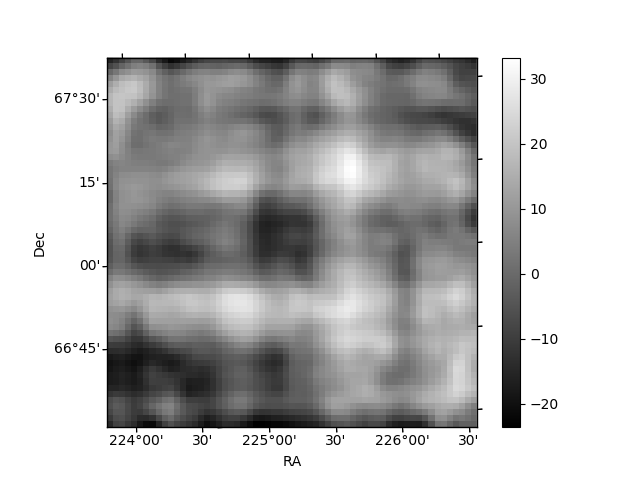
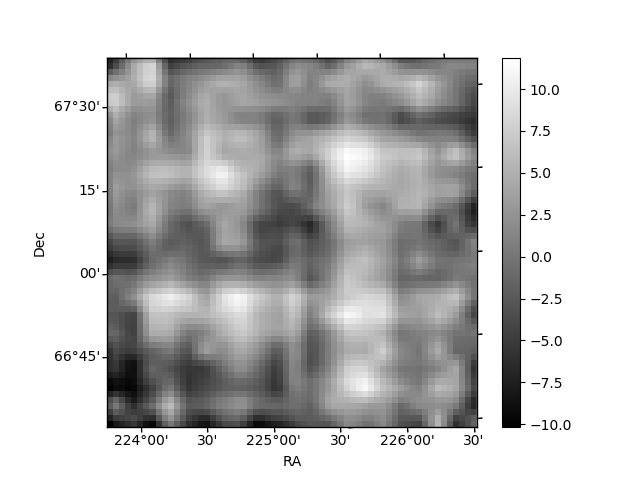
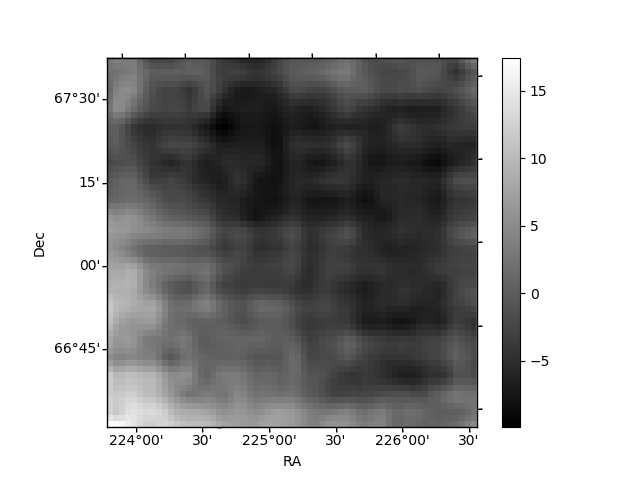
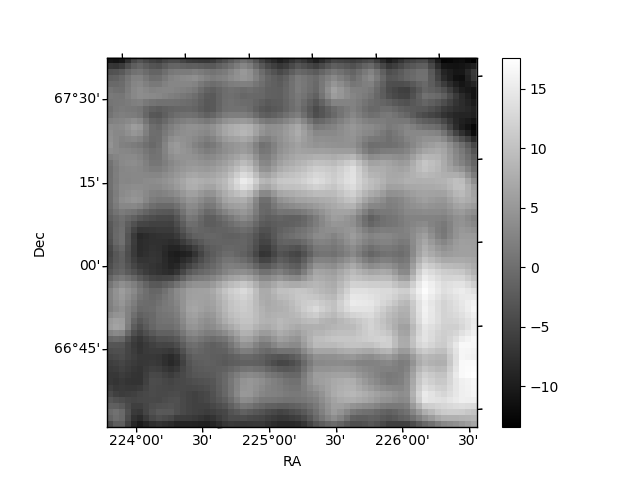
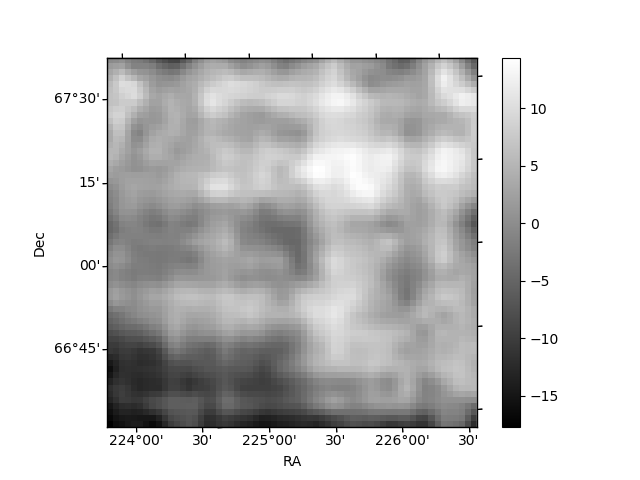
Histogram calculated using DETX and DETY for each event in the final _common_clean file
| Quadrant A | 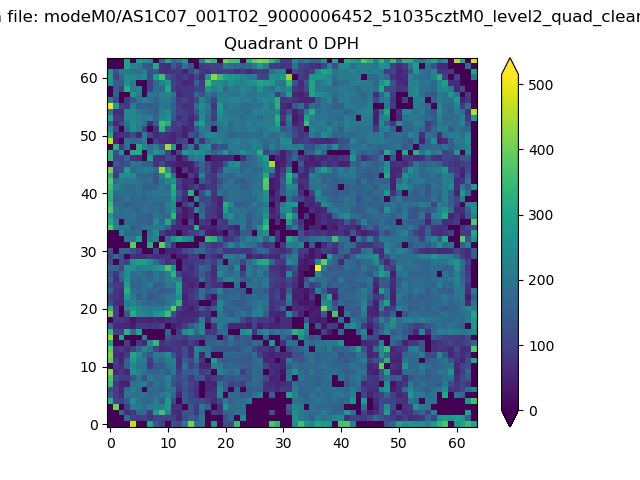 |
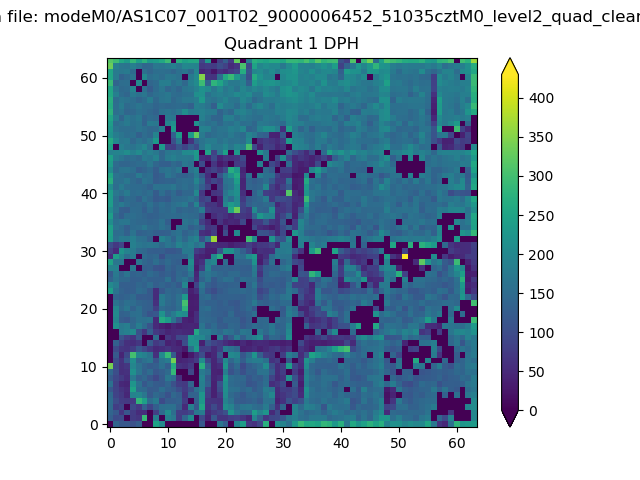 |
Quadrant B |
|---|---|---|---|
| Quadrant D | 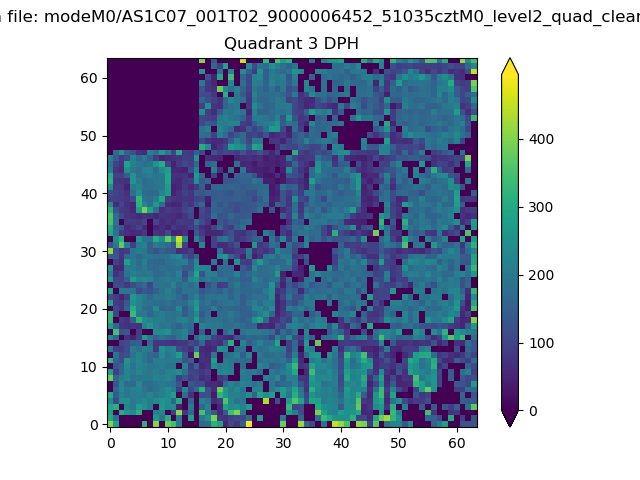 |
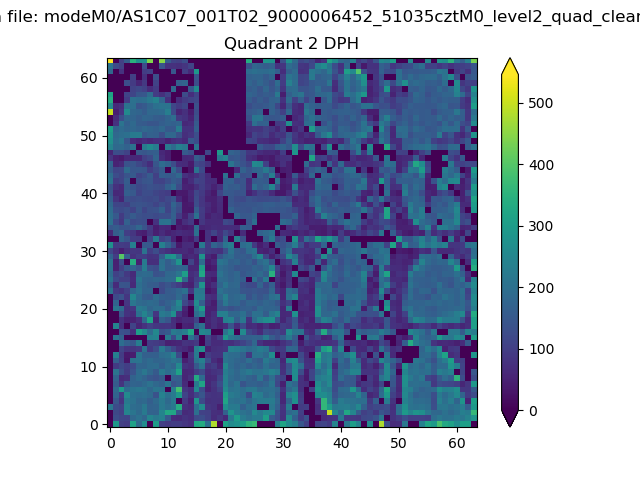 |
Quadrant C |
| Plot type | Count rate plots | Images |
|---|---|---|
| Comparison with Poisson distribution Blue bars denote a histogram of data divided into 1 sec bins. Red curve is a Poisson curve with rate = median count rate of data. |
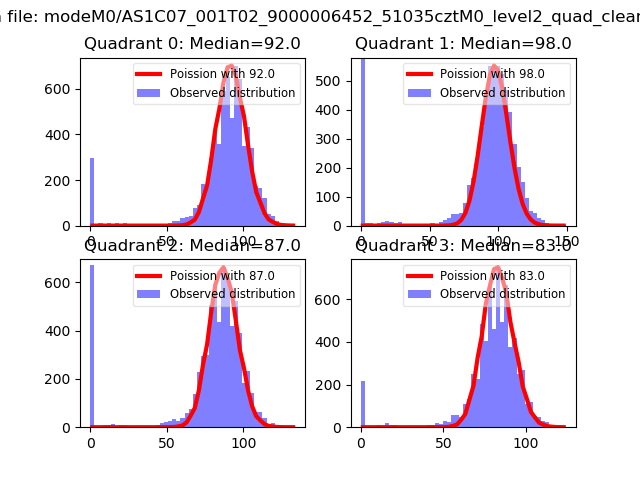 |
 |
| Quadrant-wise count rates Data is divided into 100 sec bins |
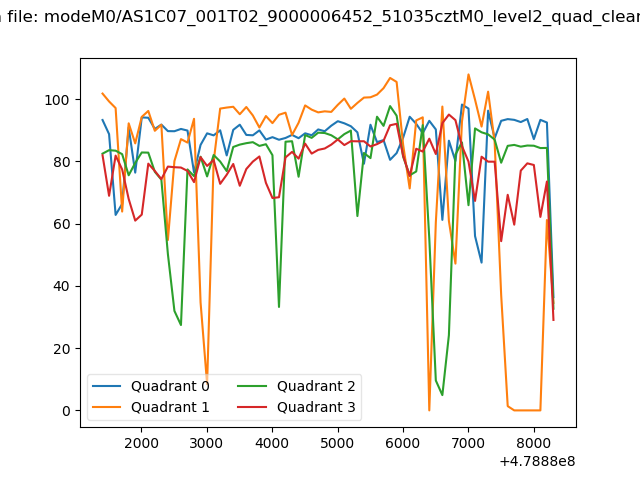 |
|
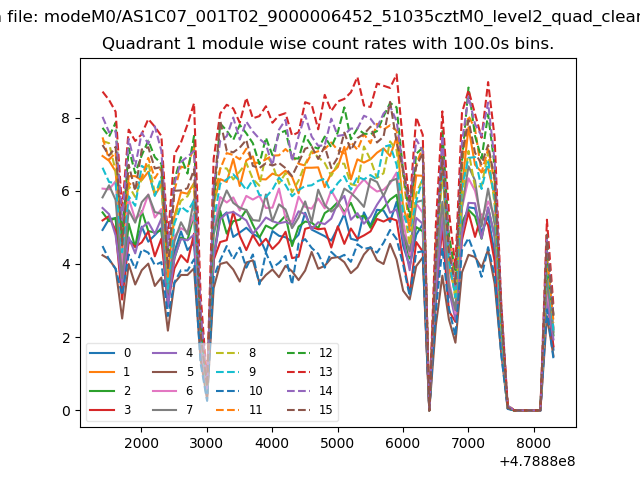
| Module-wise count rates for Quadrant A Data is divided into 100 sec bins |
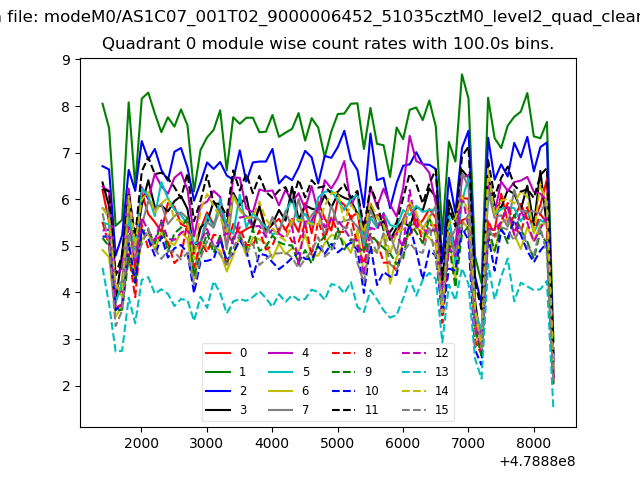 |
 |
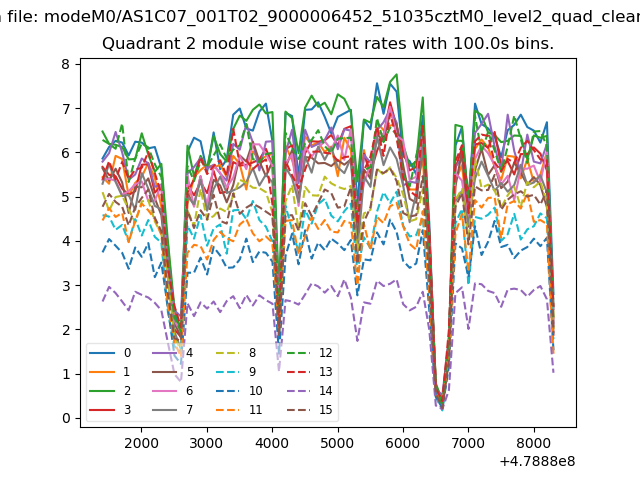
| Module-wise count rates for Quadrant B Data is divided into 100 sec bins |
 |
 |
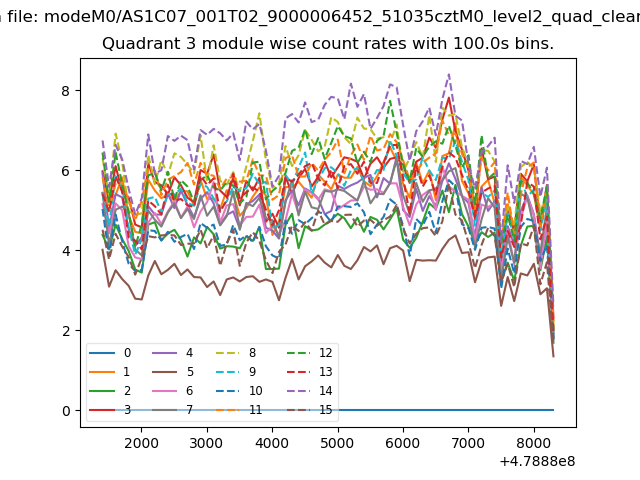
| Module-wise count rates for Quadrant C Data is divided into 100 sec bins |
 |
 |
| Module-wise count rates for Quadrant D Data is divided into 100 sec bins |
 |
 |
| Parameter | Plot |
|---|---|
| CZT HV Monitor | 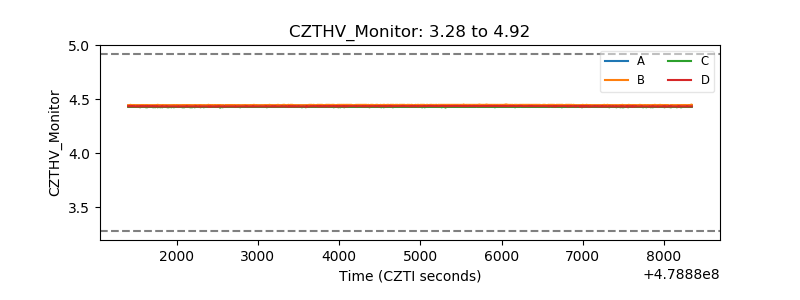 |
| D_VDD | 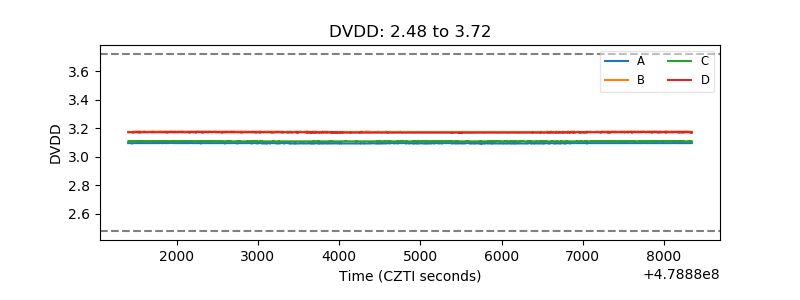 |
| Temperature 1 | 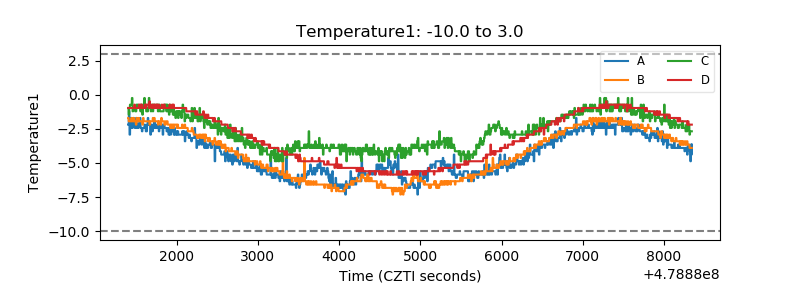 |
| Veto HV Monitor |  |
| Veto LLD | 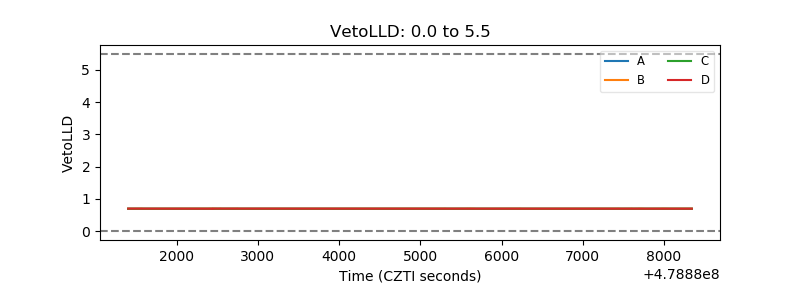 |
| Alpha Counter | 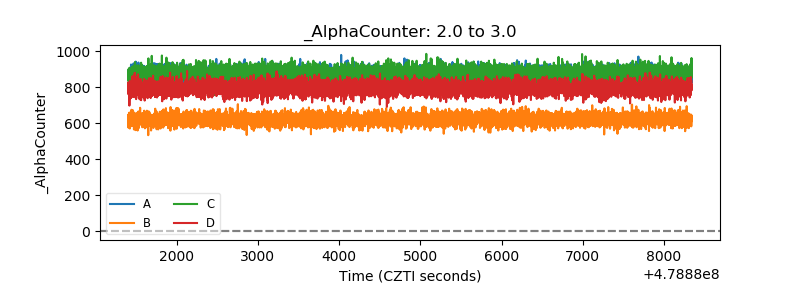 |
| _CPM_Rate | 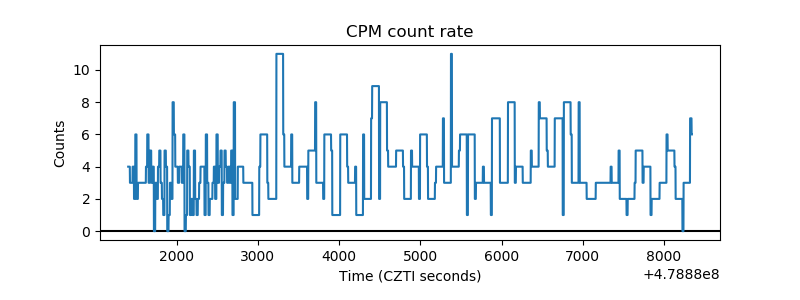 |
| CZT Counter | 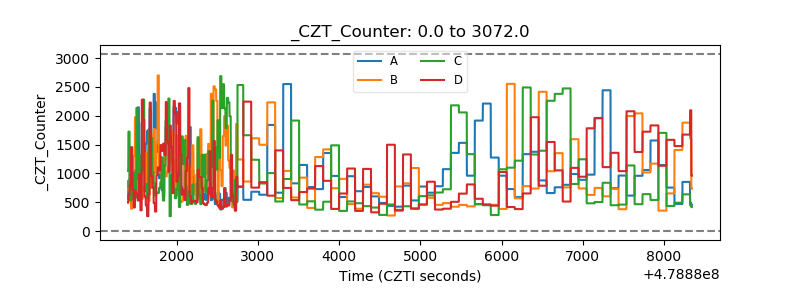 |
| +2.5 Volts monitor | 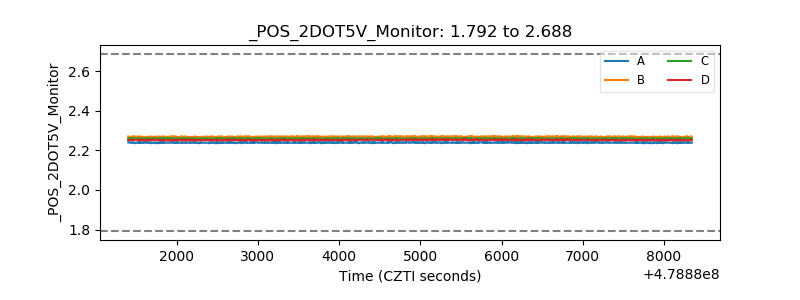 |
| +5 Volts monitor | 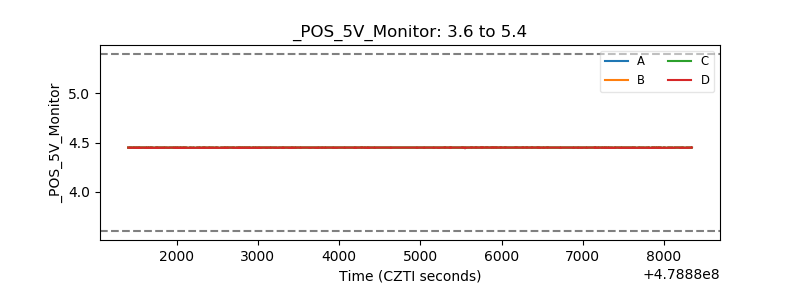 |
| _ROLL_ROT | 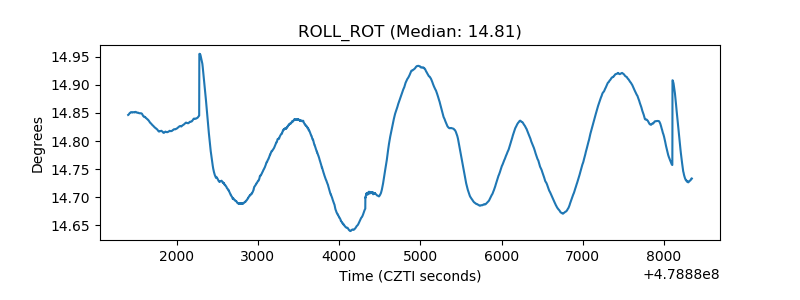 |
| _Roll_DEC | 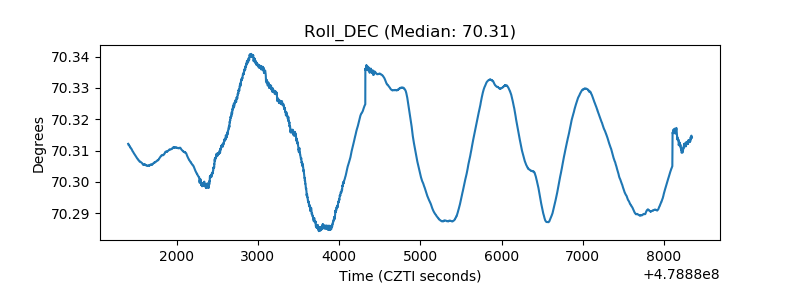 |
| _Roll_RA | 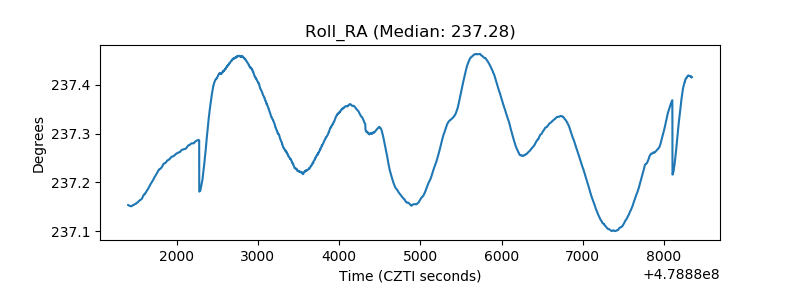 |
| Veto Counter | 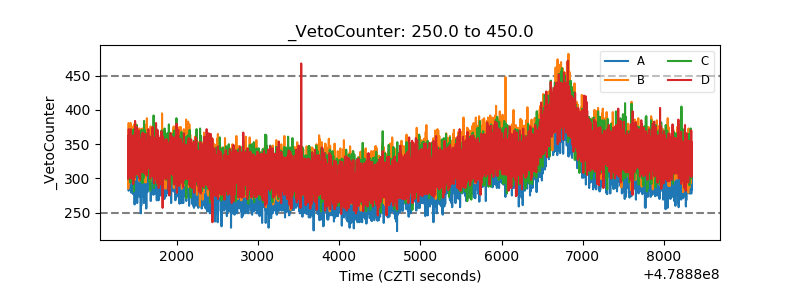 |