| Param | Original file | Final file |
|---|---|---|
| Filename | modeM0/AS1C07_001T02_9000006452_51036cztM0_level2.fits | modeM0/AS1C07_001T02_9000006452_51036cztM0_level2_quad_clean.evt |
| Size (bytes) | 917,628,480 | 101,502,720 |
| Size | 875.1 MB | 96.8 MB |
| Events in quadrant A | 7,977,980 | 707,697 |
| Events in quadrant B | 9,121,101 | 589,573 |
| Events in quadrant C | 7,553,239 | 621,680 |
| Events in quadrant D | 8,706,764 | 605,124 |
| Mode SS | |||
|---|---|---|---|
| Quadrant | BADHDUFLAG | Total packets | Discarded packets |
| A | 0 | 158 | 0 |
| B | 0 | 158 | 0 |
| C | 0 | 158 | 0 |
| D | 0 | 158 | 0 |
| Mode M0 | |||
|---|---|---|---|
| Quadrant | BADHDUFLAG | Total packets | Discarded packets |
| A | 0 | 29341 | 0 |
| B | 0 | 32604 | 0 |
| C | 0 | 27810 | 1 |
| D | 0 | 31444 | 0 |
| Quadrant | Total seconds | Saturated seconds | Saturation percentage |
|---|---|---|---|
| A | 7889 | 507 | 6.426670% |
| B | 7889 | 2301 | 29.167195% |
| C | 7889 | 967 | 12.257574% |
| D | 7889 | 906 | 11.484345% |
Noise dominated data is calculated using 1-second bins in cleaned event files. If a bin has >2000 counts, and if more than 50% of those come from <1% of pixels, then it is considered to be noise-dominated and hence unusable.
| Quadrant | # 1 sec bins | Bins with >0 counts | Bins with >2000 counts | High rate bins dominated by noise | Noise dominated (total time) | Noise dominated (detector-on time) | Marked lightcurve |
|---|---|---|---|---|---|---|---|
| A | 7889 | 7889 | 398 | 398 | 5.04% | 5.04% | 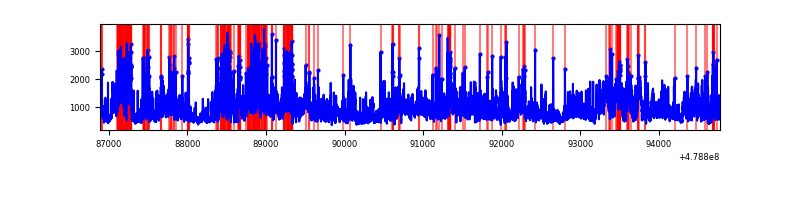 |
| B | 7889 | 7889 | 1139 | 1139 | 14.44% | 14.44% | 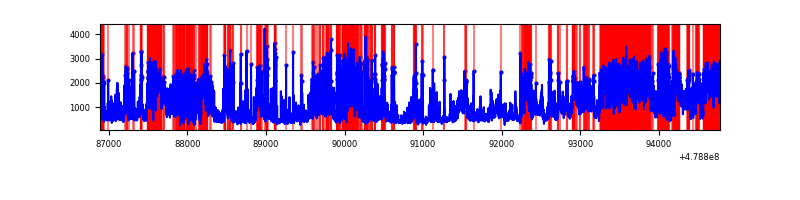 |
| C | 7889 | 7889 | 906 | 906 | 11.48% | 11.48% | 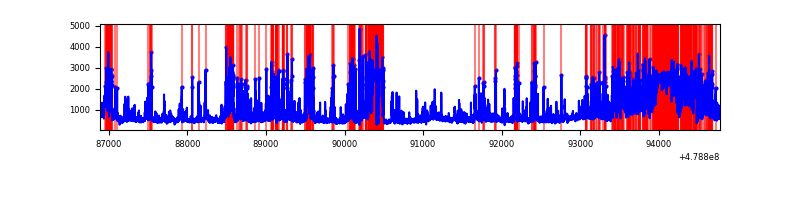 |
| D | 7889 | 7889 | 806 | 806 | 10.22% | 10.22% | 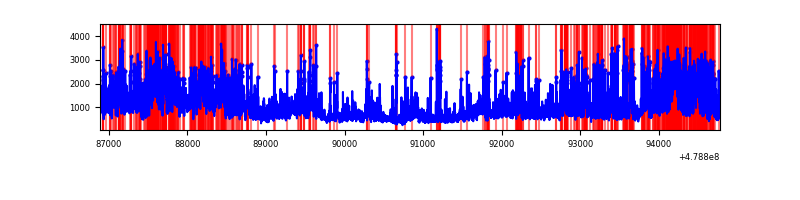 |
Top three noisy pixels from each quadrant. If the there are fewer than three noisy pixels in the level2.evt file, extra rows are filled as -1
| Pixel properties | Quadrant properties | ||||||
|---|---|---|---|---|---|---|---|
| Quadrant | DetID | PixID | Counts | Sigma | Mean | Median | Sigma |
| A | 10 | 253 | 2294842 | 11439.68 | 817 | 798 | 200.5 |
| A | 12 | 3 | 694251 | 3458.03 | 817 | 798 | 200.5 |
| A | 11 | 3 | 241702 | 1201.31 | 817 | 798 | 200.5 |
| B | 12 | 32 | 2984309 | 19557.46 | 715 | 689 | 152.6 |
| B | 4 | 81 | 823021 | 5390.34 | 715 | 689 | 152.6 |
| B | 3 | 249 | 685980 | 4492.04 | 715 | 689 | 152.6 |
| C | 4 | 5 | 1030069 | 4842.11 | 768 | 759 | 212.6 |
| C | 12 | 247 | 801561 | 3767.16 | 768 | 759 | 212.6 |
| C | 15 | 147 | 629363 | 2957.1 | 768 | 759 | 212.6 |
| D | 8 | 176 | 3105484 | 14247.7 | 780 | 751 | 217.9 |
| D | 7 | 126 | 421546 | 1931.04 | 780 | 751 | 217.9 |
| D | 7 | 110 | 280720 | 1284.78 | 780 | 751 | 217.9 |
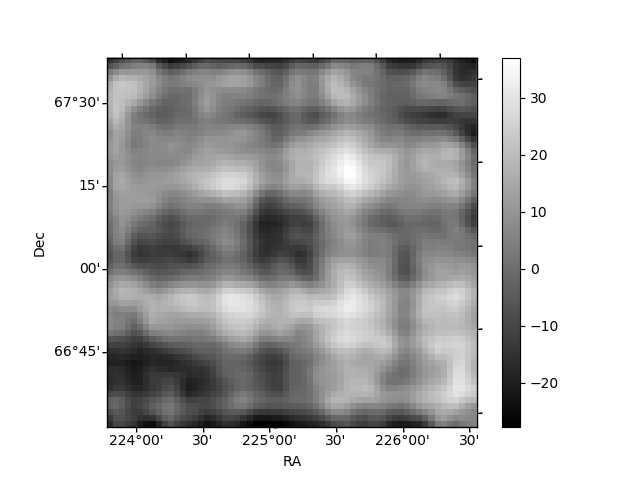
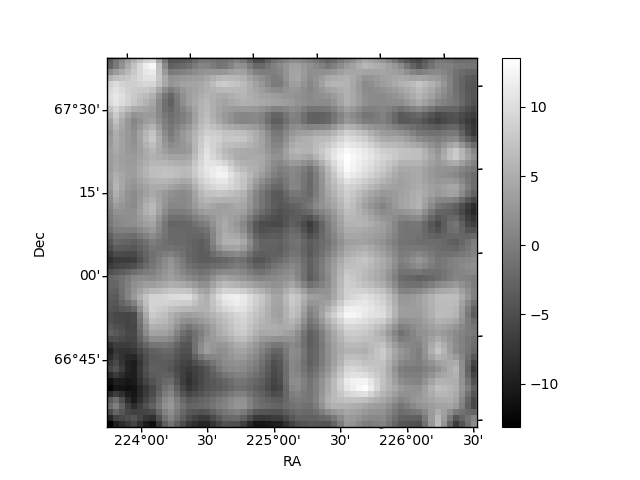
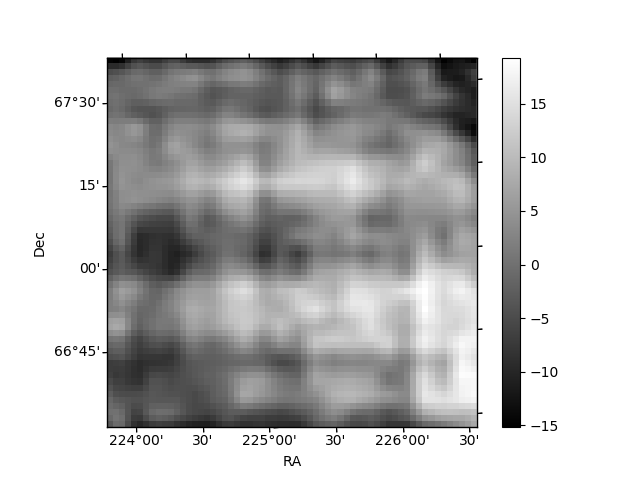
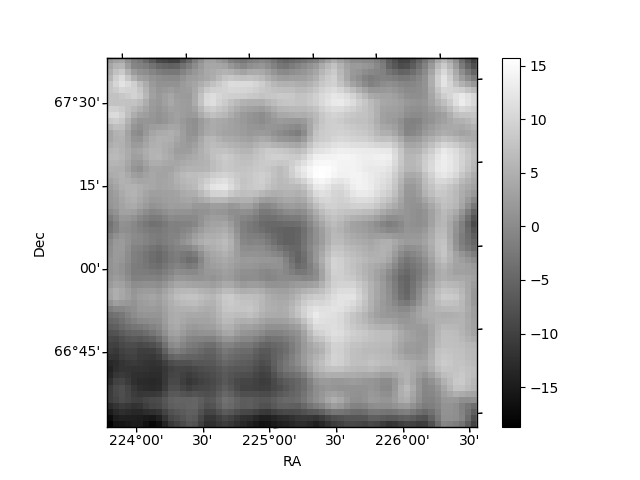
Histogram calculated using DETX and DETY for each event in the final _common_clean file
| Quadrant A | 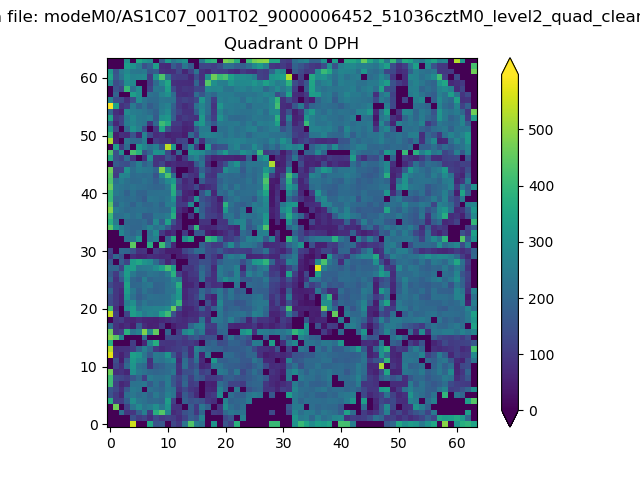 |
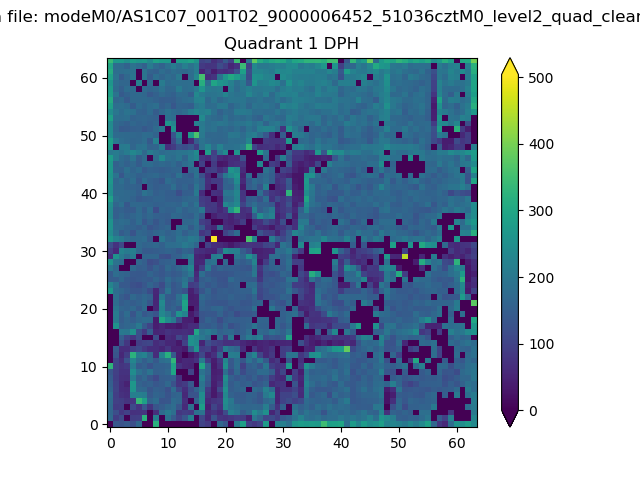 |
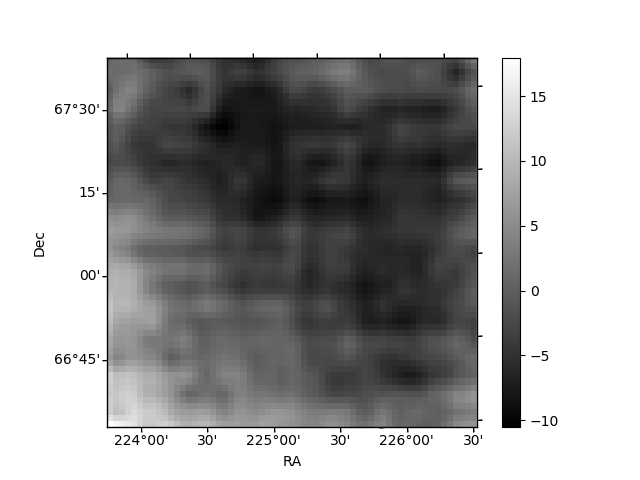
Quadrant B |
|---|---|---|---|
| Quadrant D | 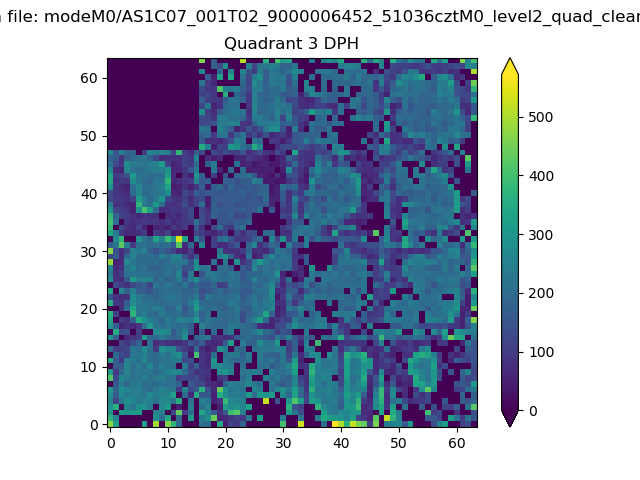 |
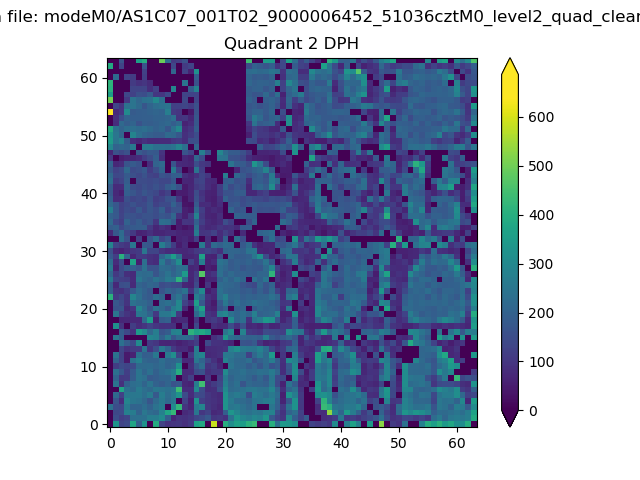 |
Quadrant C |
| Plot type | Count rate plots | Images |
|---|---|---|
| Comparison with Poisson distribution Blue bars denote a histogram of data divided into 1 sec bins. Red curve is a Poisson curve with rate = median count rate of data. |
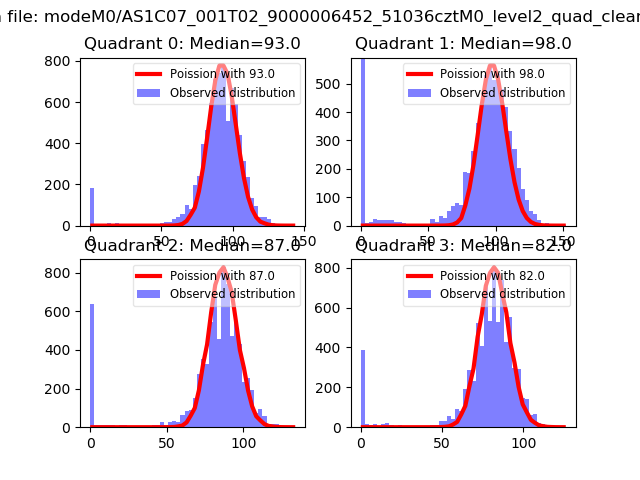 |
 |
| Quadrant-wise count rates Data is divided into 100 sec bins |
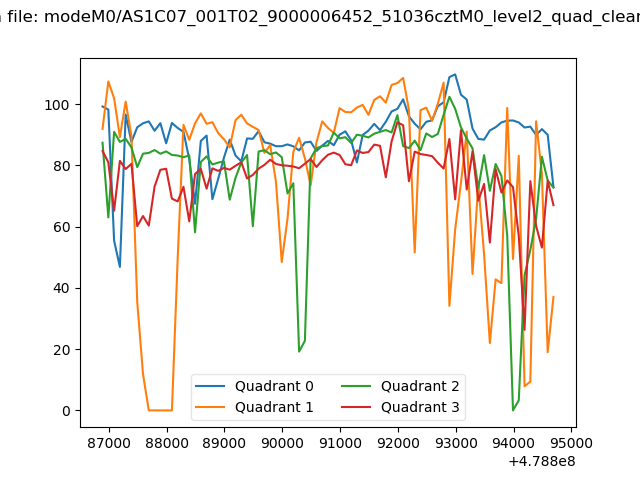 |
|
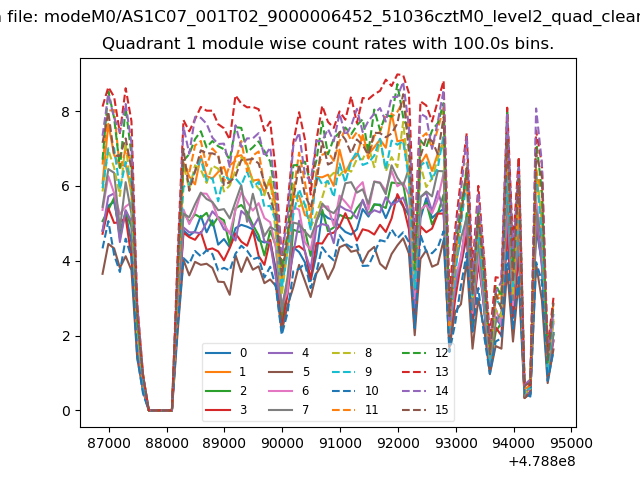
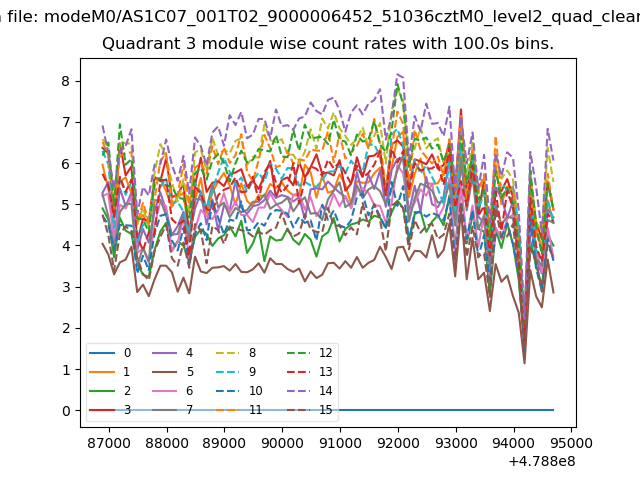
| Module-wise count rates for Quadrant A Data is divided into 100 sec bins |
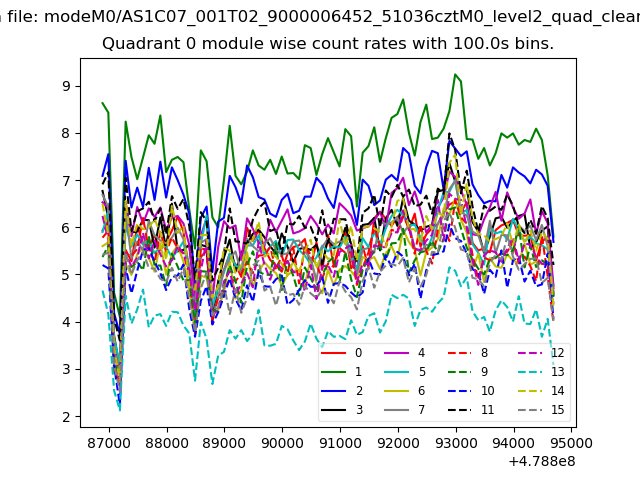 |
 |
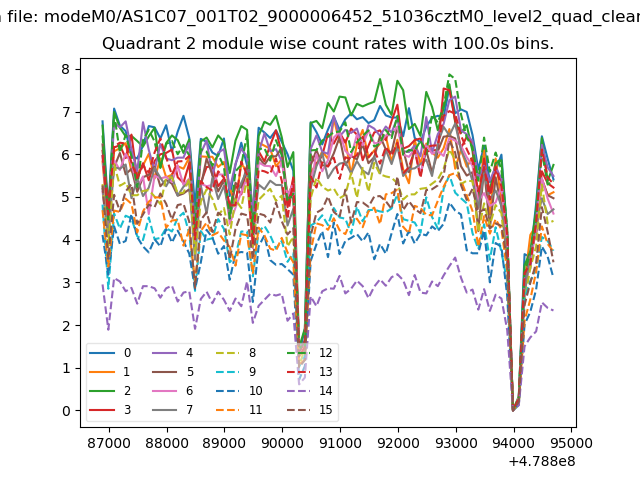
| Module-wise count rates for Quadrant B Data is divided into 100 sec bins |
 |
 |
| Module-wise count rates for Quadrant C Data is divided into 100 sec bins |
 |
 |
| Module-wise count rates for Quadrant D Data is divided into 100 sec bins |
 |
 |
| Parameter | Plot |
|---|---|
| CZT HV Monitor |  |
| D_VDD | 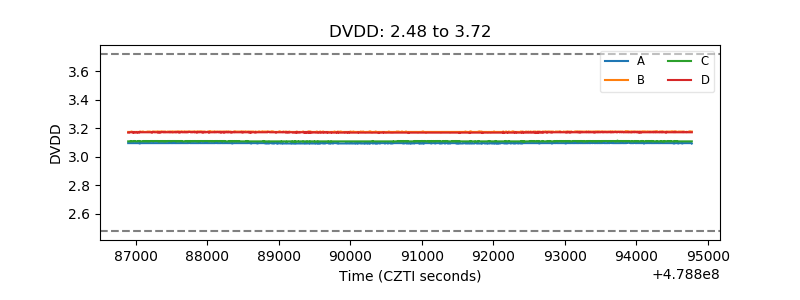 |
| Temperature 1 | 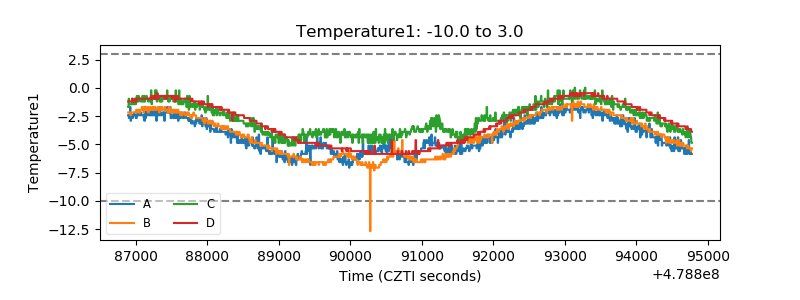 |
| Veto HV Monitor | 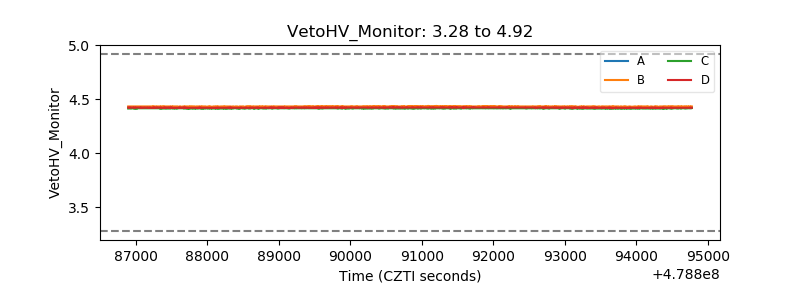 |
| Veto LLD | 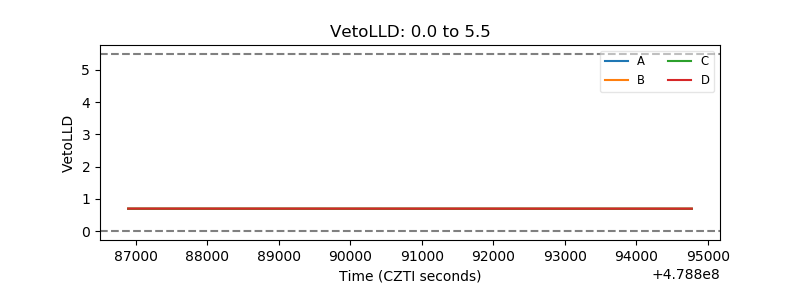 |
| Alpha Counter | 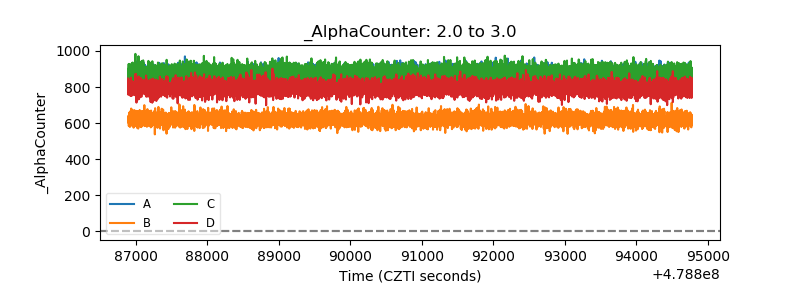 |
| _CPM_Rate | 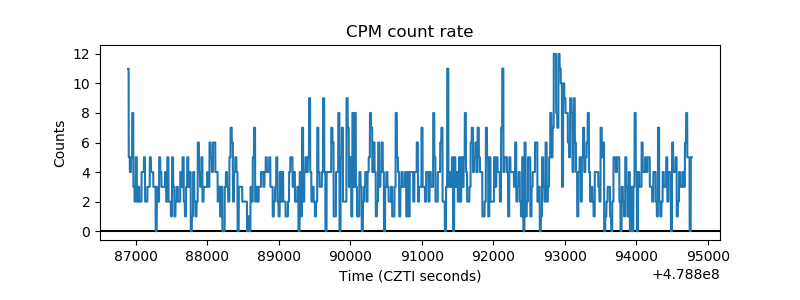 |
| CZT Counter | 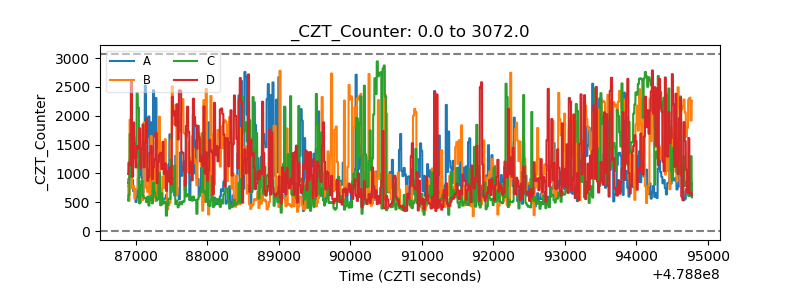 |
| +2.5 Volts monitor | 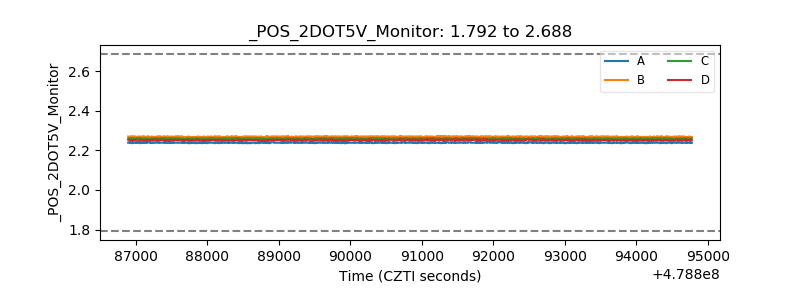 |
| +5 Volts monitor | 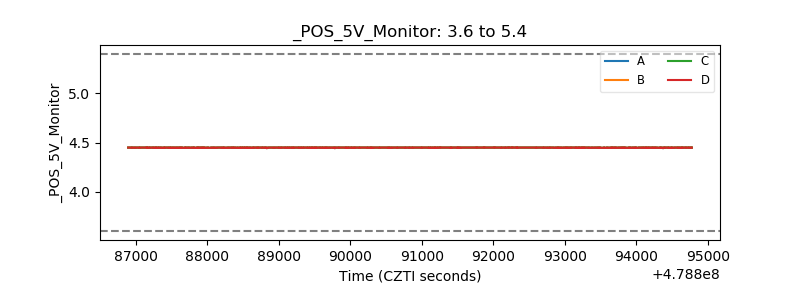 |
| _ROLL_ROT | 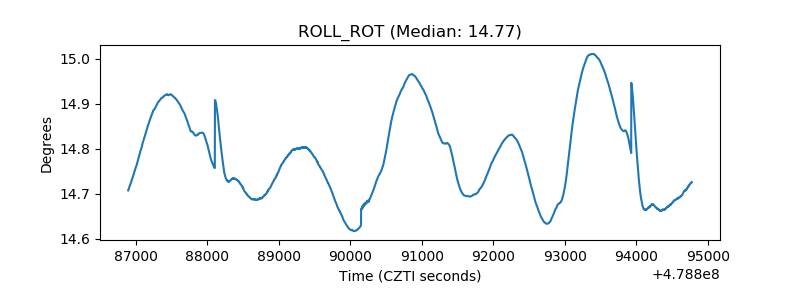 |
| _Roll_DEC | 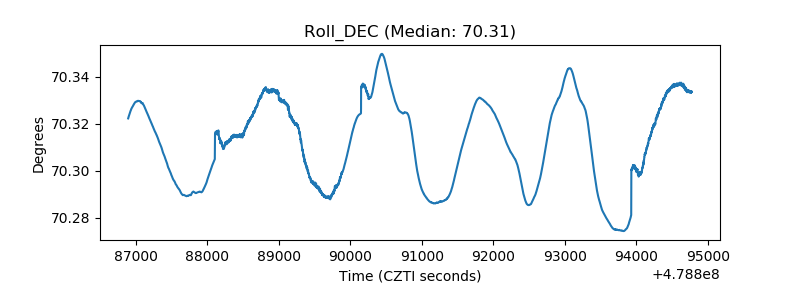 |
| _Roll_RA | 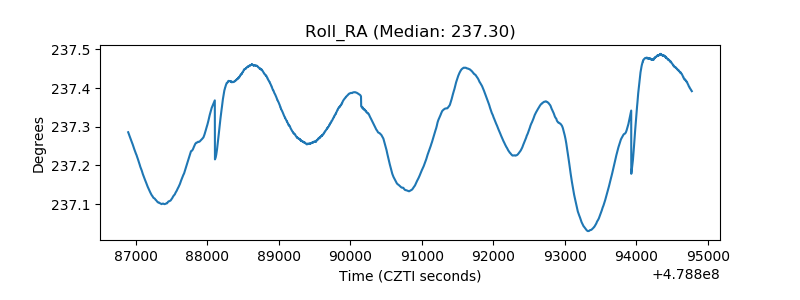 |
| Veto Counter | 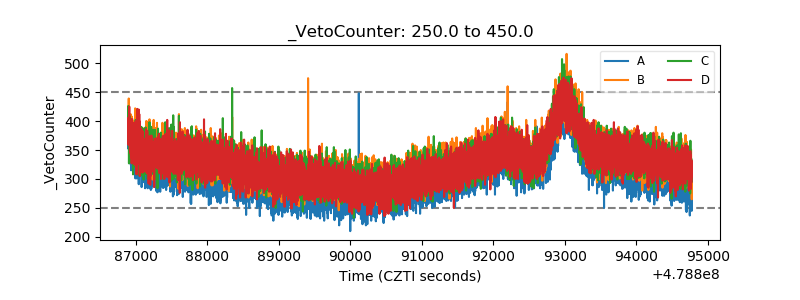 |