| Param | Original file | Final file |
|---|---|---|
| Filename | modeM0/AS1C07_001T02_9000006452_51039cztM0_level2.fits | modeM0/AS1C07_001T02_9000006452_51039cztM0_level2_quad_clean.evt |
| Size (bytes) | 2,072,298,240 | 229,806,720 |
| Size | 1.9 GB | 219.2 MB |
| Events in quadrant A | 16,961,374 | 1,570,182 |
| Events in quadrant B | 18,038,057 | 1,519,485 |
| Events in quadrant C | 16,618,846 | 1,446,799 |
| Events in quadrant D | 23,670,919 | 1,147,761 |
| Mode SS | |||
|---|---|---|---|
| Quadrant | BADHDUFLAG | Total packets | Discarded packets |
| A | 0 | 376 | 0 |
| B | 0 | 376 | 0 |
| C | 0 | 376 | 0 |
| D | 0 | 376 | 0 |
| Mode M9 | |||
|---|---|---|---|
| Quadrant | BADHDUFLAG | Total packets | Discarded packets |
| A | 0 | 12 | 0 |
| B | 0 | 12 | 0 |
| C | 0 | 12 | 0 |
| D | 0 | 12 | 0 |
| Mode M0 | |||
|---|---|---|---|
| Quadrant | BADHDUFLAG | Total packets | Discarded packets |
| A | 0 | 63323 | 3 |
| B | 0 | 66522 | 3 |
| C | 0 | 62406 | 3 |
| D | 0 | 83406 | 7 |
| Quadrant | Total seconds | Saturated seconds | Saturation percentage |
|---|---|---|---|
| A | 18462 | 1237 | 6.700249% |
| B | 18463 | 3209 | 17.380707% |
| C | 18463 | 2193 | 11.877810% |
| D | 18462 | 4790 | 25.945185% |
Noise dominated data is calculated using 1-second bins in cleaned event files. If a bin has >2000 counts, and if more than 50% of those come from <1% of pixels, then it is considered to be noise-dominated and hence unusable.
| Quadrant | # 1 sec bins | Bins with >0 counts | Bins with >2000 counts | High rate bins dominated by noise | Noise dominated (total time) | Noise dominated (detector-on time) | Marked lightcurve |
|---|---|---|---|---|---|---|---|
| A | 19727 | 18465 | 994 | 994 | 5.04% | 5.38% | 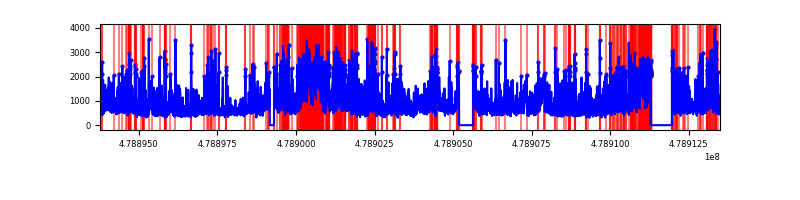 |
| B | 19728 | 18467 | 2181 | 2181 | 11.06% | 11.81% | 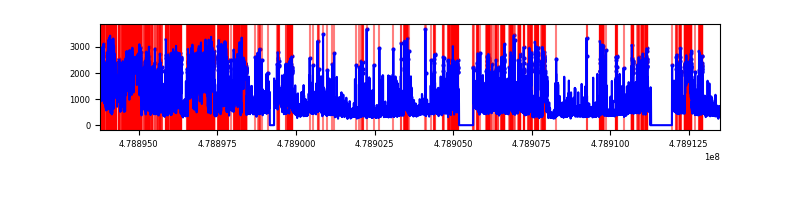 |
| C | 19728 | 18467 | 1869 | 1869 | 9.47% | 10.12% | 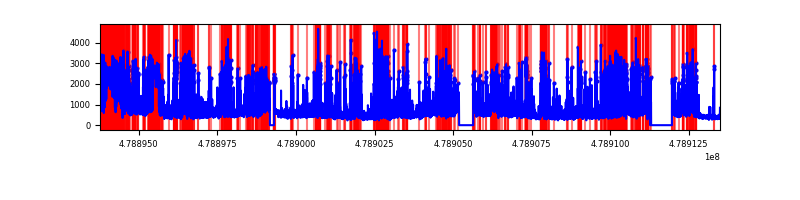 |
| D | 19726 | 18462 | 4447 | 4447 | 22.54% | 24.09% | 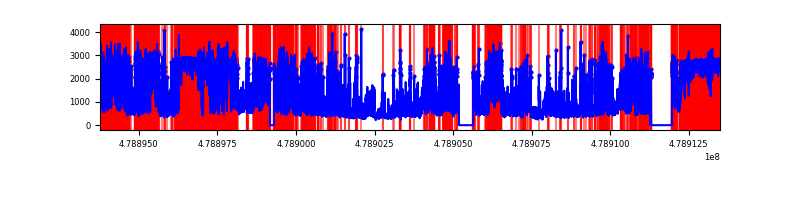 |
Top three noisy pixels from each quadrant. If the there are fewer than three noisy pixels in the level2.evt file, extra rows are filled as -1
| Pixel properties | Quadrant properties | ||||||
|---|---|---|---|---|---|---|---|
| Quadrant | DetID | PixID | Counts | Sigma | Mean | Median | Sigma |
| A | 10 | 253 | 2728879 | 5879.89 | 1885 | 1841 | 463.8 |
| A | 12 | 3 | 1901216 | 4095.33 | 1885 | 1841 | 463.8 |
| A | 12 | 80 | 1365442 | 2940.12 | 1885 | 1841 | 463.8 |
| B | 12 | 32 | 3585929 | 9480.8 | 1792 | 1728 | 378.0 |
| B | 3 | 249 | 2722130 | 7195.91 | 1792 | 1728 | 378.0 |
| B | 4 | 81 | 1802617 | 4763.64 | 1792 | 1728 | 378.0 |
| C | 13 | 3 | 1885458 | 3786.29 | 1795 | 1783 | 497.5 |
| C | 4 | 5 | 1328732 | 2667.24 | 1795 | 1783 | 497.5 |
| C | 15 | 147 | 1271247 | 2551.69 | 1795 | 1783 | 497.5 |
| D | 8 | 176 | 4940088 | 10734.66 | 1635 | 1583 | 460.1 |
| D | 15 | 93 | 2914760 | 6332.27 | 1635 | 1583 | 460.1 |
| D | 15 | 184 | 2764168 | 6004.94 | 1635 | 1583 | 460.1 |
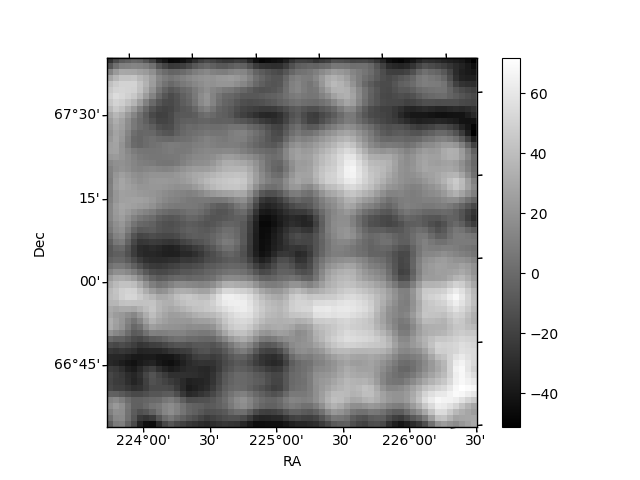
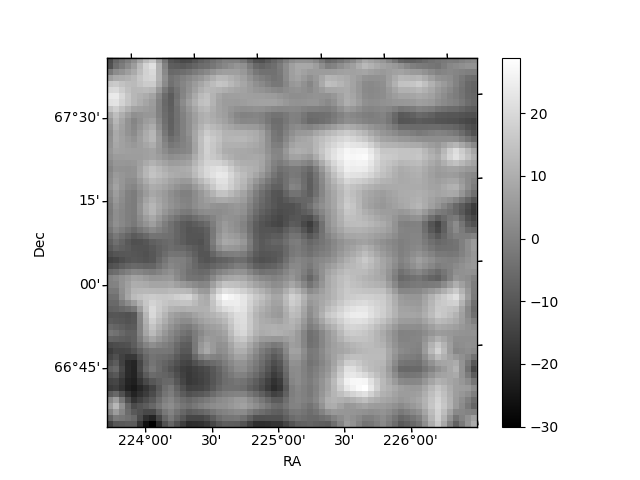
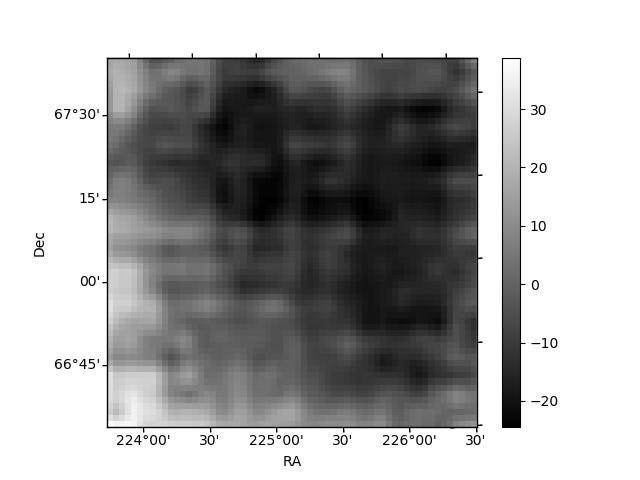
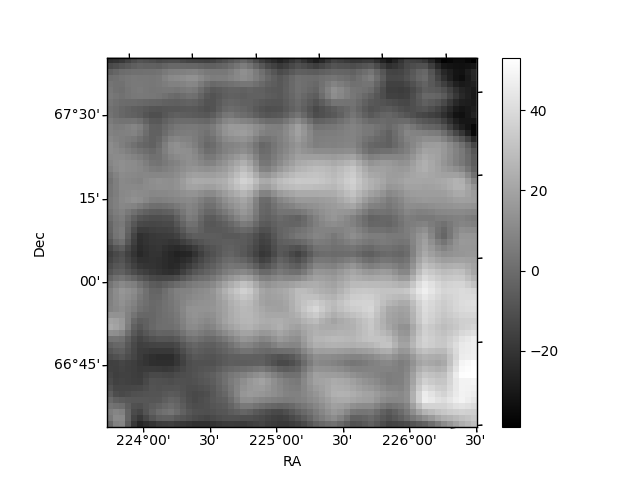
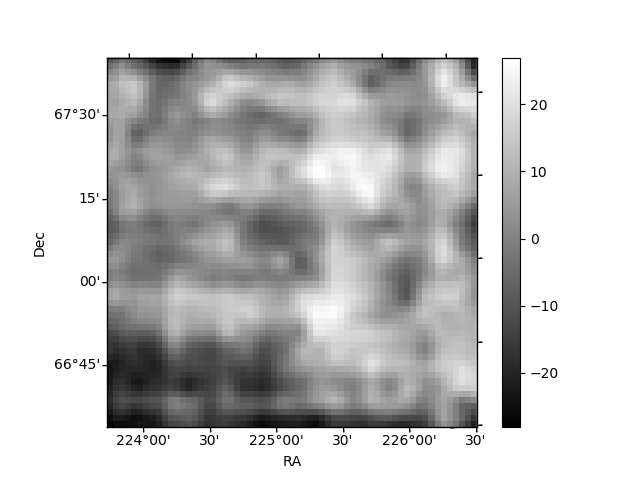
Histogram calculated using DETX and DETY for each event in the final _common_clean file
| Quadrant A | 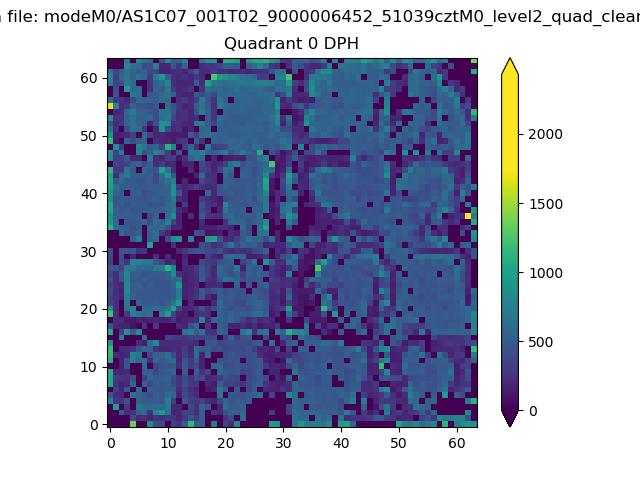 |
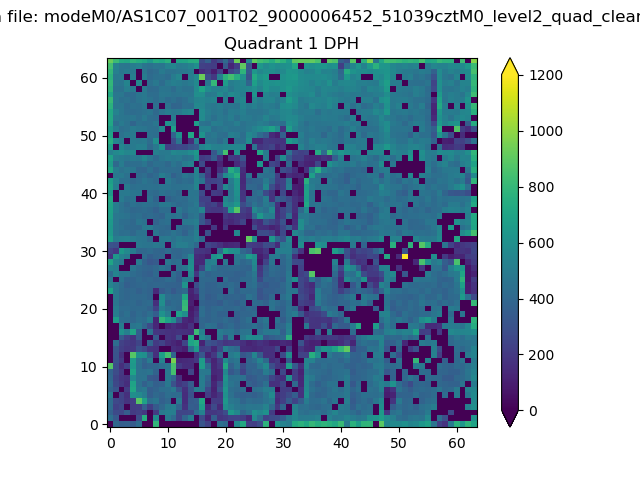 |
Quadrant B |
|---|---|---|---|
| Quadrant D | 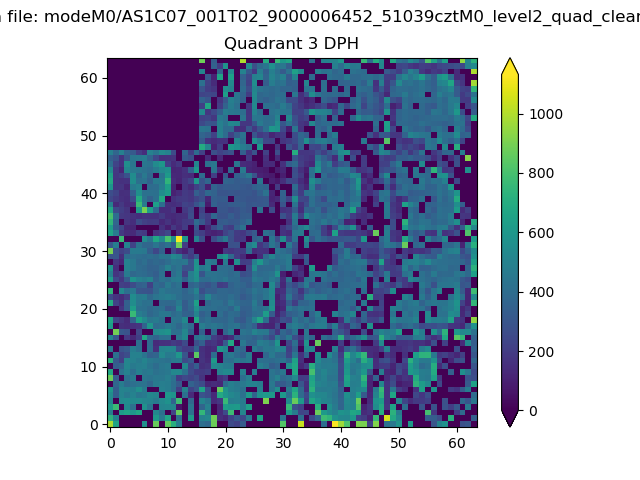 |
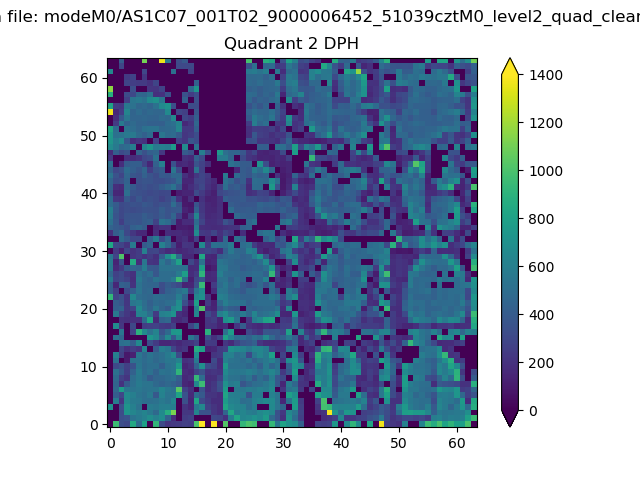 |
Quadrant C |
| Plot type | Count rate plots | Images |
|---|---|---|
| Comparison with Poisson distribution Blue bars denote a histogram of data divided into 1 sec bins. Red curve is a Poisson curve with rate = median count rate of data. |
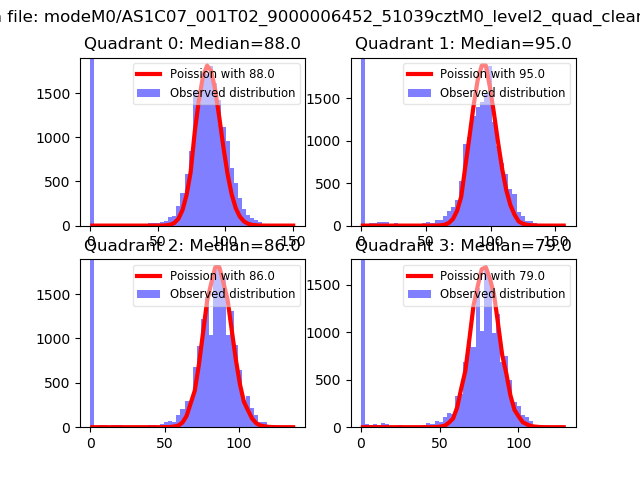 |
 |
| Quadrant-wise count rates Data is divided into 100 sec bins |
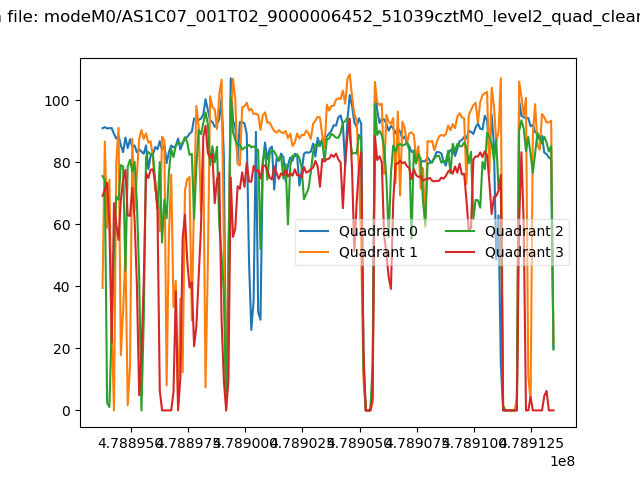 |
|
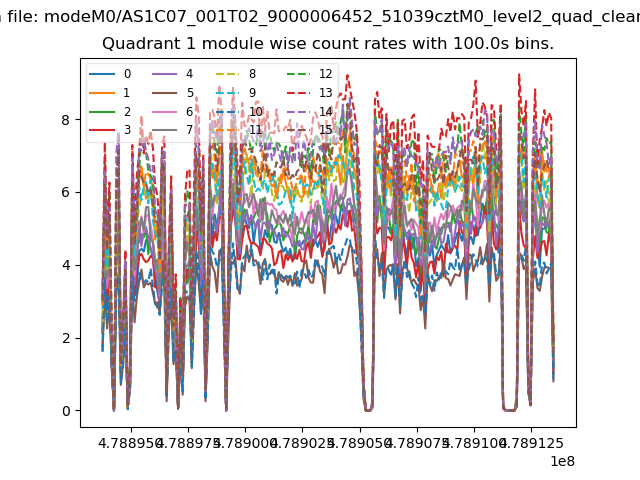
| Module-wise count rates for Quadrant A Data is divided into 100 sec bins |
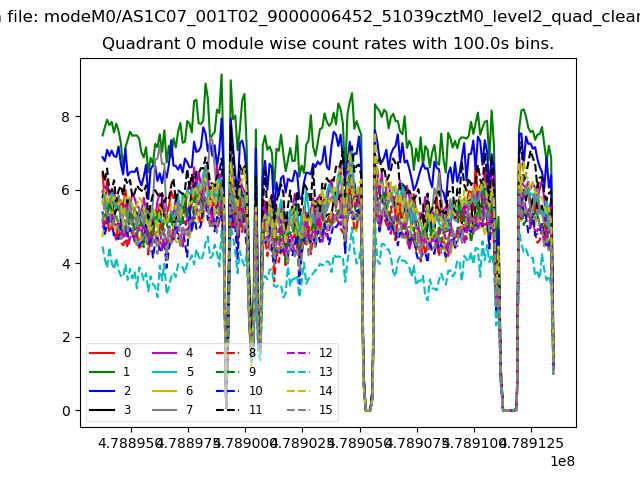 |
 |
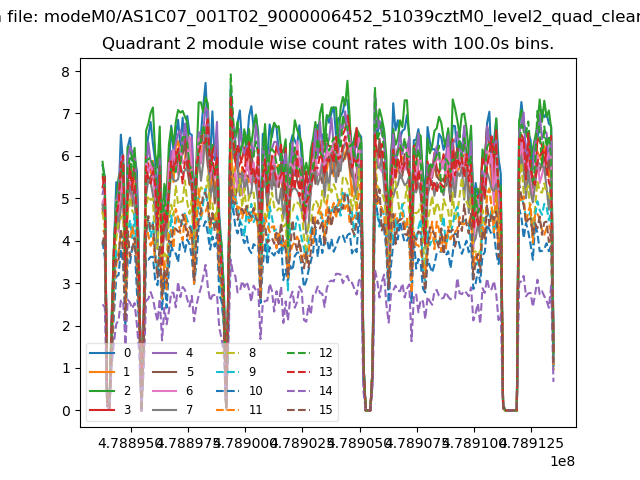
| Module-wise count rates for Quadrant B Data is divided into 100 sec bins |
 |
 |
| Module-wise count rates for Quadrant C Data is divided into 100 sec bins |
 |
 |
| Module-wise count rates for Quadrant D Data is divided into 100 sec bins |
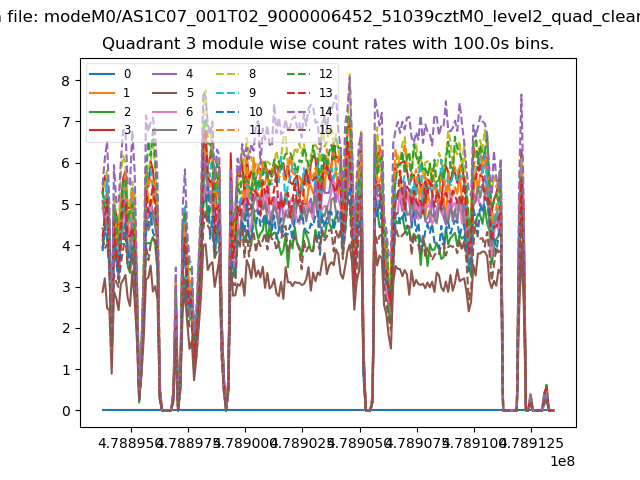 |
 |
| Parameter | Plot |
|---|---|
| CZT HV Monitor | 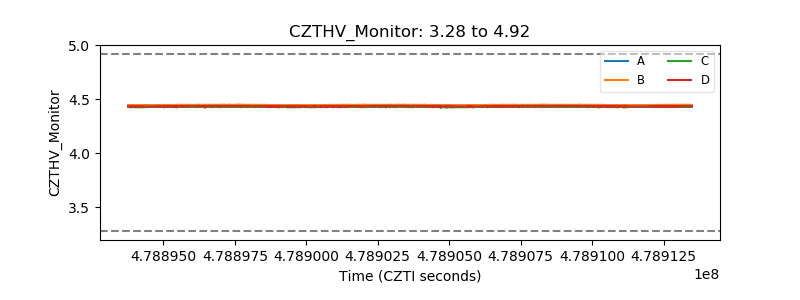 |
| D_VDD | 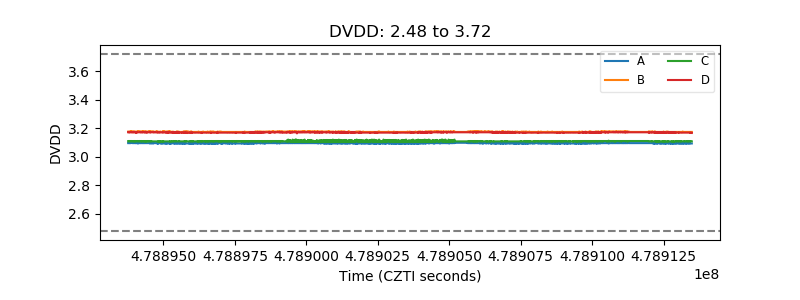 |
| Temperature 1 | 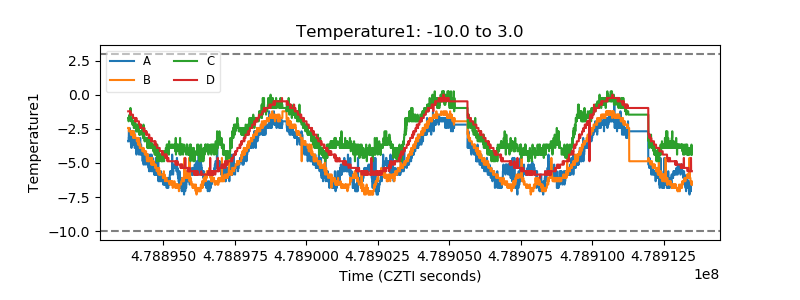 |
| Veto HV Monitor | 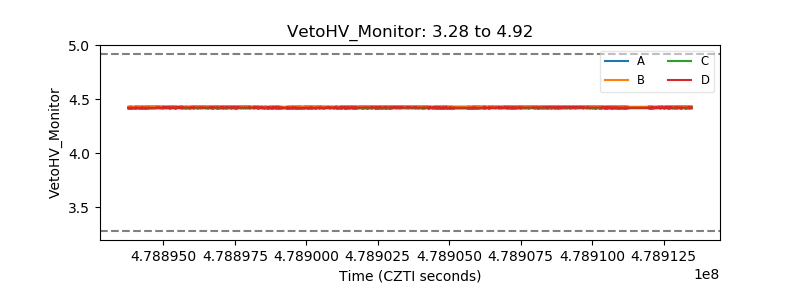 |
| Veto LLD | 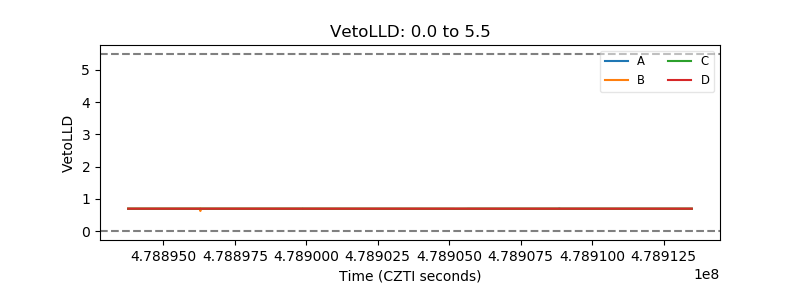 |
| Alpha Counter | 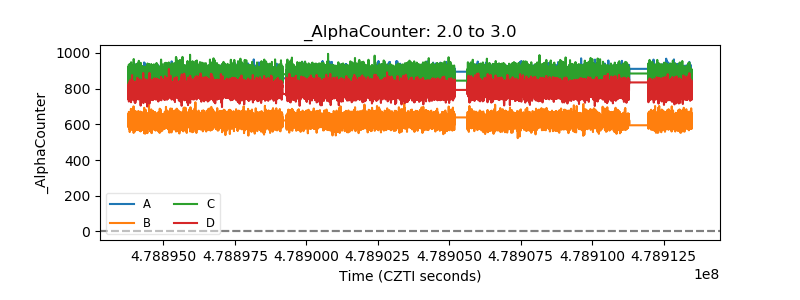 |
| _CPM_Rate | 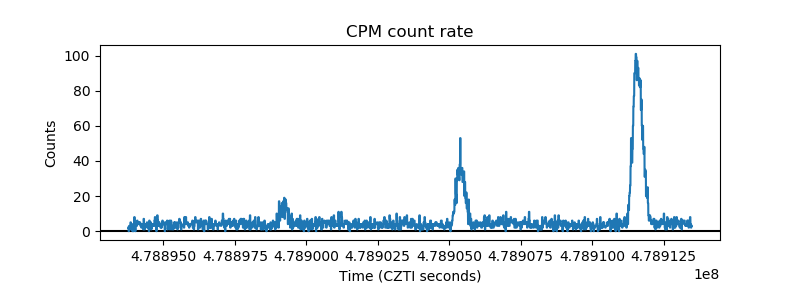 |
| CZT Counter | 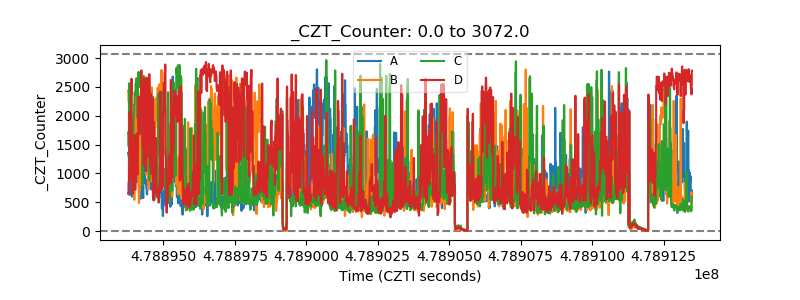 |
| +2.5 Volts monitor | 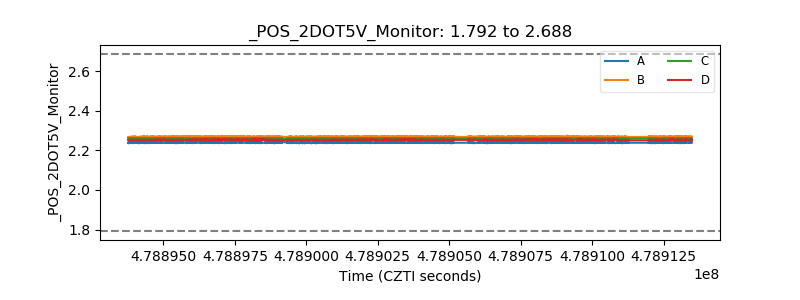 |
| +5 Volts monitor | 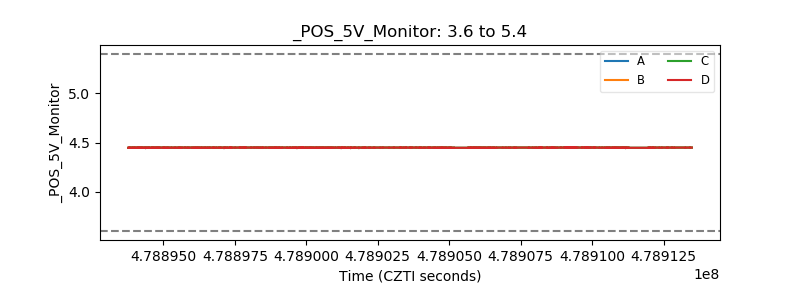 |
| _ROLL_ROT | 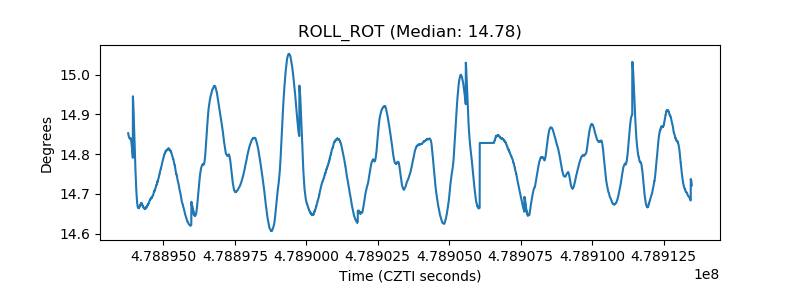 |
| _Roll_DEC | 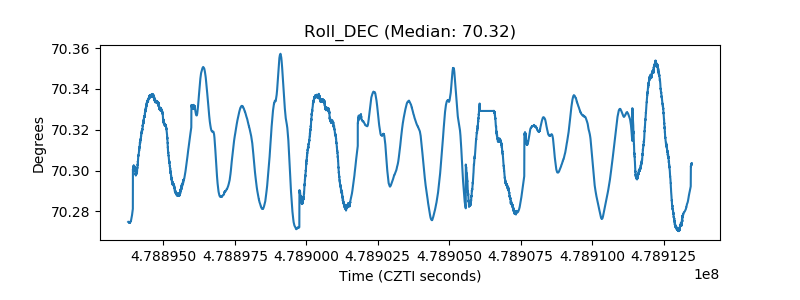 |
| _Roll_RA | 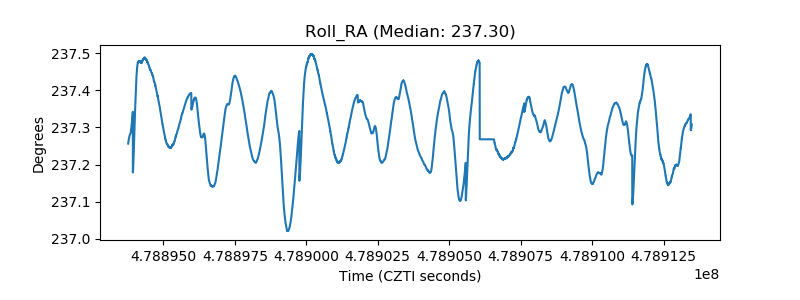 |
| Veto Counter | 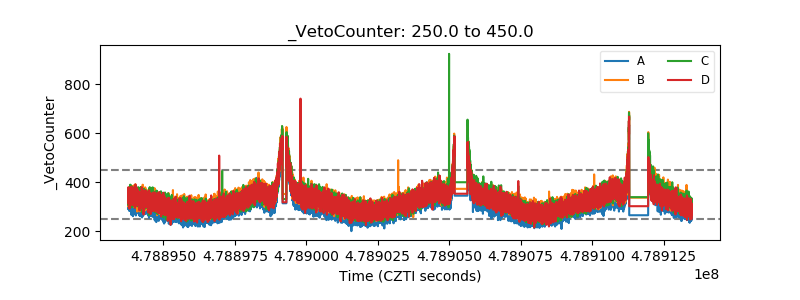 |