| Param | Original file | Final file |
|---|---|---|
| Filename | modeM0/AS1C07_001T02_9000006452_51040cztM0_level2.fits | modeM0/AS1C07_001T02_9000006452_51040cztM0_level2_quad_clean.evt |
| Size (bytes) | 851,351,040 | 81,288,000 |
| Size | 811.9 MB | 77.5 MB |
| Events in quadrant A | 6,359,739 | 588,123 |
| Events in quadrant B | 5,356,234 | 621,564 |
| Events in quadrant C | 5,398,806 | 568,612 |
| Events in quadrant D | 13,880,833 | 215,393 |
| Mode SS | |||
|---|---|---|---|
| Quadrant | BADHDUFLAG | Total packets | Discarded packets |
| A | 0 | 134 | 0 |
| B | 0 | 134 | 0 |
| C | 0 | 134 | 0 |
| D | 0 | 134 | 0 |
| Mode M9 | |||
|---|---|---|---|
| Quadrant | BADHDUFLAG | Total packets | Discarded packets |
| A | 0 | 9 | 0 |
| B | 0 | 9 | 0 |
| C | 0 | 9 | 0 |
| D | 0 | 9 | 0 |
| Mode M0 | |||
|---|---|---|---|
| Quadrant | BADHDUFLAG | Total packets | Discarded packets |
| A | 0 | 23672 | 1 |
| B | 0 | 20624 | 1 |
| C | 0 | 20902 | 6 |
| D | 0 | 45929 | 1 |
| Quadrant | Total seconds | Saturated seconds | Saturation percentage |
|---|---|---|---|
| A | 6709 | 401 | 5.977046% |
| B | 6710 | 580 | 8.643815% |
| C | 6709 | 487 | 7.258906% |
| D | 6709 | 4340 | 64.689223% |
Noise dominated data is calculated using 1-second bins in cleaned event files. If a bin has >2000 counts, and if more than 50% of those come from <1% of pixels, then it is considered to be noise-dominated and hence unusable.
| Quadrant | # 1 sec bins | Bins with >0 counts | Bins with >2000 counts | High rate bins dominated by noise | Noise dominated (total time) | Noise dominated (detector-on time) | Marked lightcurve |
|---|---|---|---|---|---|---|---|
| A | 7559 | 6710 | 294 | 294 | 3.89% | 4.38% | 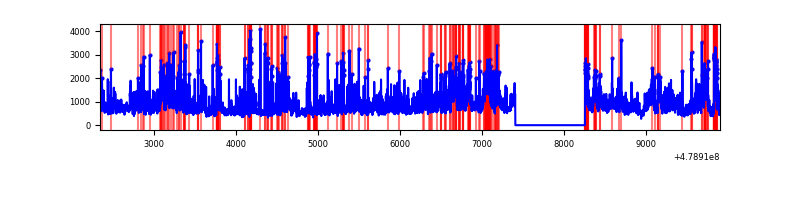 |
| B | 7560 | 6711 | 376 | 376 | 4.97% | 5.60% | 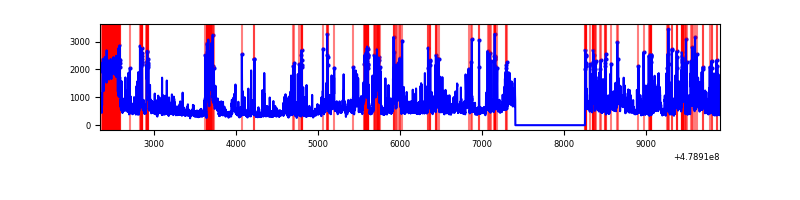 |
| C | 7559 | 6710 | 423 | 423 | 5.60% | 6.30% | 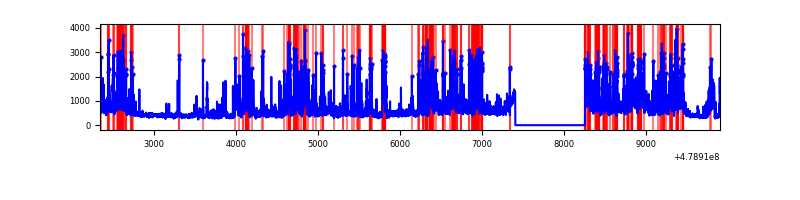 |
| D | 7559 | 6710 | 4312 | 4312 | 57.04% | 64.26% | 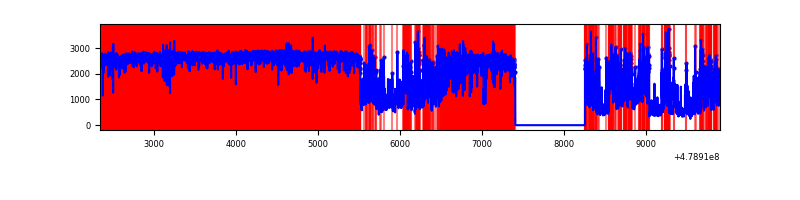 |
Top three noisy pixels from each quadrant. If the there are fewer than three noisy pixels in the level2.evt file, extra rows are filled as -1
| Pixel properties | Quadrant properties | ||||||
|---|---|---|---|---|---|---|---|
| Quadrant | DetID | PixID | Counts | Sigma | Mean | Median | Sigma |
| A | 12 | 3 | 1453242 | 8602.2 | 673 | 657 | 168.9 |
| A | 10 | 253 | 429804 | 2541.41 | 673 | 657 | 168.9 |
| A | 11 | 3 | 294381 | 1739.43 | 673 | 657 | 168.9 |
| B | 12 | 32 | 931034 | 6587.94 | 661 | 638 | 141.2 |
| B | 4 | 81 | 358236 | 2532.08 | 661 | 638 | 141.2 |
| B | 10 | 247 | 240261 | 1696.72 | 661 | 638 | 141.2 |
| C | 4 | 5 | 1068011 | 5820.52 | 657 | 651 | 183.4 |
| C | 13 | 3 | 601616 | 3277.18 | 657 | 651 | 183.4 |
| C | 12 | 249 | 210889 | 1146.47 | 657 | 651 | 183.4 |
| D | 15 | 93 | 9783259 | 84261.33 | 400 | 386 | 116.1 |
| D | 8 | 176 | 1605654 | 13826.41 | 400 | 386 | 116.1 |
| D | 9 | 1 | 135734 | 1165.77 | 400 | 386 | 116.1 |
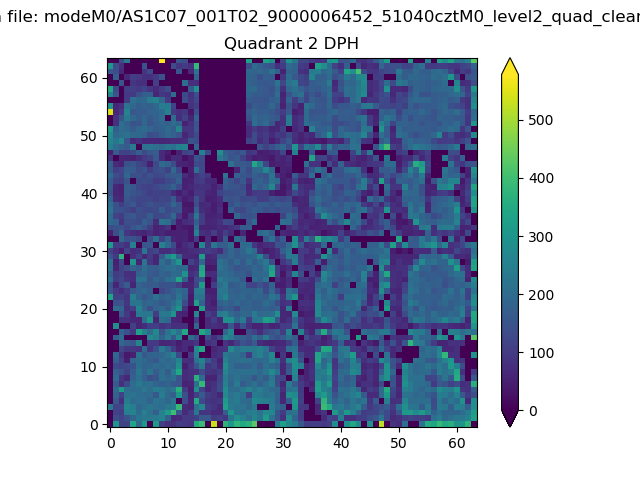
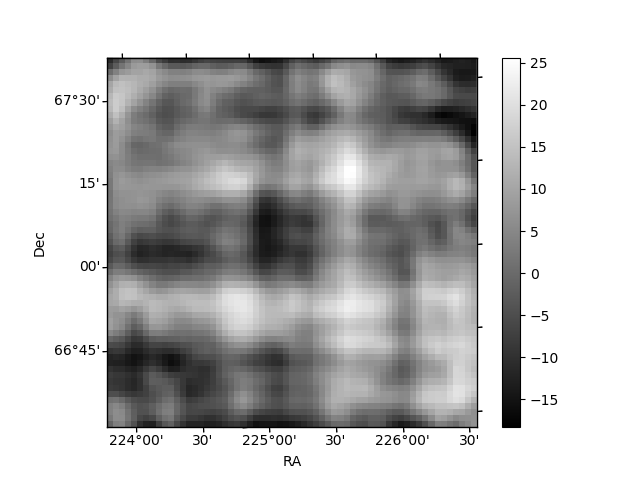
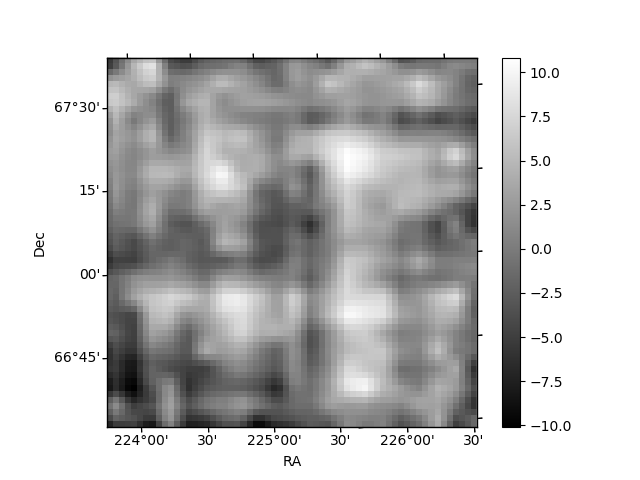
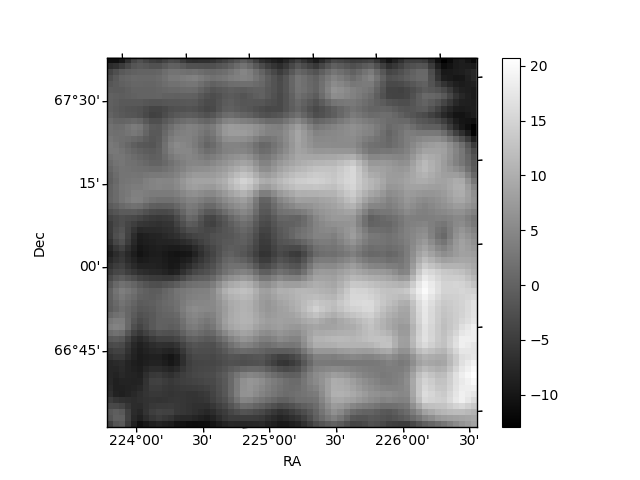
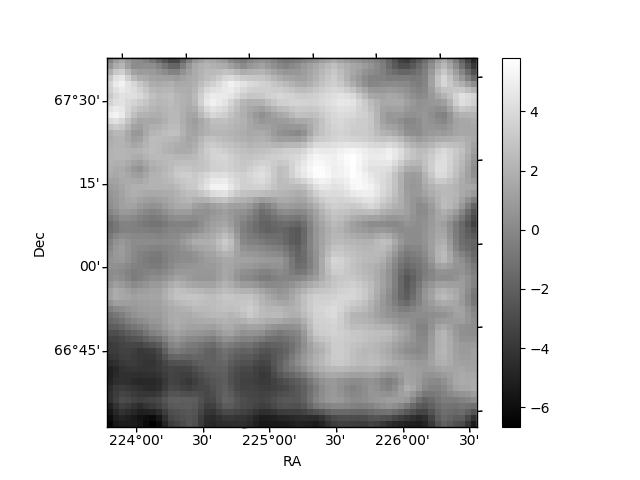
Histogram calculated using DETX and DETY for each event in the final _common_clean file
| Quadrant A | 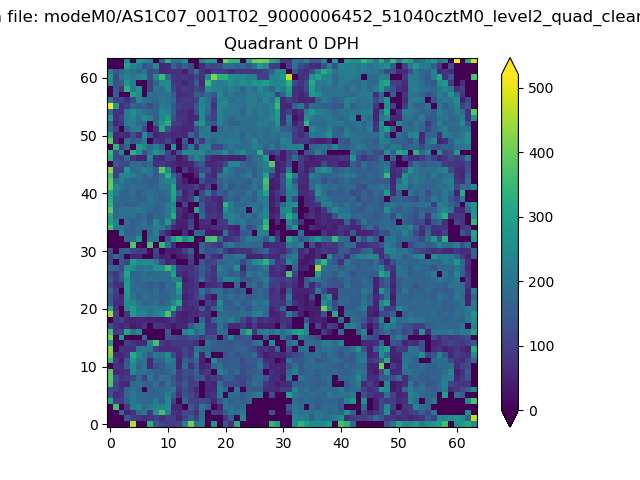 |
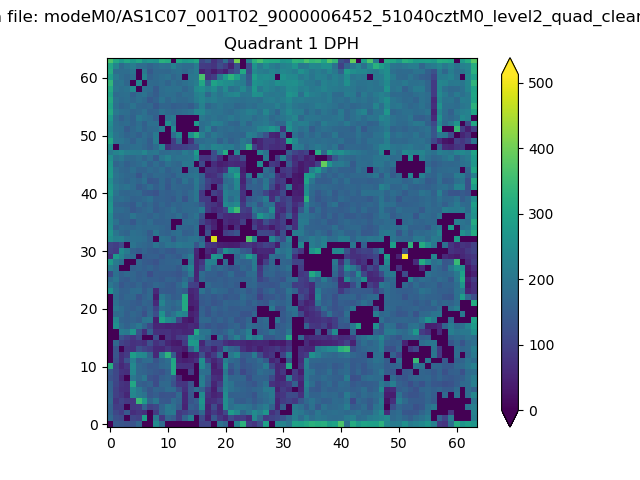 |
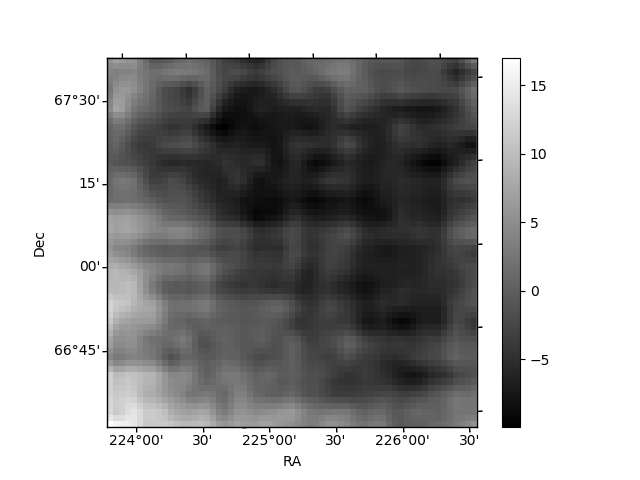
Quadrant B |
|---|---|---|---|
| Quadrant D | 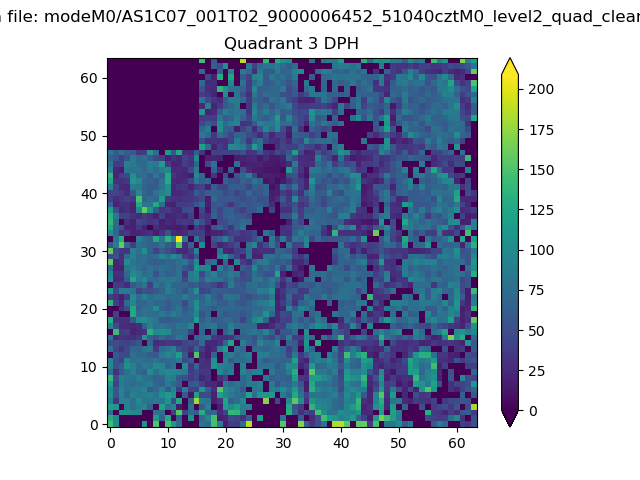 |
 |
Quadrant C |
| Plot type | Count rate plots | Images |
|---|---|---|
| Comparison with Poisson distribution Blue bars denote a histogram of data divided into 1 sec bins. Red curve is a Poisson curve with rate = median count rate of data. |
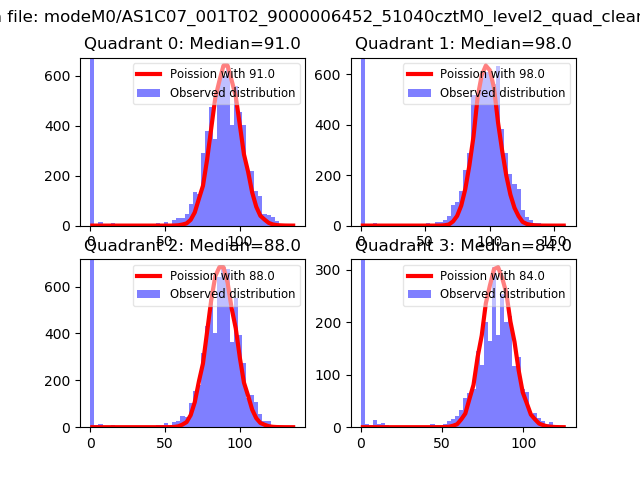 |
 |
| Quadrant-wise count rates Data is divided into 100 sec bins |
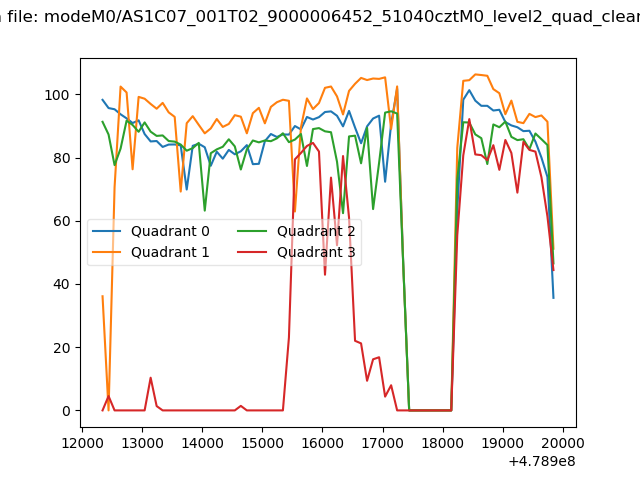 |
|
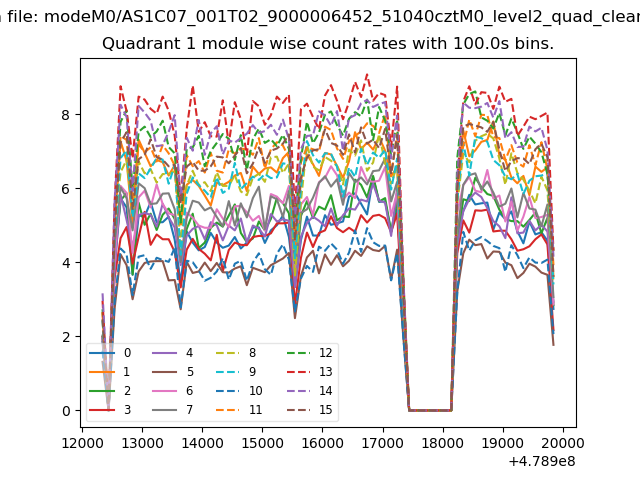
| Module-wise count rates for Quadrant A Data is divided into 100 sec bins |
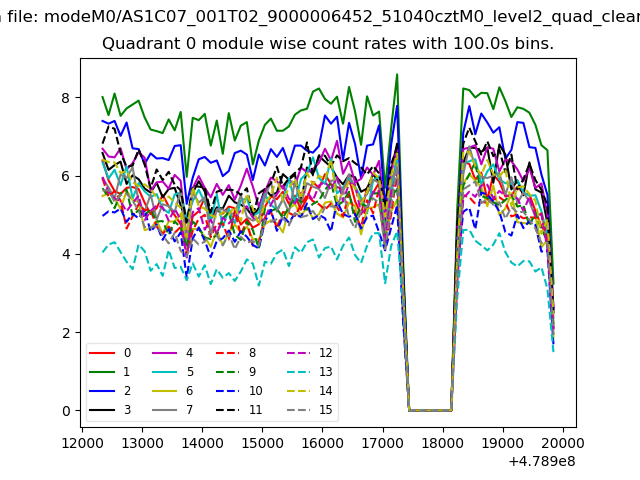 |
 |
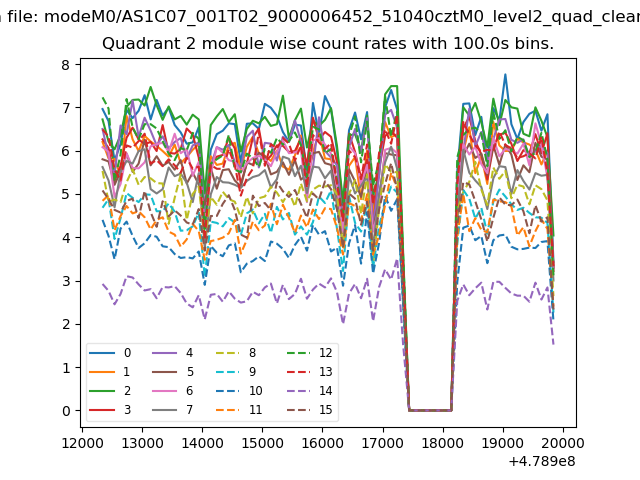
| Module-wise count rates for Quadrant B Data is divided into 100 sec bins |
 |
 |
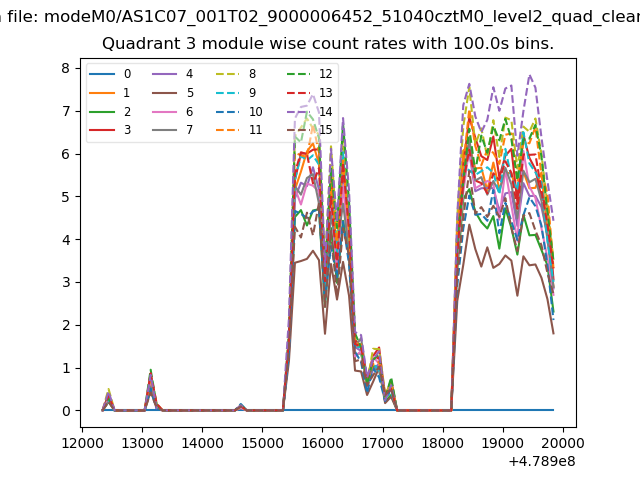
| Module-wise count rates for Quadrant C Data is divided into 100 sec bins |
 |
 |
| Module-wise count rates for Quadrant D Data is divided into 100 sec bins |
 |
 |
| Parameter | Plot |
|---|---|
| CZT HV Monitor | 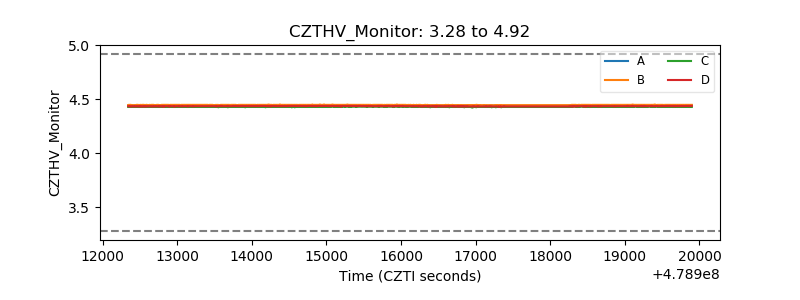 |
| D_VDD | 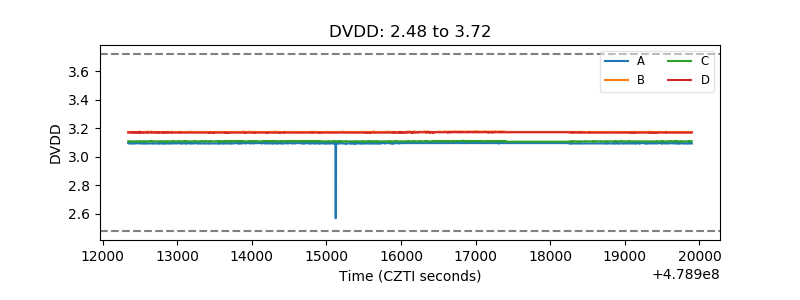 |
| Temperature 1 | 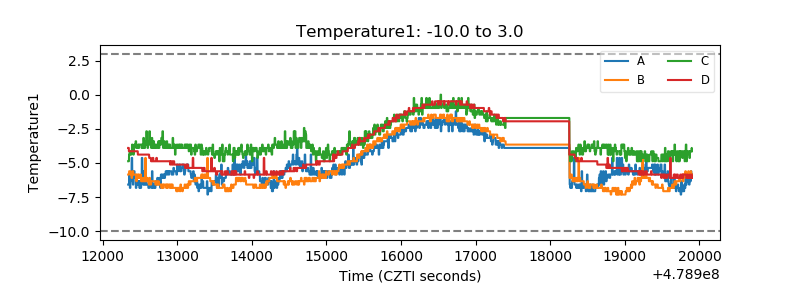 |
| Veto HV Monitor | 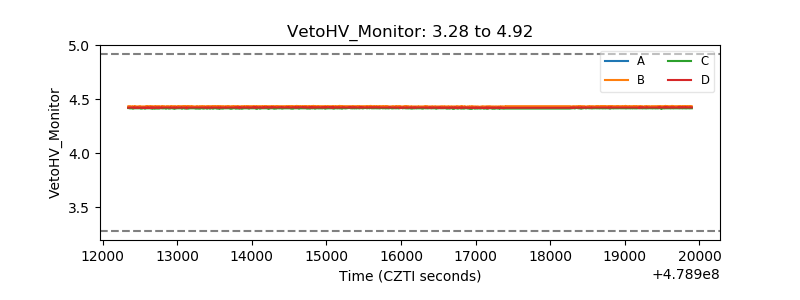 |
| Veto LLD | 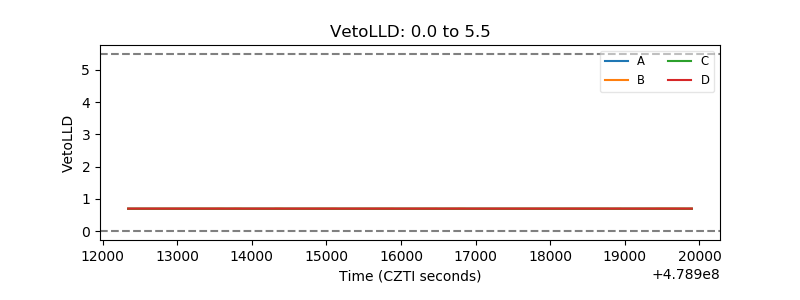 |
| Alpha Counter | 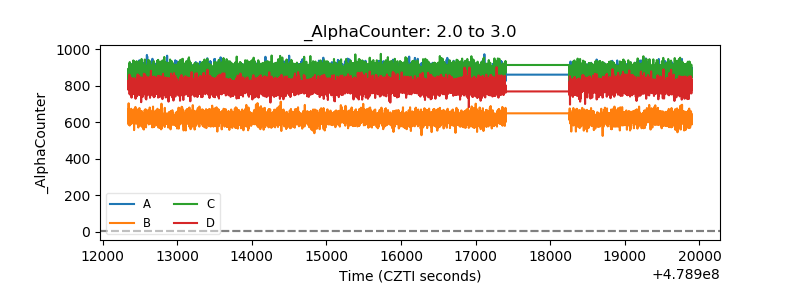 |
| _CPM_Rate | 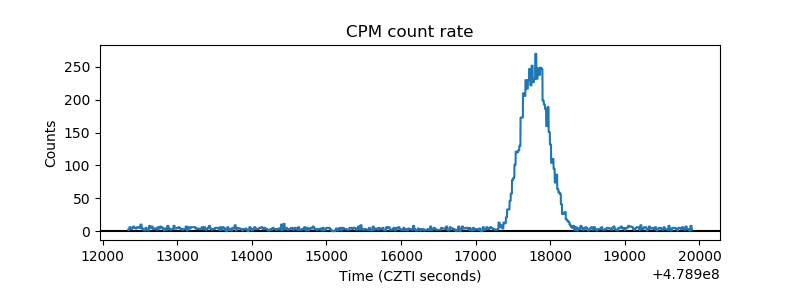 |
| CZT Counter | 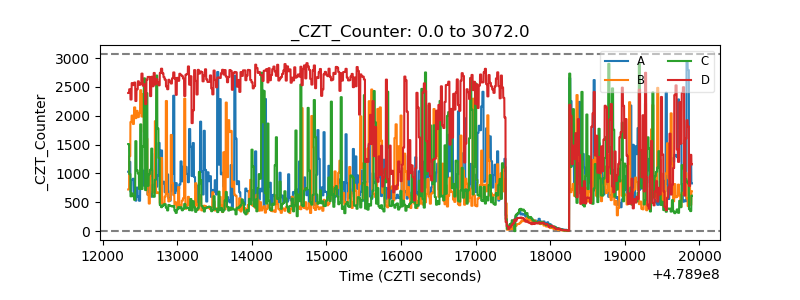 |
| +2.5 Volts monitor | 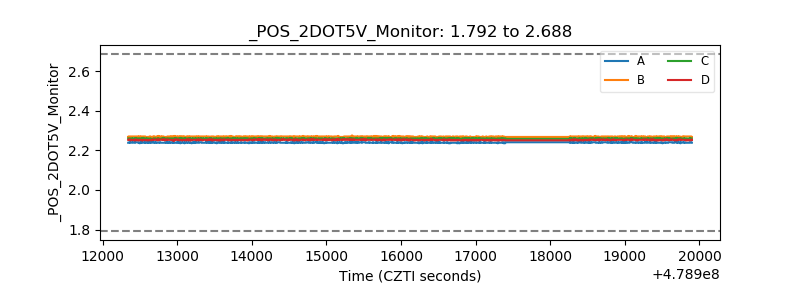 |
| +5 Volts monitor | 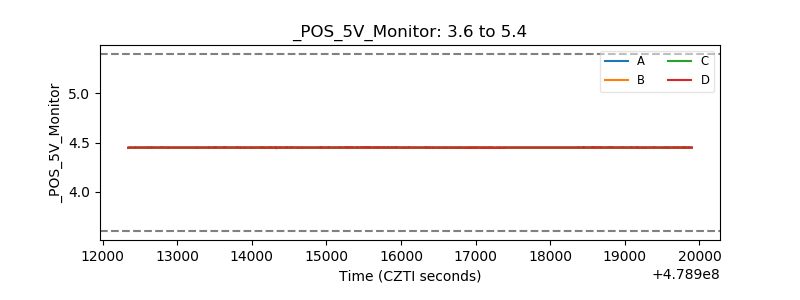 |
| _ROLL_ROT | 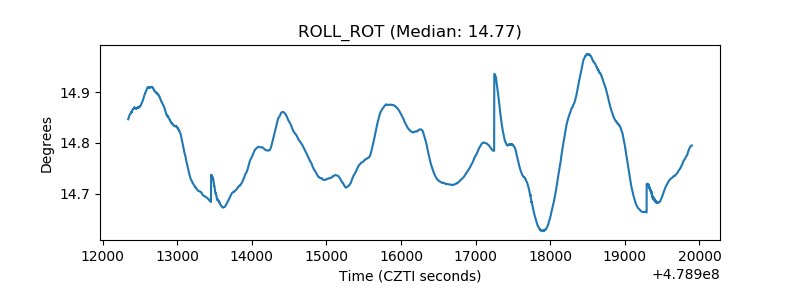 |
| _Roll_DEC | 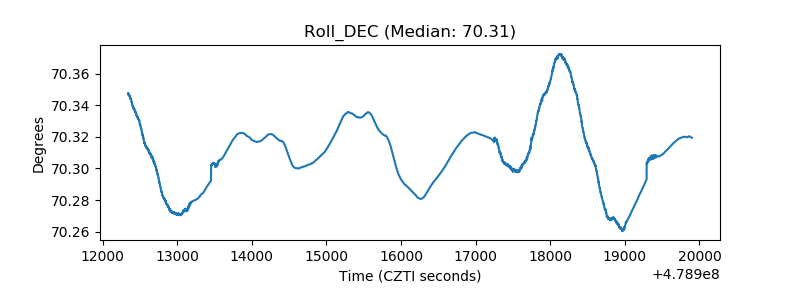 |
| _Roll_RA | 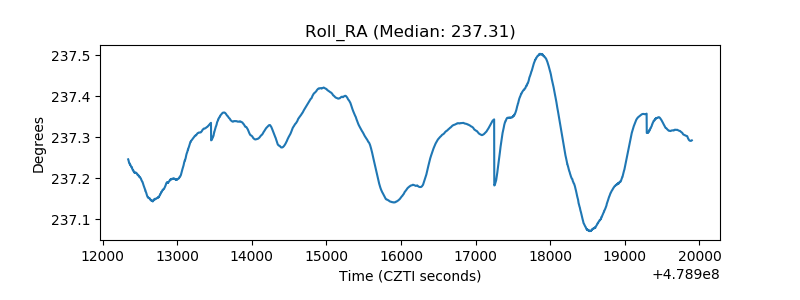 |
| Veto Counter | 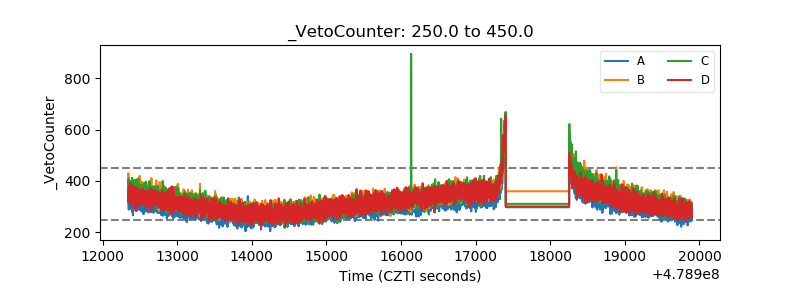 |