| Param | Original file | Final file |
|---|---|---|
| Filename | modeM0/AS1C07_001T02_9000006452_51042cztM0_level2.fits | modeM0/AS1C07_001T02_9000006452_51042cztM0_level2_quad_clean.evt |
| Size (bytes) | 726,468,480 | 86,040,000 |
| Size | 692.8 MB | 82.1 MB |
| Events in quadrant A | 7,451,337 | 545,769 |
| Events in quadrant B | 5,291,249 | 604,952 |
| Events in quadrant C | 6,259,397 | 536,026 |
| Events in quadrant D | 7,390,802 | 467,769 |
| Mode SS | |||
|---|---|---|---|
| Quadrant | BADHDUFLAG | Total packets | Discarded packets |
| A | 0 | 130 | 0 |
| B | 0 | 130 | 0 |
| C | 0 | 130 | 0 |
| D | 0 | 130 | 0 |
| Mode M9 | |||
|---|---|---|---|
| Quadrant | BADHDUFLAG | Total packets | Discarded packets |
| A | 0 | 10 | 0 |
| B | 0 | 10 | 0 |
| C | 0 | 10 | 0 |
| D | 0 | 10 | 0 |
| Mode M0 | |||
|---|---|---|---|
| Quadrant | BADHDUFLAG | Total packets | Discarded packets |
| A | 0 | 26692 | 1 |
| B | 0 | 20188 | 1 |
| C | 0 | 23185 | 1 |
| D | 0 | 26545 | 2 |
| Quadrant | Total seconds | Saturated seconds | Saturation percentage |
|---|---|---|---|
| A | 6462 | 724 | 11.203962% |
| B | 6462 | 534 | 8.263695% |
| C | 6463 | 623 | 9.639486% |
| D | 6462 | 1057 | 16.357165% |
Noise dominated data is calculated using 1-second bins in cleaned event files. If a bin has >2000 counts, and if more than 50% of those come from <1% of pixels, then it is considered to be noise-dominated and hence unusable.
| Quadrant | # 1 sec bins | Bins with >0 counts | Bins with >2000 counts | High rate bins dominated by noise | Noise dominated (total time) | Noise dominated (detector-on time) | Marked lightcurve |
|---|---|---|---|---|---|---|---|
| A | 7467 | 6462 | 608 | 608 | 8.14% | 9.41% | 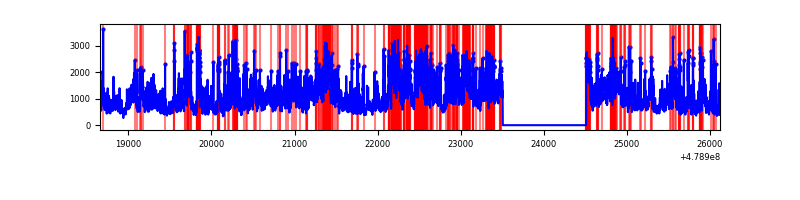 |
| B | 7466 | 6461 | 386 | 386 | 5.17% | 5.97% | 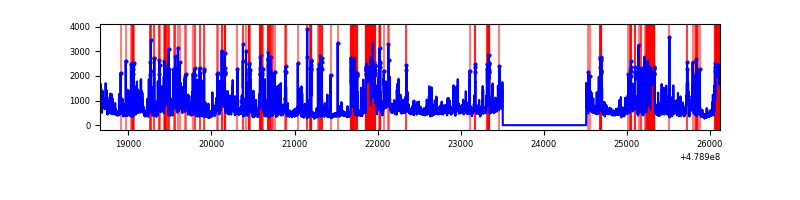 |
| C | 7468 | 6464 | 584 | 584 | 7.82% | 9.03% | 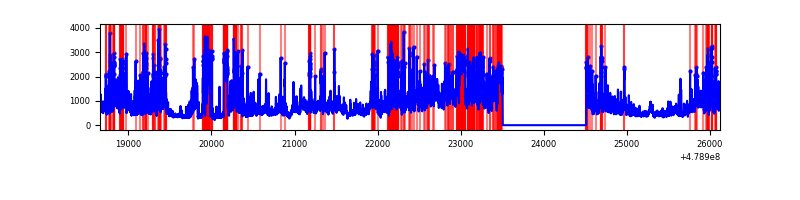 |
| D | 7467 | 6462 | 1074 | 1074 | 14.38% | 16.62% | 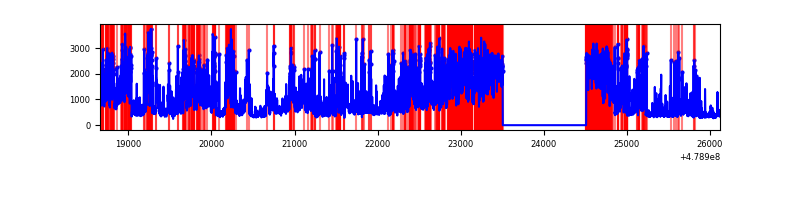 |
Top three noisy pixels from each quadrant. If the there are fewer than three noisy pixels in the level2.evt file, extra rows are filled as -1
| Pixel properties | Quadrant properties | ||||||
|---|---|---|---|---|---|---|---|
| Quadrant | DetID | PixID | Counts | Sigma | Mean | Median | Sigma |
| A | 12 | 3 | 1676338 | 10493.28 | 632 | 617 | 159.7 |
| A | 10 | 253 | 1334718 | 8354.07 | 632 | 617 | 159.7 |
| A | 2 | 143 | 363931 | 2275.05 | 632 | 617 | 159.7 |
| B | 12 | 32 | 1217782 | 9080.35 | 632 | 611 | 134.0 |
| B | 5 | 185 | 274862 | 2045.97 | 632 | 611 | 134.0 |
| B | 4 | 171 | 228816 | 1702.46 | 632 | 611 | 134.0 |
| C | 4 | 12 | 1262904 | 7340.93 | 616 | 609 | 172.0 |
| C | 13 | 3 | 553078 | 3212.91 | 616 | 609 | 172.0 |
| C | 4 | 5 | 474869 | 2758.08 | 616 | 609 | 172.0 |
| D | 8 | 176 | 2386817 | 14012.41 | 586 | 565 | 170.3 |
| D | 15 | 93 | 1561191 | 9164.21 | 586 | 565 | 170.3 |
| D | 3 | 12 | 214479 | 1256.13 | 586 | 565 | 170.3 |
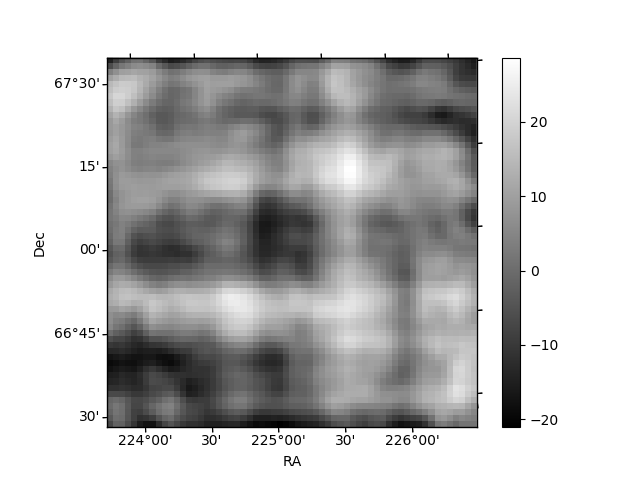
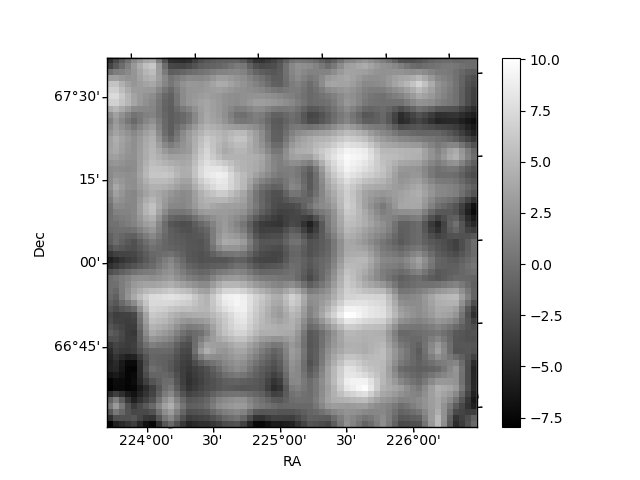
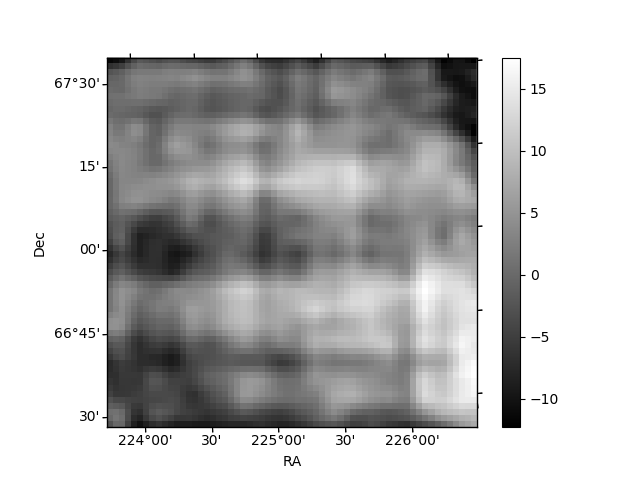
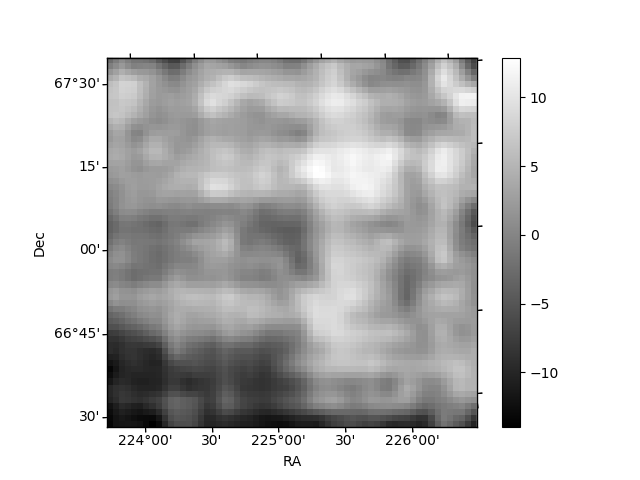
Histogram calculated using DETX and DETY for each event in the final _common_clean file
| Quadrant A | 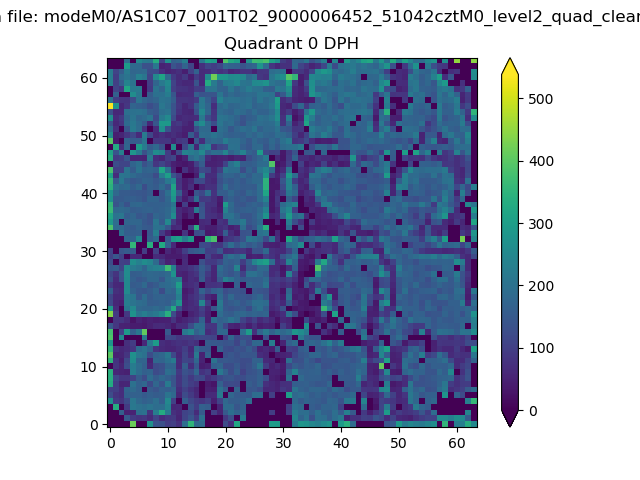 |
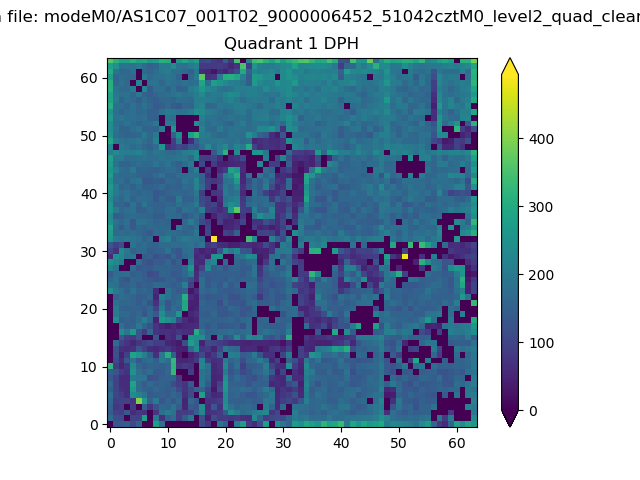 |
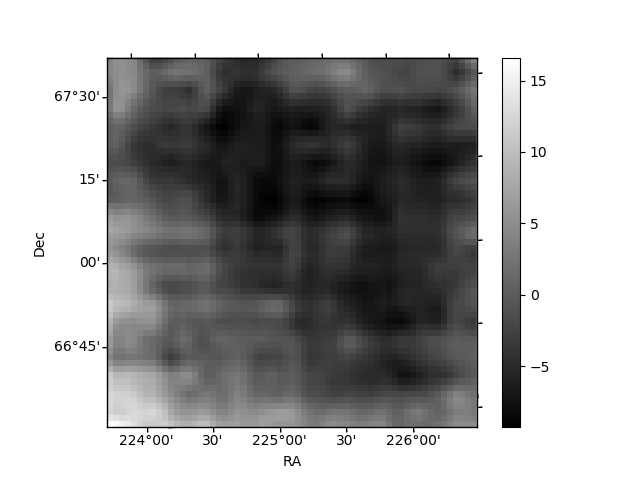
Quadrant B |
|---|---|---|---|
| Quadrant D | 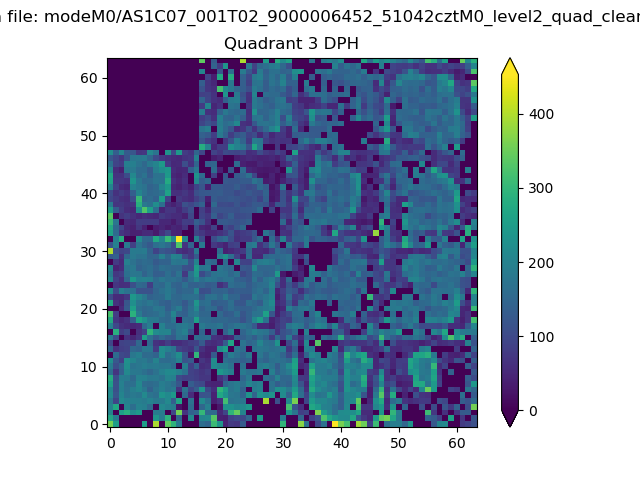 |
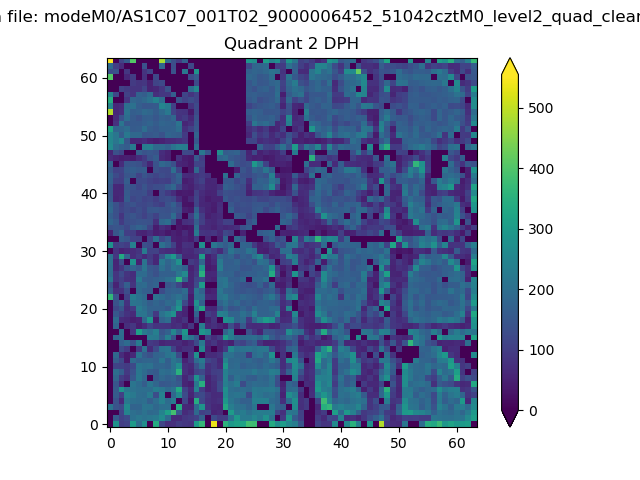 |
Quadrant C |
| Plot type | Count rate plots | Images |
|---|---|---|
| Comparison with Poisson distribution Blue bars denote a histogram of data divided into 1 sec bins. Red curve is a Poisson curve with rate = median count rate of data. |
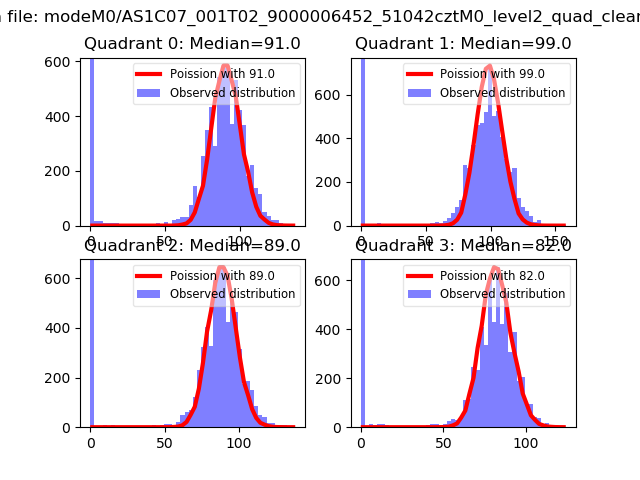 |
 |
| Quadrant-wise count rates Data is divided into 100 sec bins |
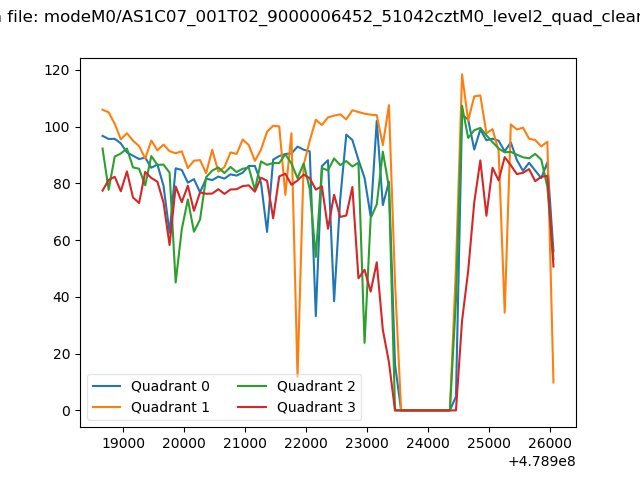 |
|
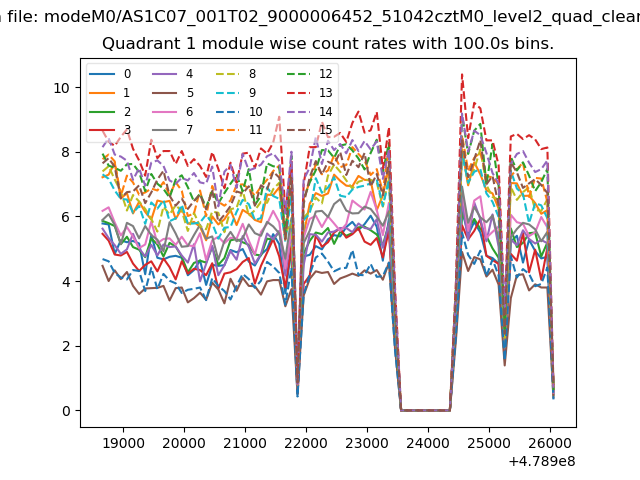
| Module-wise count rates for Quadrant A Data is divided into 100 sec bins |
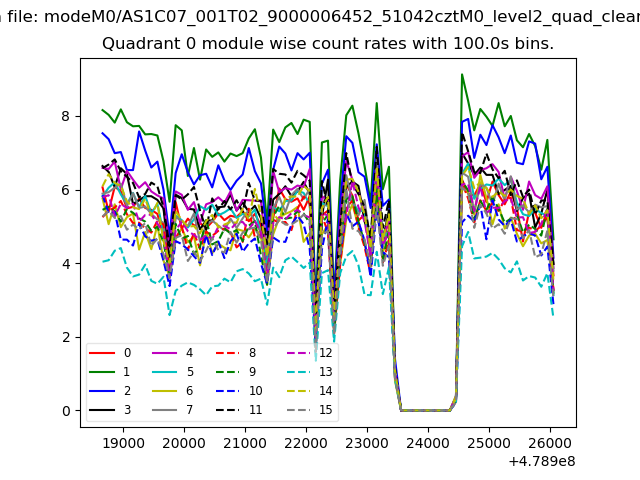 |
 |
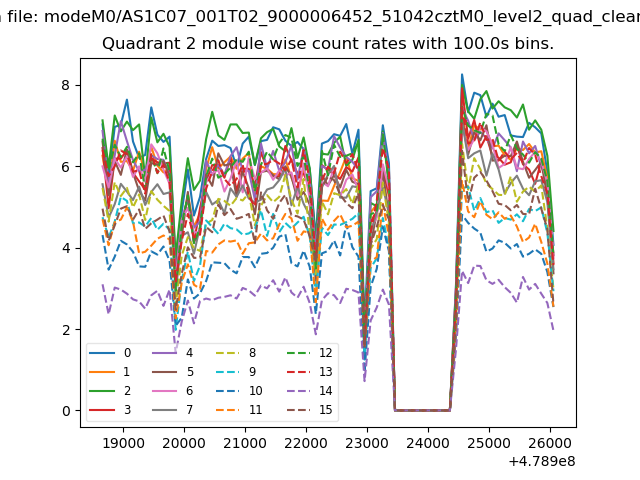
| Module-wise count rates for Quadrant B Data is divided into 100 sec bins |
 |
 |
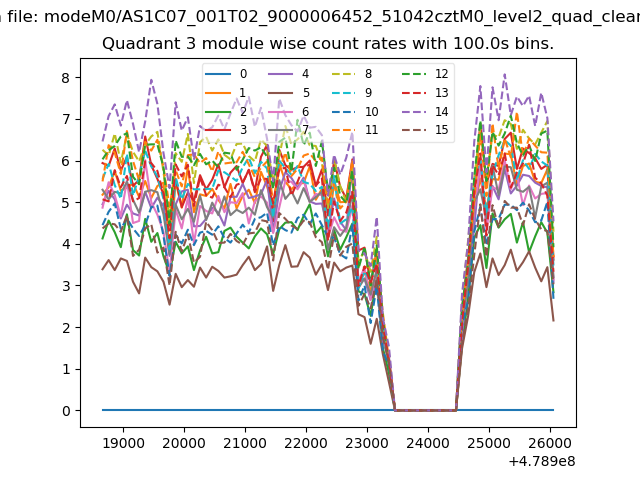
| Module-wise count rates for Quadrant C Data is divided into 100 sec bins |
 |
 |
| Module-wise count rates for Quadrant D Data is divided into 100 sec bins |
 |
 |
| Parameter | Plot |
|---|---|
| CZT HV Monitor | 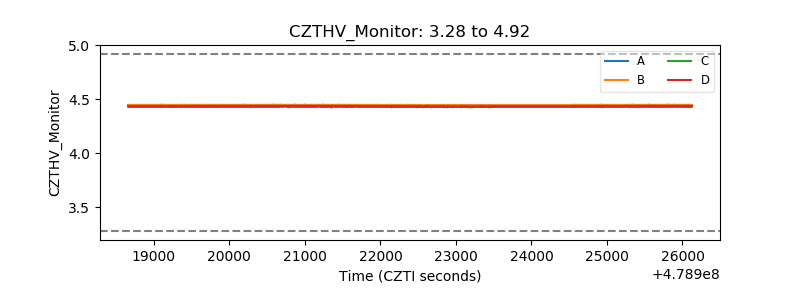 |
| D_VDD | 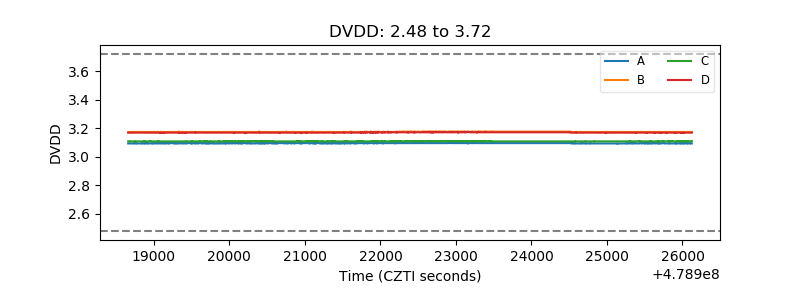 |
| Temperature 1 | 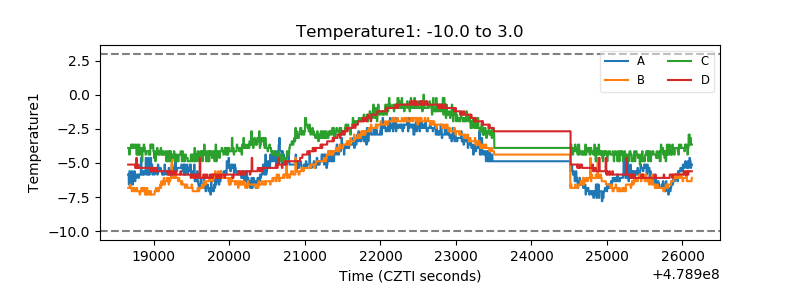 |
| Veto HV Monitor | 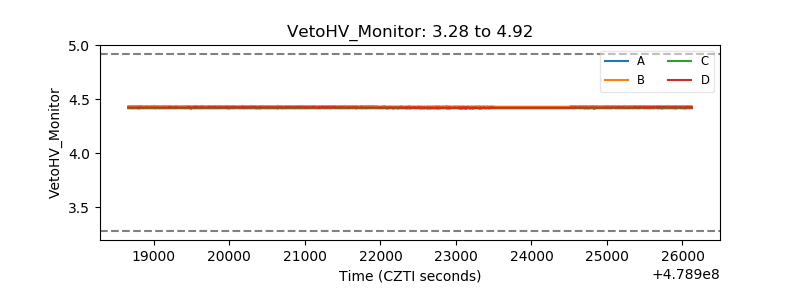 |
| Veto LLD | 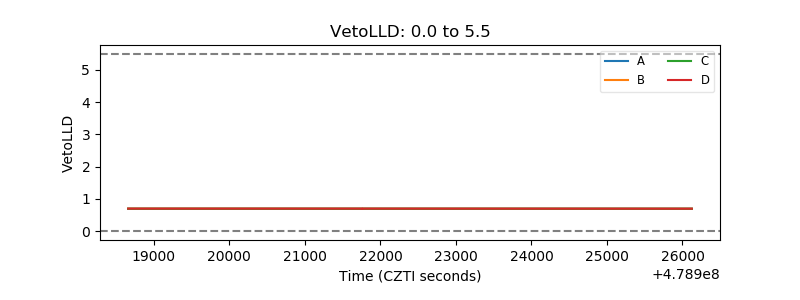 |
| Alpha Counter | 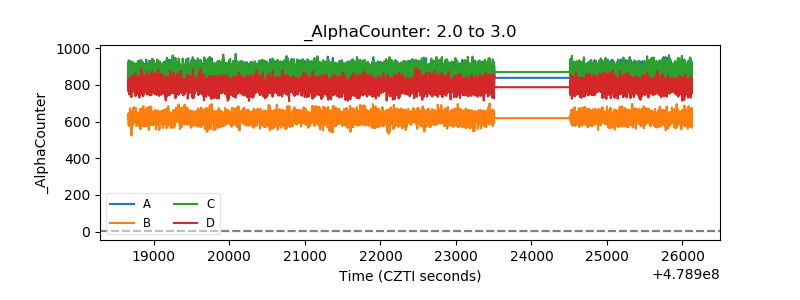 |
| _CPM_Rate | 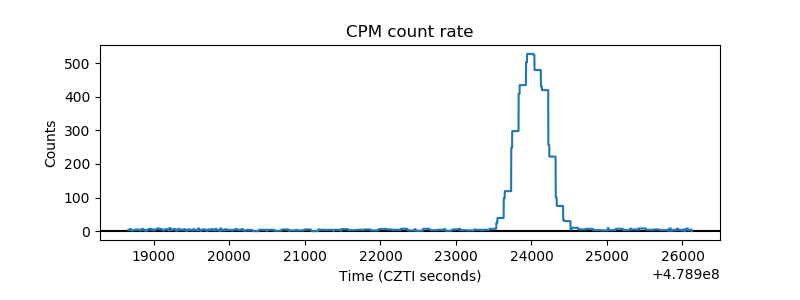 |
| CZT Counter | 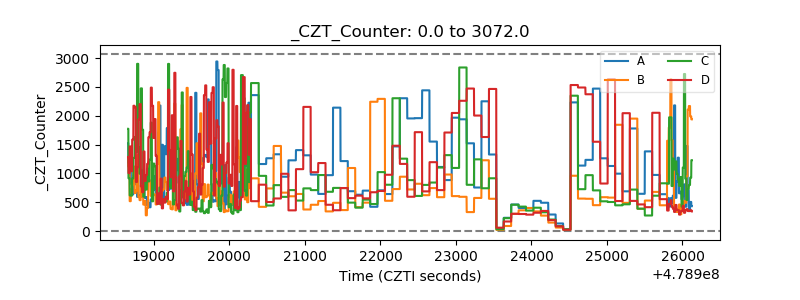 |
| +2.5 Volts monitor | 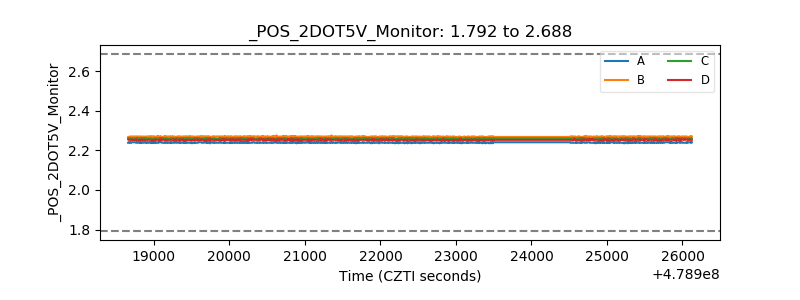 |
| +5 Volts monitor | 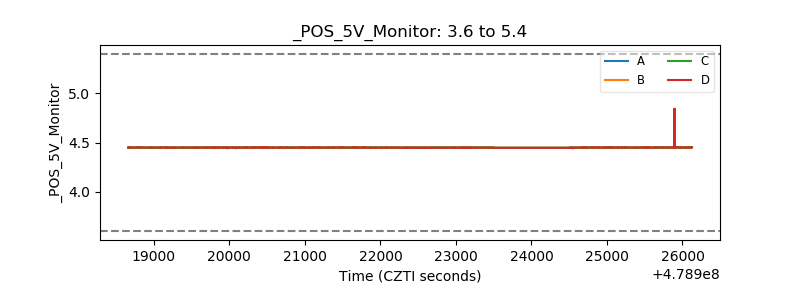 |
| _ROLL_ROT | 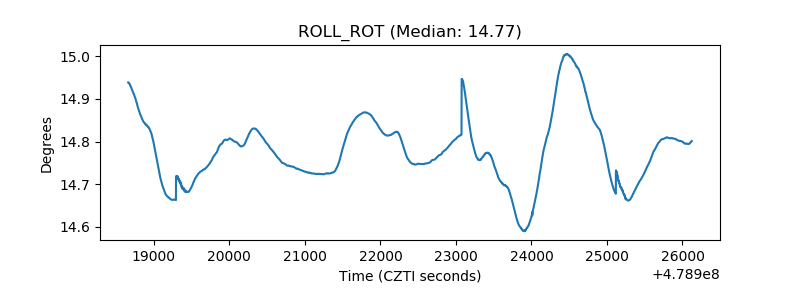 |
| _Roll_DEC | 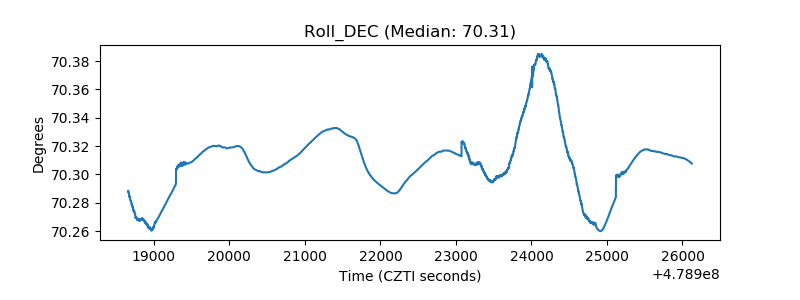 |
| _Roll_RA | 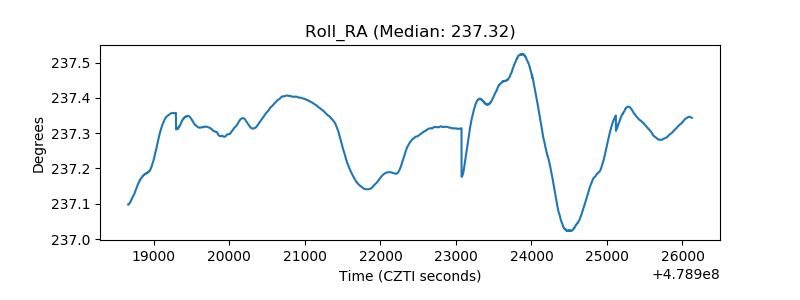 |
| Veto Counter | 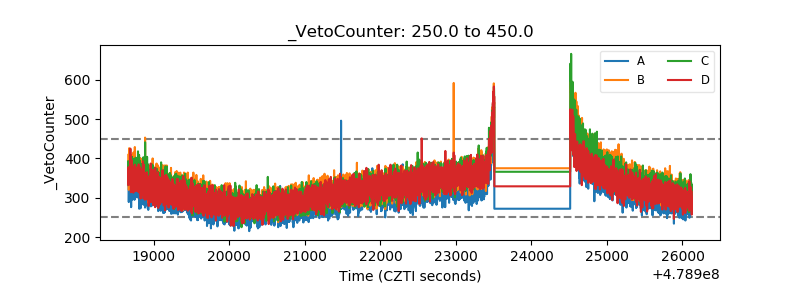 |