| Param | Original file | Final file |
|---|---|---|
| Filename | modeM0/AS1C07_001T02_9000006452_51043cztM0_level2.fits | modeM0/AS1C07_001T02_9000006452_51043cztM0_level2_quad_clean.evt |
| Size (bytes) | 568,690,560 | 80,498,880 |
| Size | 542.3 MB | 76.8 MB |
| Events in quadrant A | 5,118,336 | 535,739 |
| Events in quadrant B | 5,384,374 | 516,928 |
| Events in quadrant C | 5,706,965 | 502,430 |
| Events in quadrant D | 4,393,370 | 477,440 |
| Mode SS | |||
|---|---|---|---|
| Quadrant | BADHDUFLAG | Total packets | Discarded packets |
| A | 0 | 118 | 0 |
| B | 0 | 118 | 0 |
| C | 0 | 118 | 0 |
| D | 0 | 118 | 0 |
| Mode M9 | |||
|---|---|---|---|
| Quadrant | BADHDUFLAG | Total packets | Discarded packets |
| A | 0 | 11 | 0 |
| B | 0 | 11 | 0 |
| C | 0 | 11 | 0 |
| D | 0 | 11 | 0 |
| Mode M0 | |||
|---|---|---|---|
| Quadrant | BADHDUFLAG | Total packets | Discarded packets |
| A | 0 | 19330 | 1 |
| B | 0 | 19972 | 1 |
| C | 0 | 21029 | 1 |
| D | 0 | 17244 | 1 |
| Quadrant | Total seconds | Saturated seconds | Saturation percentage |
|---|---|---|---|
| A | 5789 | 198 | 3.420280% |
| B | 5789 | 930 | 16.064951% |
| C | 5789 | 456 | 7.877008% |
| D | 5790 | 284 | 4.905009% |
Noise dominated data is calculated using 1-second bins in cleaned event files. If a bin has >2000 counts, and if more than 50% of those come from <1% of pixels, then it is considered to be noise-dominated and hence unusable.
| Quadrant | # 1 sec bins | Bins with >0 counts | Bins with >2000 counts | High rate bins dominated by noise | Noise dominated (total time) | Noise dominated (detector-on time) | Marked lightcurve |
|---|---|---|---|---|---|---|---|
| A | 6889 | 5790 | 163 | 163 | 2.37% | 2.82% | 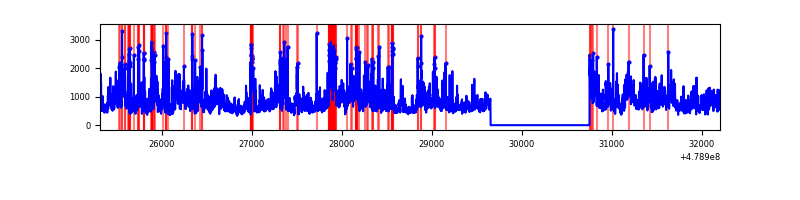 |
| B | 6889 | 5789 | 674 | 674 | 9.78% | 11.64% | 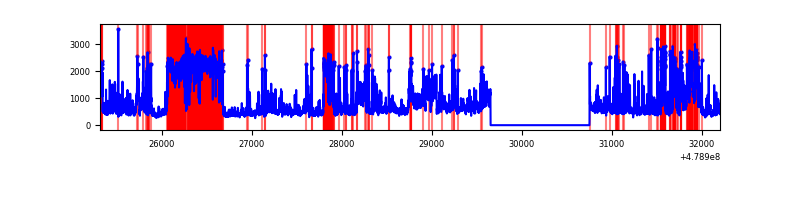 |
| C | 6889 | 5790 | 457 | 457 | 6.63% | 7.89% | 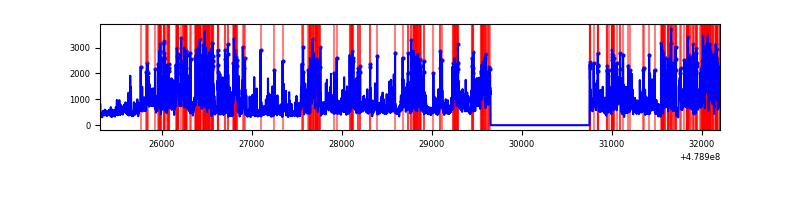 |
| D | 6890 | 5791 | 268 | 268 | 3.89% | 4.63% | 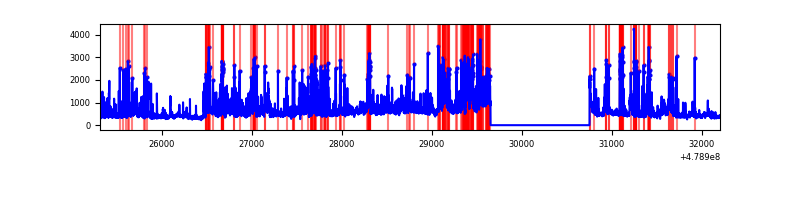 |
Top three noisy pixels from each quadrant. If the there are fewer than three noisy pixels in the level2.evt file, extra rows are filled as -1
| Pixel properties | Quadrant properties | ||||||
|---|---|---|---|---|---|---|---|
| Quadrant | DetID | PixID | Counts | Sigma | Mean | Median | Sigma |
| A | 12 | 3 | 1504881 | 10269.59 | 587 | 573 | 146.5 |
| A | 5 | 243 | 221424 | 1507.7 | 587 | 573 | 146.5 |
| A | 3 | 62 | 215427 | 1466.76 | 587 | 573 | 146.5 |
| B | 12 | 32 | 1755527 | 15135.96 | 549 | 531 | 115.9 |
| B | 10 | 14 | 350041 | 3014.35 | 549 | 531 | 115.9 |
| B | 4 | 206 | 269981 | 2323.87 | 549 | 531 | 115.9 |
| C | 12 | 249 | 2323525 | 14897.9 | 562 | 557 | 155.9 |
| C | 13 | 3 | 316839 | 2028.41 | 562 | 557 | 155.9 |
| C | 12 | 247 | 213511 | 1365.74 | 562 | 557 | 155.9 |
| D | 8 | 176 | 721989 | 4525.52 | 559 | 541 | 159.4 |
| D | 2 | 216 | 457061 | 2863.67 | 559 | 541 | 159.4 |
| D | 9 | 1 | 271306 | 1698.46 | 559 | 541 | 159.4 |
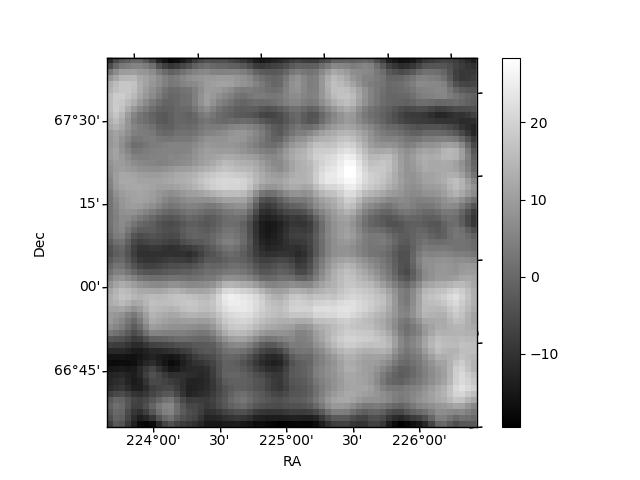
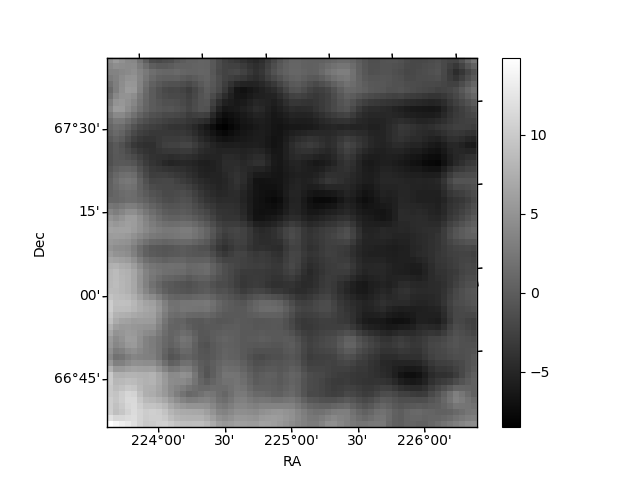
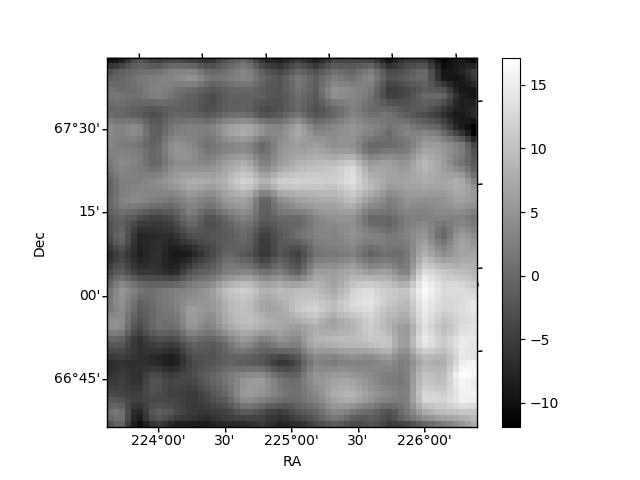
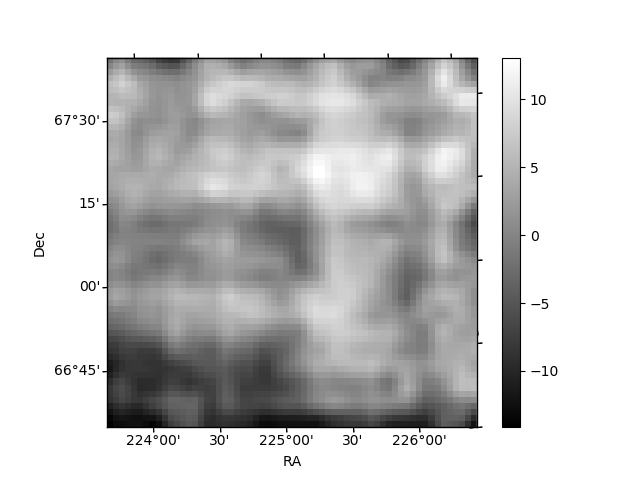
Histogram calculated using DETX and DETY for each event in the final _common_clean file
| Quadrant A | 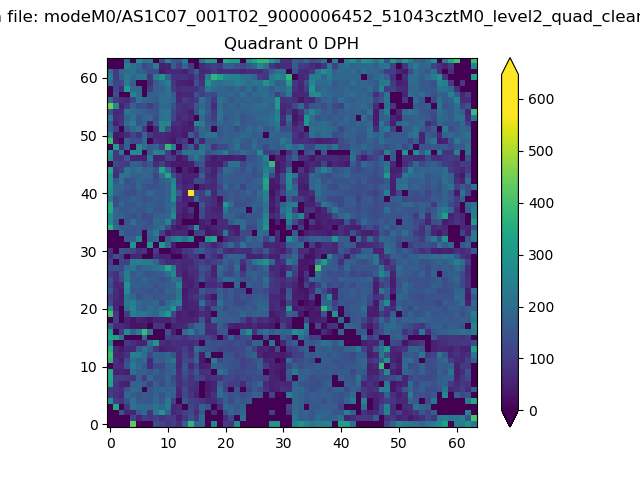 |
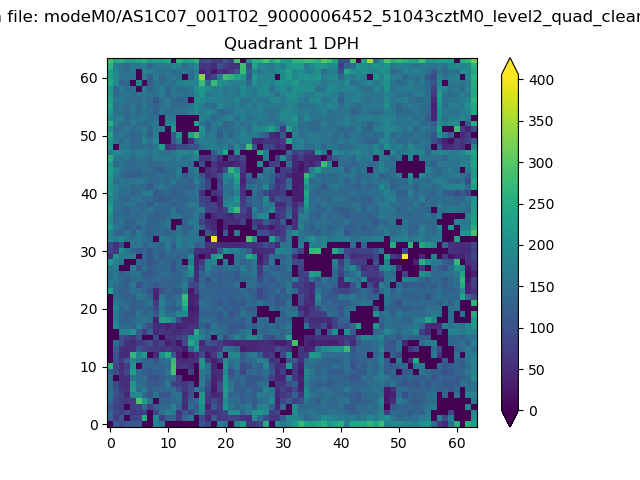 |
Quadrant B |
|---|---|---|---|
| Quadrant D | 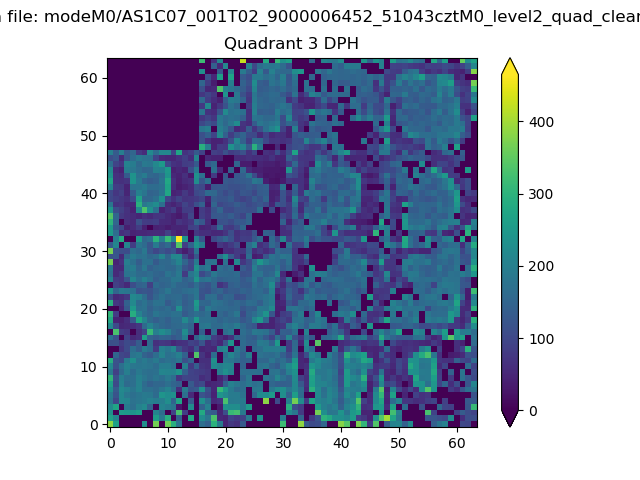 |
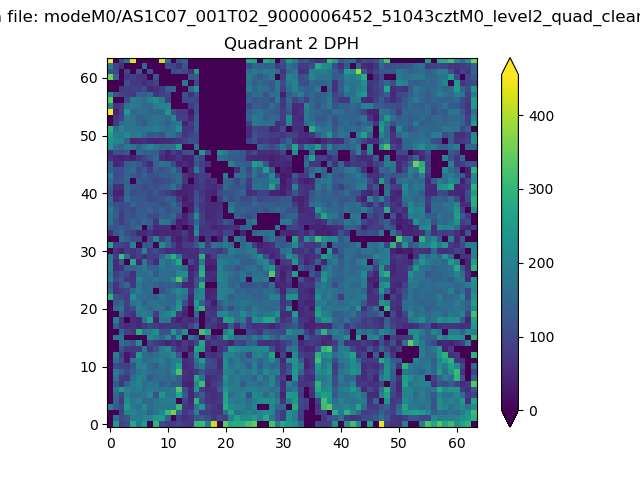 |
Quadrant C |
| Plot type | Count rate plots | Images |
|---|---|---|
| Comparison with Poisson distribution Blue bars denote a histogram of data divided into 1 sec bins. Red curve is a Poisson curve with rate = median count rate of data. |
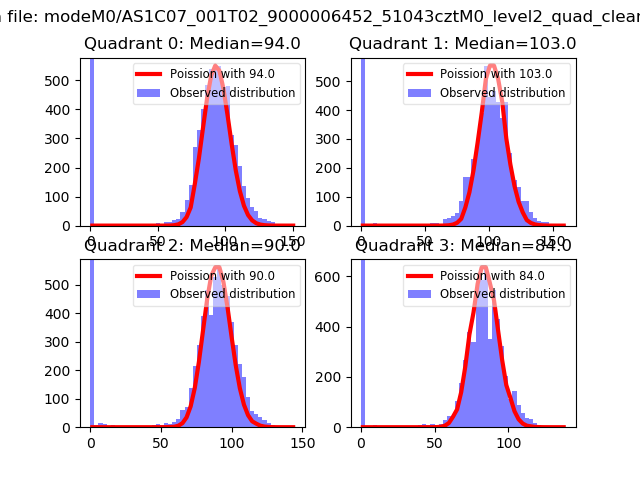 |
 |
| Quadrant-wise count rates Data is divided into 100 sec bins |
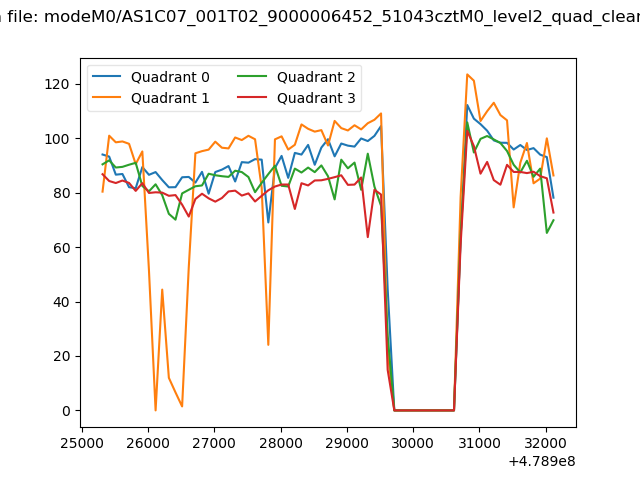 |
|
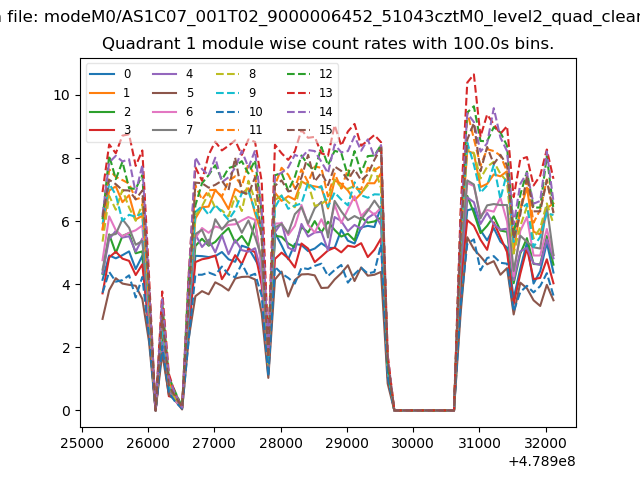
| Module-wise count rates for Quadrant A Data is divided into 100 sec bins |
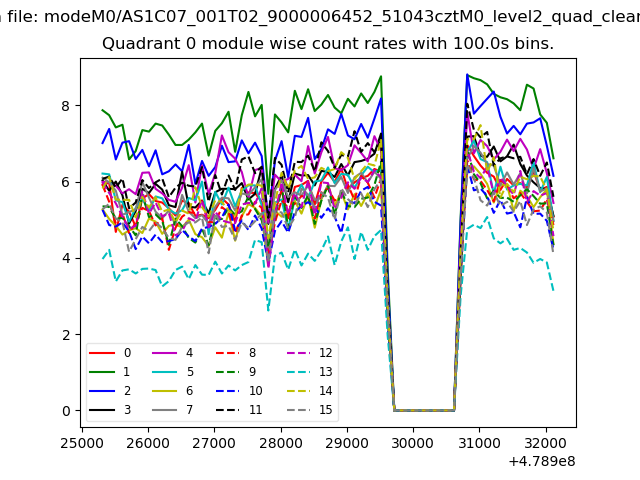 |
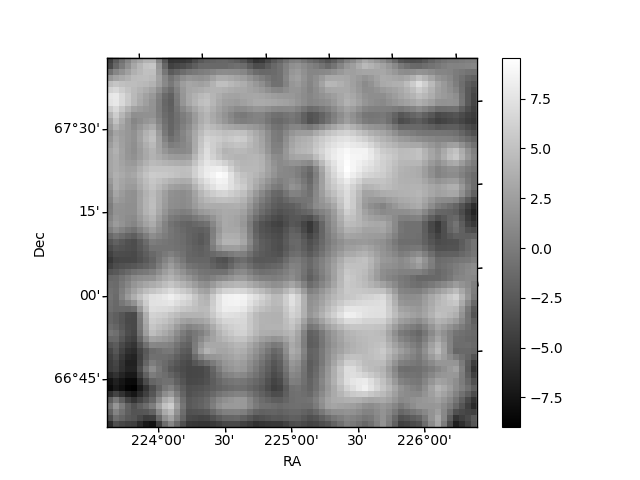 |
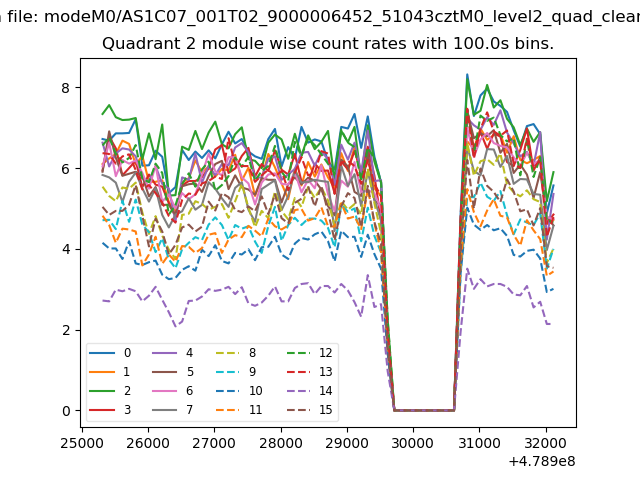
| Module-wise count rates for Quadrant B Data is divided into 100 sec bins |
 |
 |
| Module-wise count rates for Quadrant C Data is divided into 100 sec bins |
 |
 |
| Module-wise count rates for Quadrant D Data is divided into 100 sec bins |
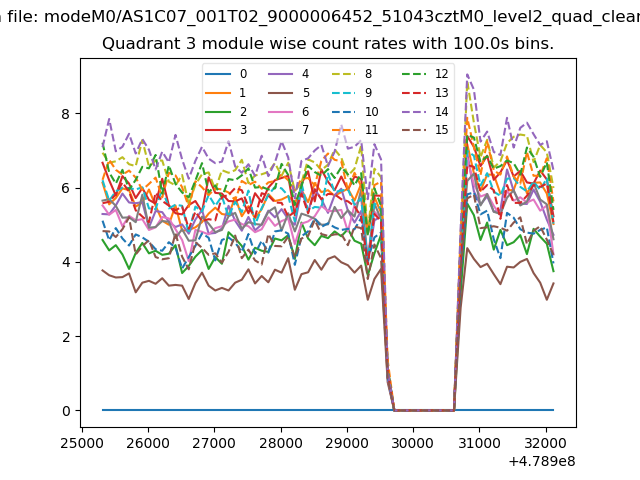 |
 |
| Parameter | Plot |
|---|---|
| CZT HV Monitor | 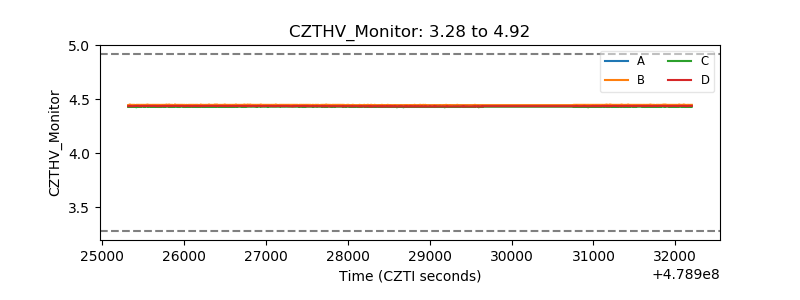 |
| D_VDD | 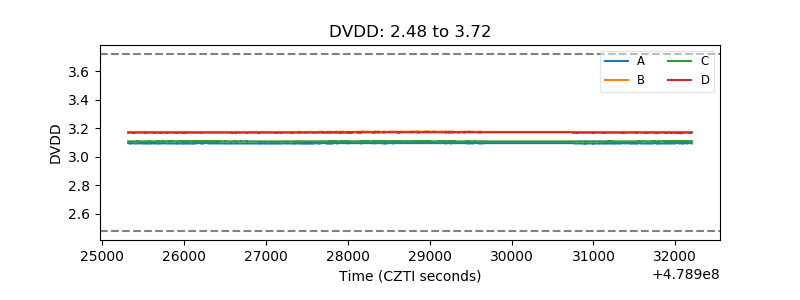 |
| Temperature 1 | 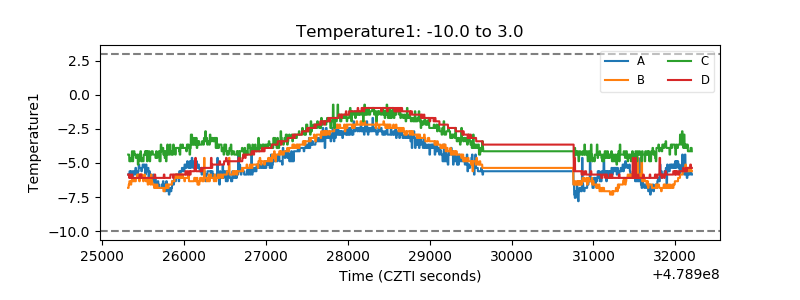 |
| Veto HV Monitor | 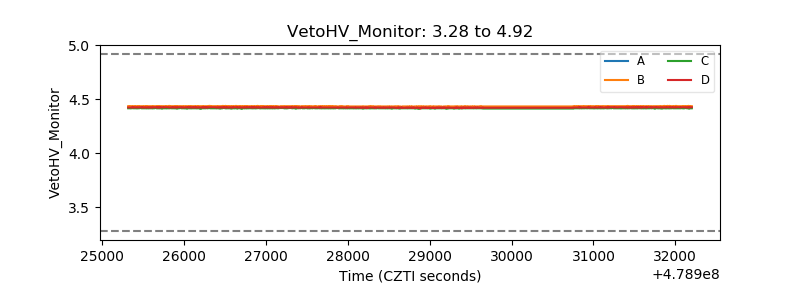 |
| Veto LLD | 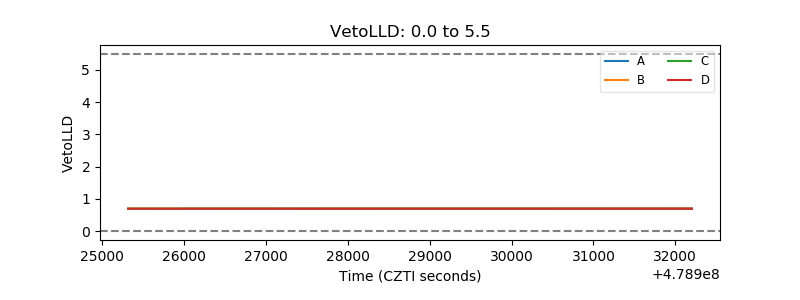 |
| Alpha Counter | 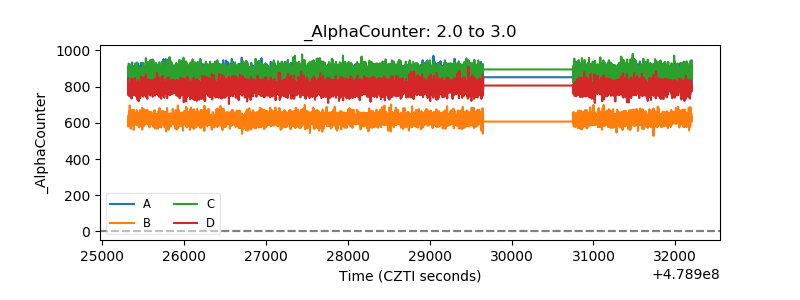 |
| _CPM_Rate | 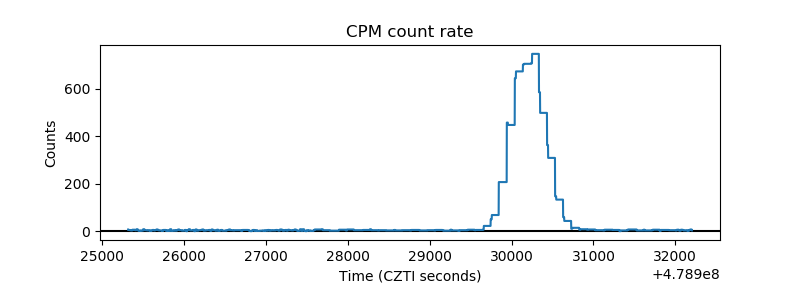 |
| CZT Counter | 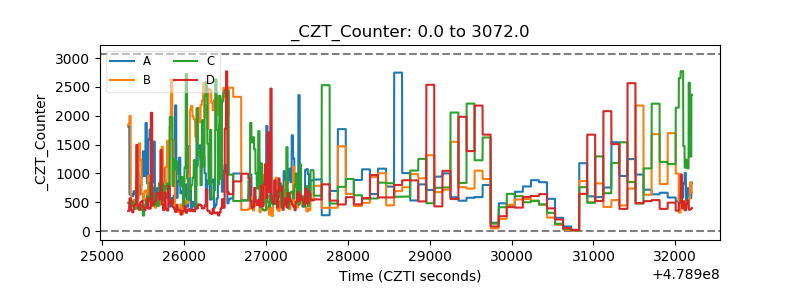 |
| +2.5 Volts monitor | 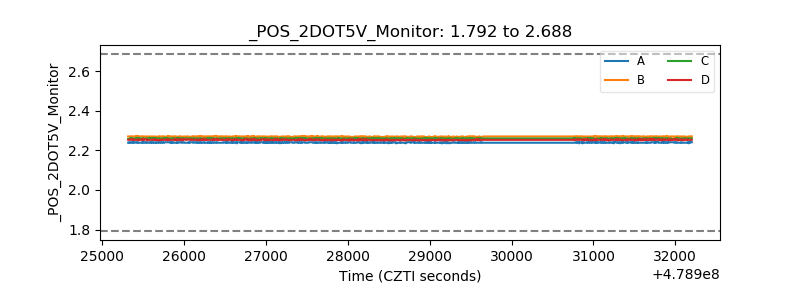 |
| +5 Volts monitor | 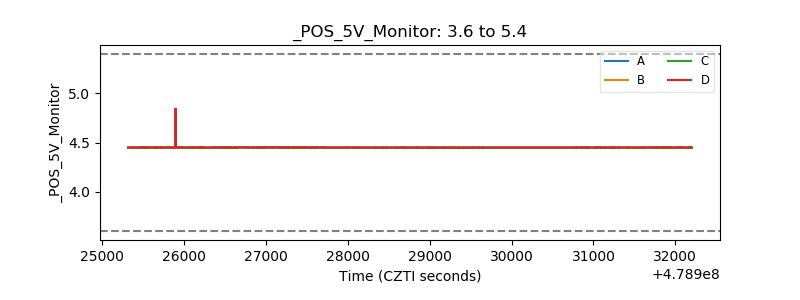 |
| _ROLL_ROT | 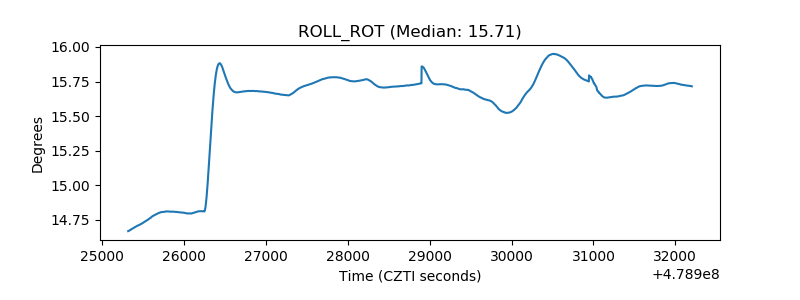 |
| _Roll_DEC | 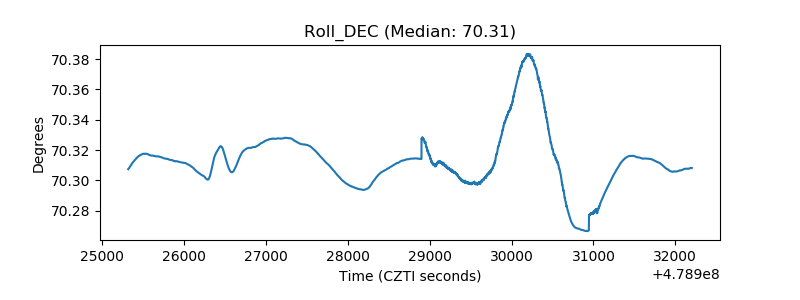 |
| _Roll_RA | 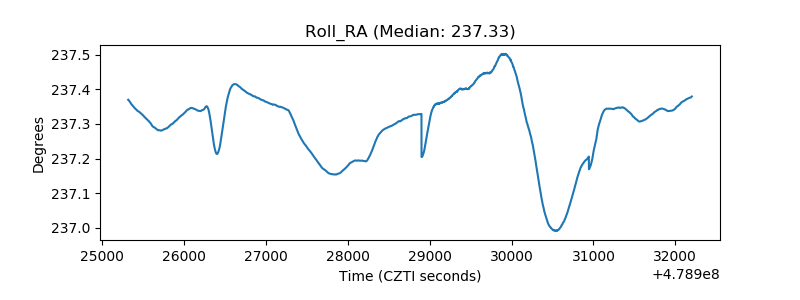 |
| Veto Counter | 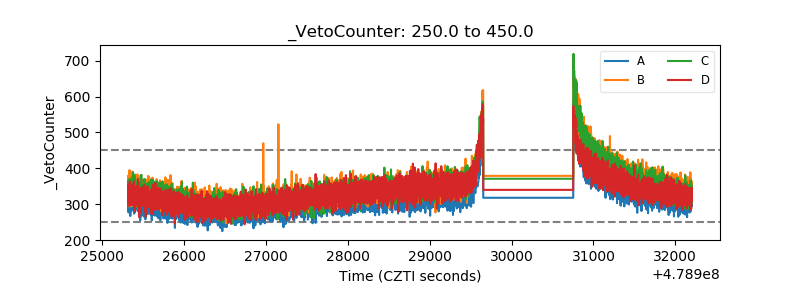 |