| Param | Original file | Final file |
|---|---|---|
| Filename | modeM0/AS1C07_001T02_9000006452_51045cztM0_level2.fits | modeM0/AS1C07_001T02_9000006452_51045cztM0_level2_quad_clean.evt |
| Size (bytes) | 614,496,960 | 84,072,960 |
| Size | 586.0 MB | 80.2 MB |
| Events in quadrant A | 6,414,189 | 548,093 |
| Events in quadrant B | 3,678,703 | 621,024 |
| Events in quadrant C | 5,905,520 | 496,540 |
| Events in quadrant D | 6,288,964 | 465,295 |
| Mode SS | |||
|---|---|---|---|
| Quadrant | BADHDUFLAG | Total packets | Discarded packets |
| A | 0 | 120 | 0 |
| B | 0 | 120 | 0 |
| C | 0 | 120 | 0 |
| D | 0 | 120 | 0 |
| Mode M9 | |||
|---|---|---|---|
| Quadrant | BADHDUFLAG | Total packets | Discarded packets |
| A | 0 | 12 | 0 |
| B | 0 | 12 | 0 |
| C | 0 | 12 | 0 |
| D | 0 | 12 | 0 |
| Mode M0 | |||
|---|---|---|---|
| Quadrant | BADHDUFLAG | Total packets | Discarded packets |
| A | 0 | 23318 | 1 |
| B | 0 | 15180 | 1 |
| C | 0 | 21703 | 1 |
| D | 0 | 22919 | 1 |
| Quadrant | Total seconds | Saturated seconds | Saturation percentage |
|---|---|---|---|
| A | 5937 | 460 | 7.748021% |
| B | 5937 | 206 | 3.469766% |
| C | 5937 | 750 | 12.632643% |
| D | 5937 | 861 | 14.502274% |
Noise dominated data is calculated using 1-second bins in cleaned event files. If a bin has >2000 counts, and if more than 50% of those come from <1% of pixels, then it is considered to be noise-dominated and hence unusable.
| Quadrant | # 1 sec bins | Bins with >0 counts | Bins with >2000 counts | High rate bins dominated by noise | Noise dominated (total time) | Noise dominated (detector-on time) | Marked lightcurve |
|---|---|---|---|---|---|---|---|
| A | 7107 | 5937 | 314 | 314 | 4.42% | 5.29% | 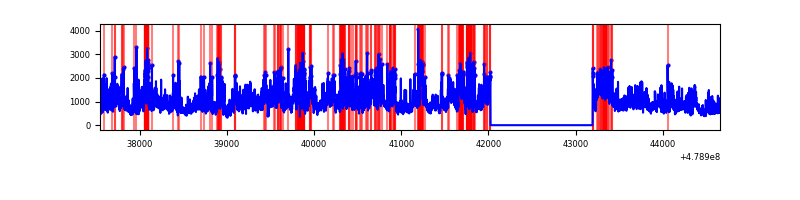 |
| B | 7107 | 5938 | 114 | 114 | 1.60% | 1.92% | 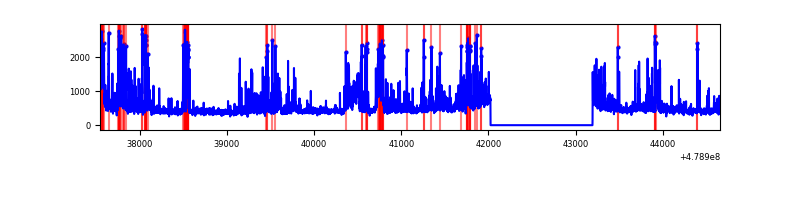 |
| C | 7107 | 5937 | 698 | 698 | 9.82% | 11.76% | 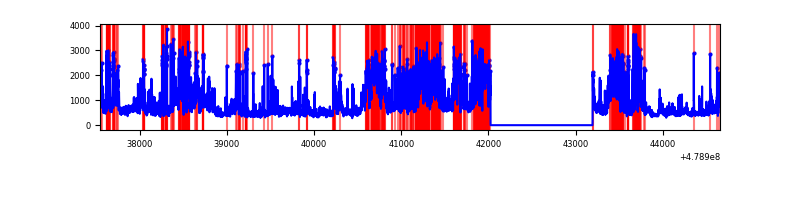 |
| D | 7107 | 5938 | 834 | 834 | 11.73% | 14.05% | 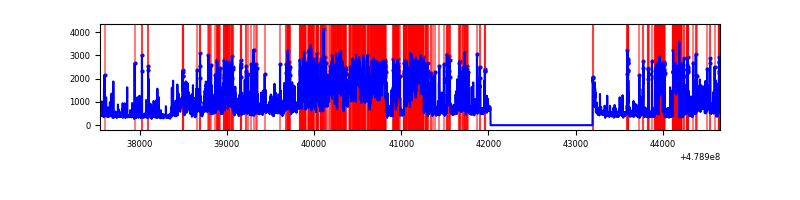 |
Top three noisy pixels from each quadrant. If the there are fewer than three noisy pixels in the level2.evt file, extra rows are filled as -1
| Pixel properties | Quadrant properties | ||||||
|---|---|---|---|---|---|---|---|
| Quadrant | DetID | PixID | Counts | Sigma | Mean | Median | Sigma |
| A | 12 | 3 | 1990216 | 12806.93 | 612 | 597 | 155.4 |
| A | 10 | 253 | 538585 | 3462.96 | 612 | 597 | 155.4 |
| A | 12 | 194 | 223531 | 1435.0 | 612 | 597 | 155.4 |
| B | 4 | 81 | 317952 | 2466.07 | 615 | 597 | 128.7 |
| B | 12 | 32 | 235419 | 1824.73 | 615 | 597 | 128.7 |
| B | 10 | 247 | 157672 | 1220.58 | 615 | 597 | 128.7 |
| C | 12 | 249 | 1009289 | 6427.16 | 572 | 570 | 156.9 |
| C | 15 | 254 | 927952 | 5908.91 | 572 | 570 | 156.9 |
| C | 15 | 1 | 285686 | 1816.65 | 572 | 570 | 156.9 |
| D | 8 | 176 | 1888858 | 11670.11 | 568 | 548 | 161.8 |
| D | 11 | 192 | 424594 | 2620.68 | 568 | 548 | 161.8 |
| D | 15 | 170 | 401677 | 2479.05 | 568 | 548 | 161.8 |
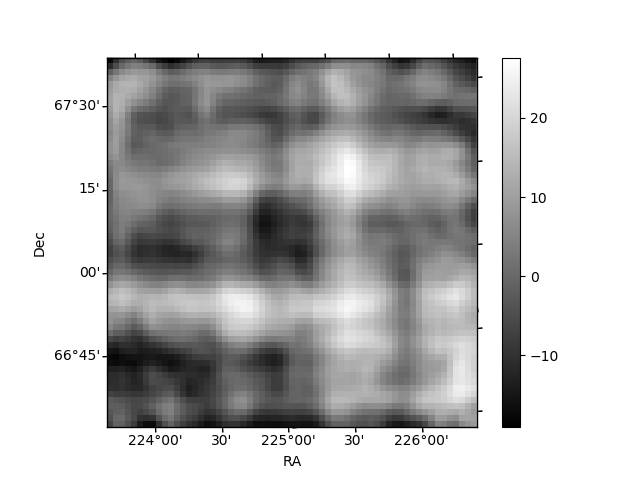
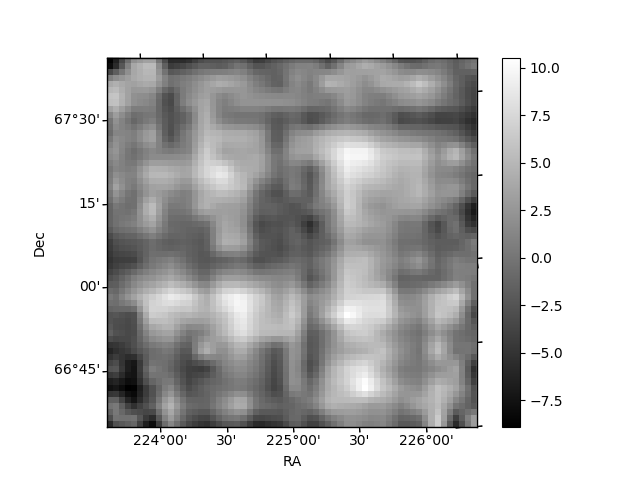
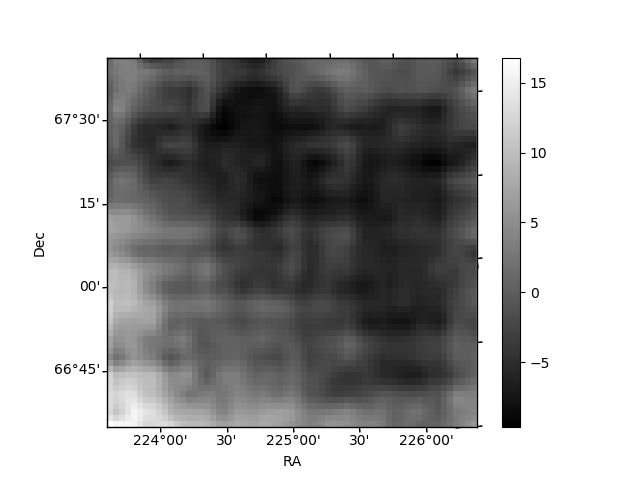
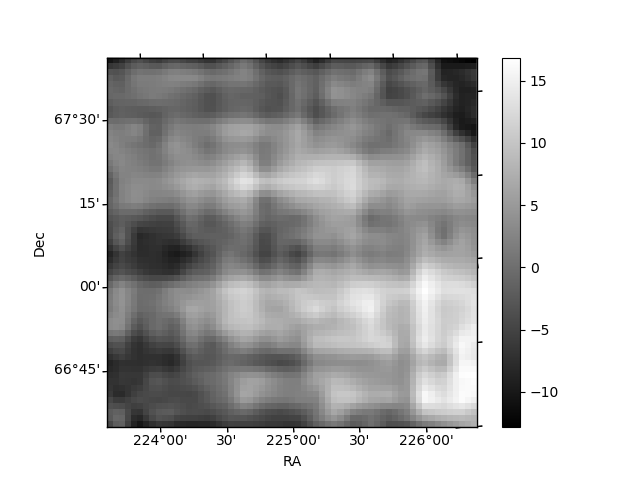
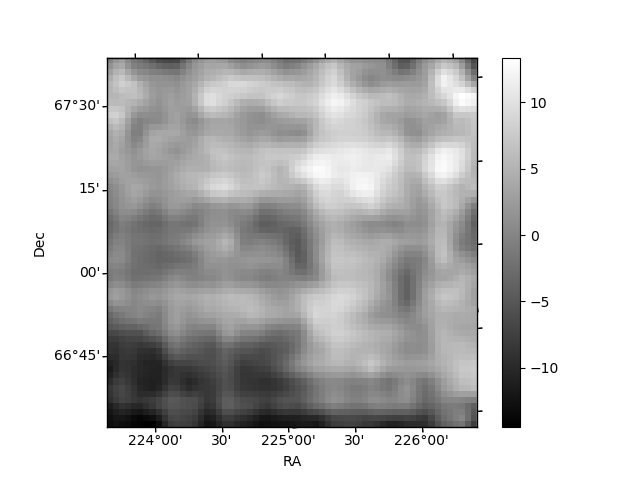
Histogram calculated using DETX and DETY for each event in the final _common_clean file
| Quadrant A | 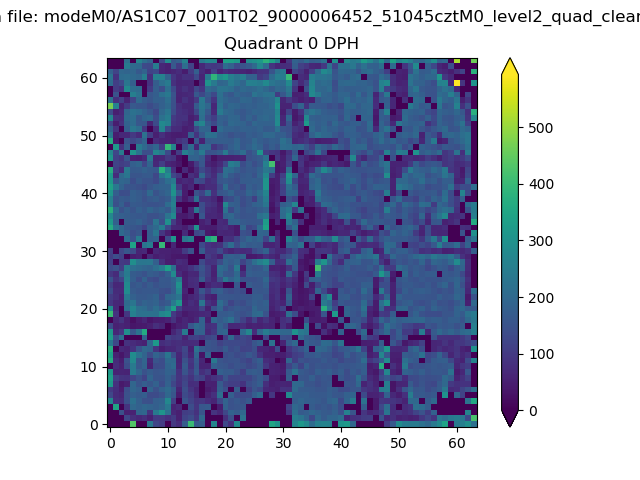 |
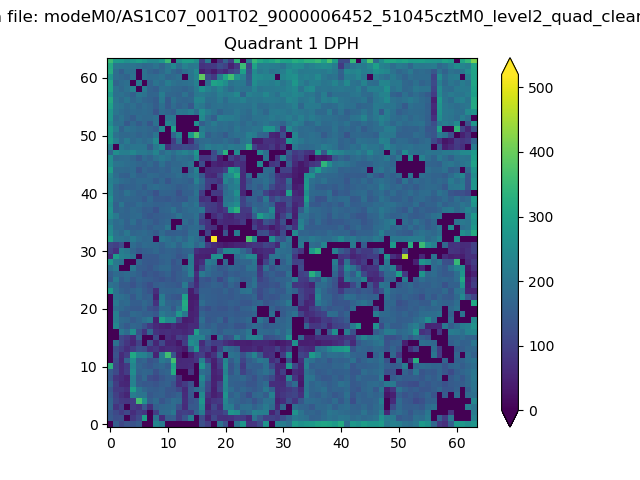 |
Quadrant B |
|---|---|---|---|
| Quadrant D | 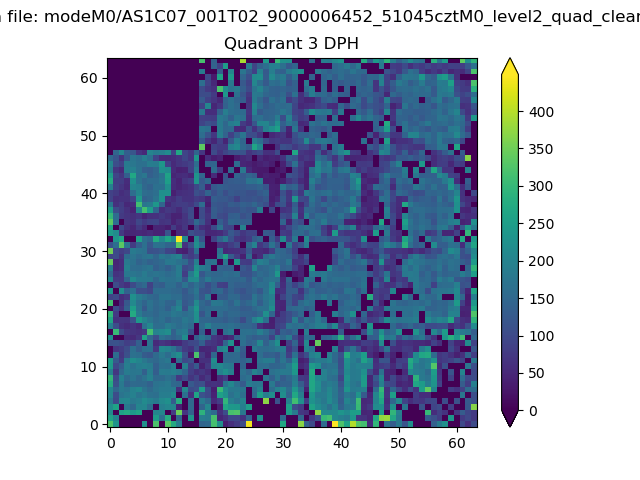 |
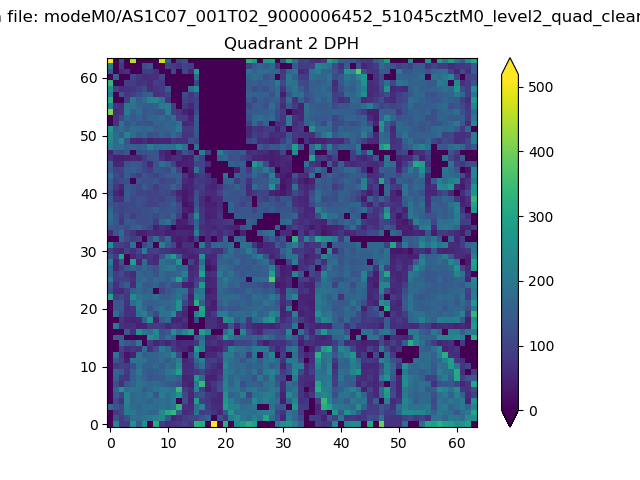 |
Quadrant C |
| Plot type | Count rate plots | Images |
|---|---|---|
| Comparison with Poisson distribution Blue bars denote a histogram of data divided into 1 sec bins. Red curve is a Poisson curve with rate = median count rate of data. |
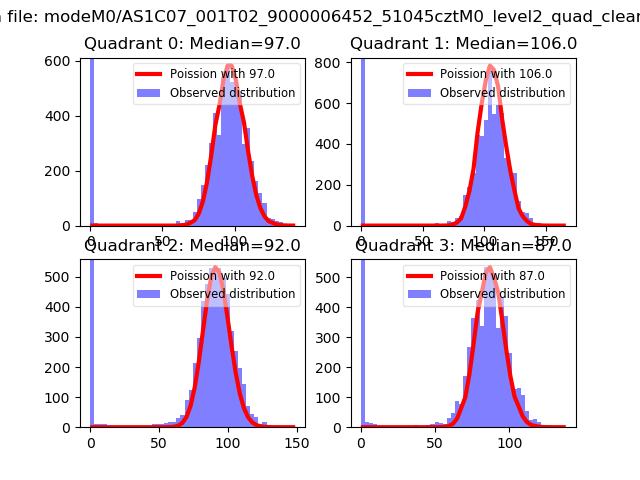 |
 |
| Quadrant-wise count rates Data is divided into 100 sec bins |
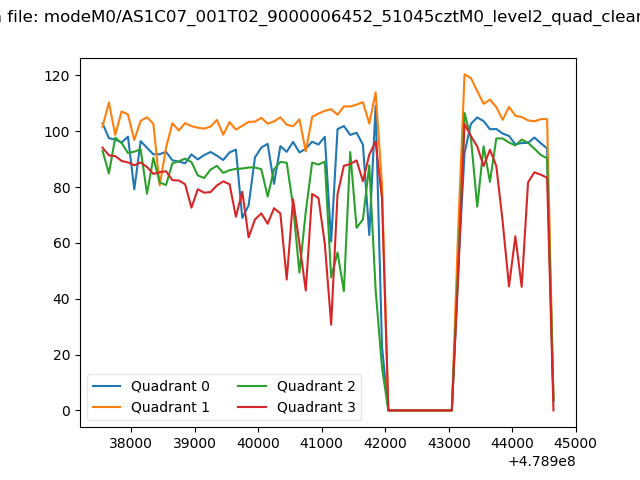 |
|
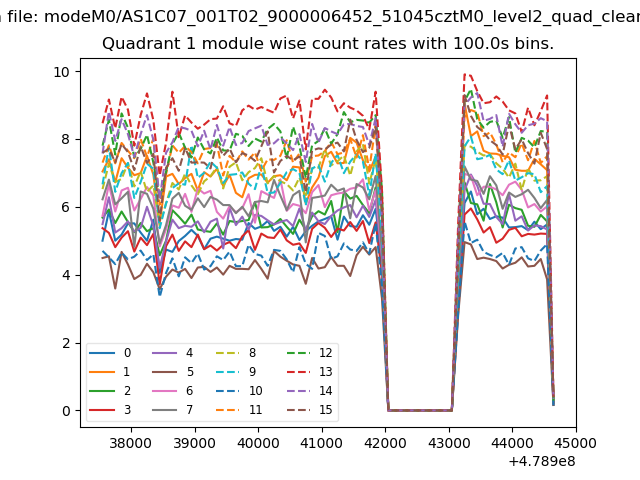
| Module-wise count rates for Quadrant A Data is divided into 100 sec bins |
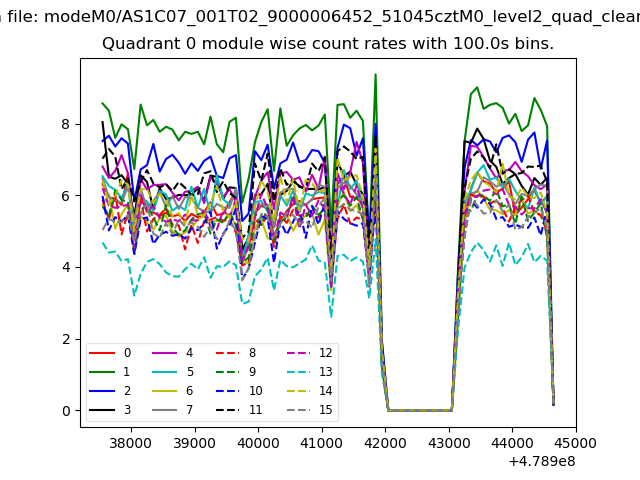 |
 |
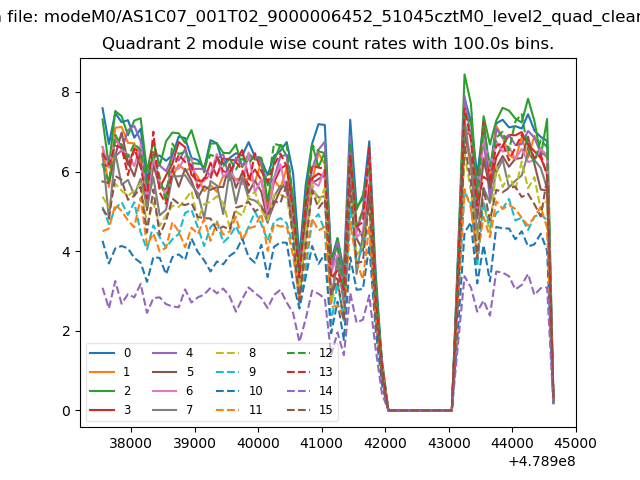
| Module-wise count rates for Quadrant B Data is divided into 100 sec bins |
 |
 |
| Module-wise count rates for Quadrant C Data is divided into 100 sec bins |
 |
 |
| Module-wise count rates for Quadrant D Data is divided into 100 sec bins |
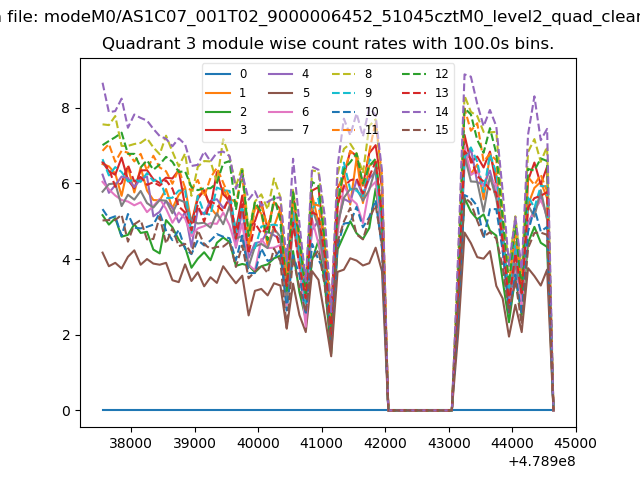 |
 |
| Parameter | Plot |
|---|---|
| CZT HV Monitor | 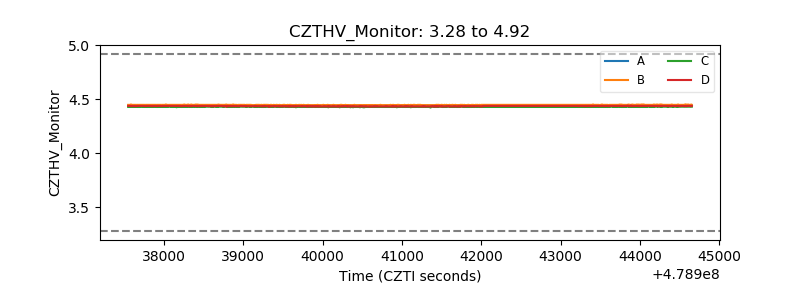 |
| D_VDD | 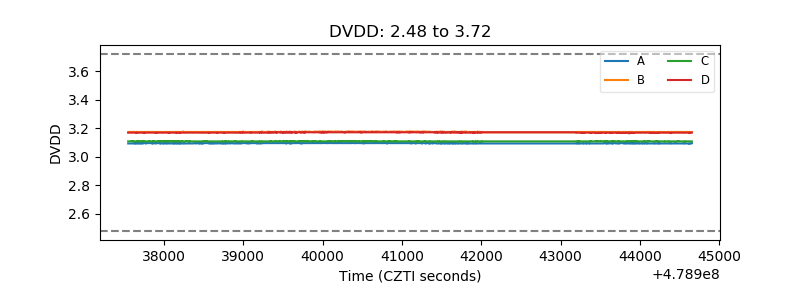 |
| Temperature 1 | 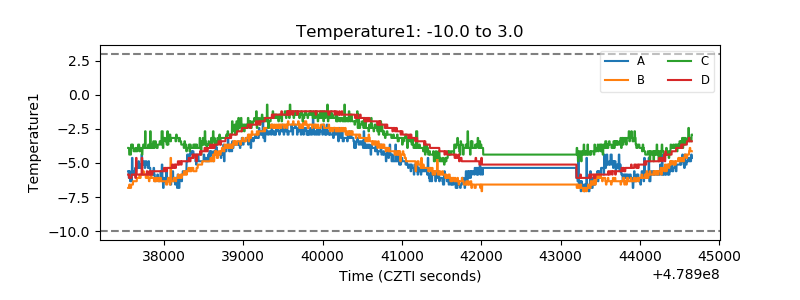 |
| Veto HV Monitor | 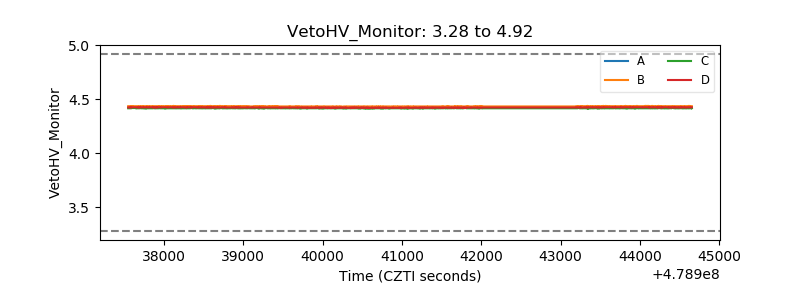 |
| Veto LLD | 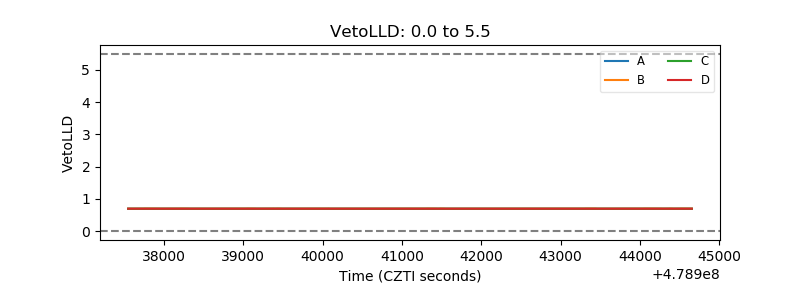 |
| Alpha Counter | 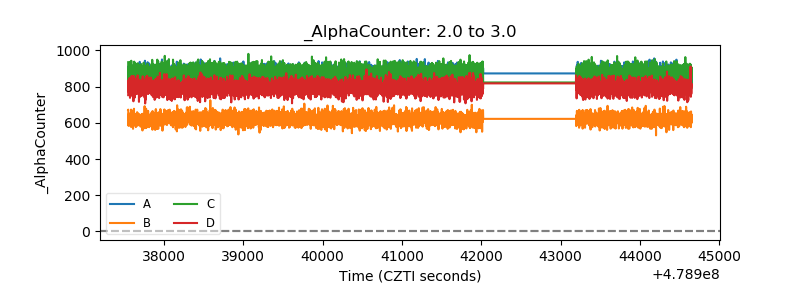 |
| _CPM_Rate | 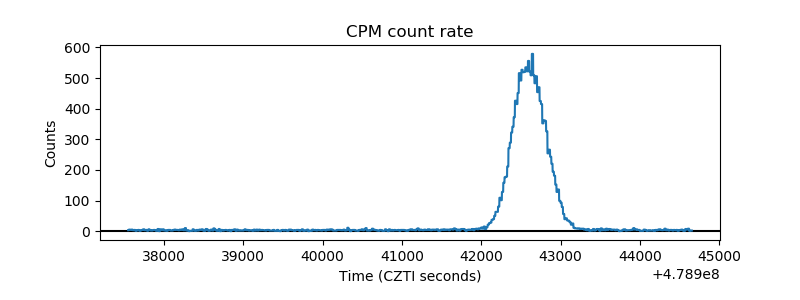 |
| CZT Counter | 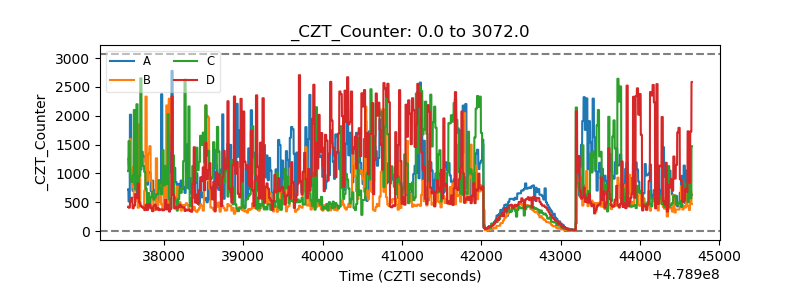 |
| +2.5 Volts monitor | 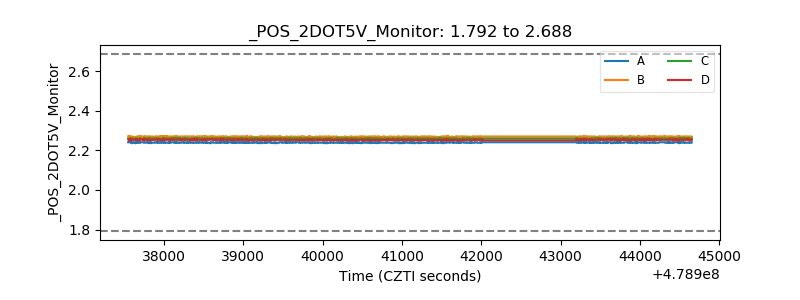 |
| +5 Volts monitor | 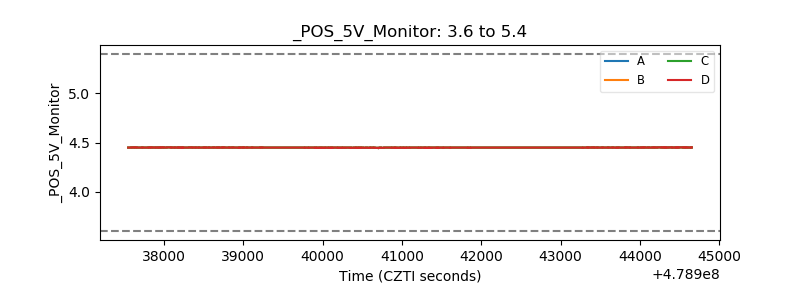 |
| _ROLL_ROT | 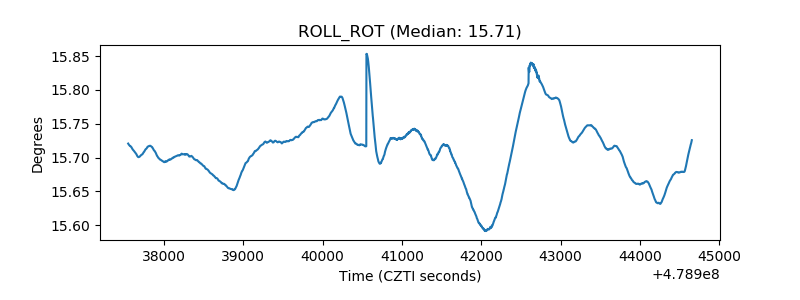 |
| _Roll_DEC | 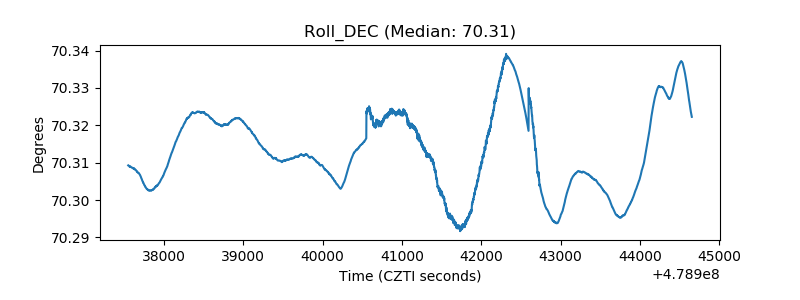 |
| _Roll_RA | 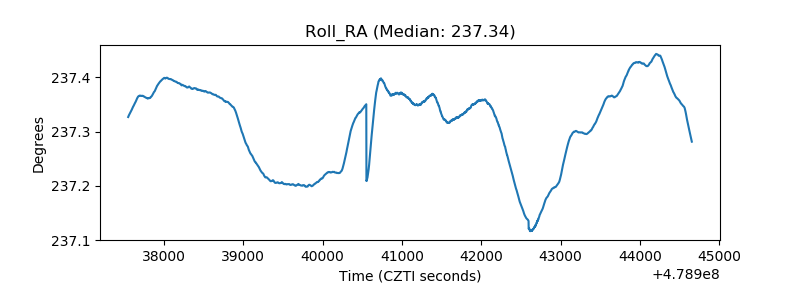 |
| Veto Counter | 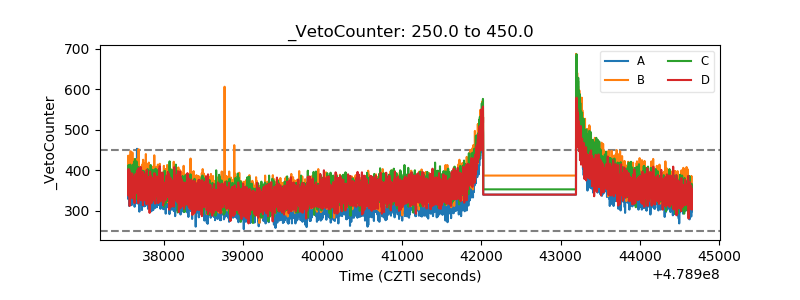 |