| Param | Original file | Final file |
|---|---|---|
| Filename | modeM0/AS1C07_001T02_9000006452_51046cztM0_level2.fits | modeM0/AS1C07_001T02_9000006452_51046cztM0_level2_quad_clean.evt |
| Size (bytes) | 715,311,360 | 88,902,720 |
| Size | 682.2 MB | 84.8 MB |
| Events in quadrant A | 8,151,385 | 557,222 |
| Events in quadrant B | 4,197,160 | 664,955 |
| Events in quadrant C | 5,790,720 | 563,221 |
| Events in quadrant D | 7,841,075 | 456,732 |
| Mode SS | |||
|---|---|---|---|
| Quadrant | BADHDUFLAG | Total packets | Discarded packets |
| A | 0 | 130 | 0 |
| B | 0 | 130 | 0 |
| C | 0 | 130 | 0 |
| D | 0 | 130 | 0 |
| Mode M9 | |||
|---|---|---|---|
| Quadrant | BADHDUFLAG | Total packets | Discarded packets |
| A | 0 | 11 | 0 |
| B | 0 | 11 | 0 |
| C | 0 | 11 | 0 |
| D | 0 | 11 | 0 |
| Mode M0 | |||
|---|---|---|---|
| Quadrant | BADHDUFLAG | Total packets | Discarded packets |
| A | 0 | 28758 | 1 |
| B | 0 | 16931 | 2 |
| C | 0 | 21665 | 1 |
| D | 0 | 27824 | 1 |
| Quadrant | Total seconds | Saturated seconds | Saturation percentage |
|---|---|---|---|
| A | 6447 | 984 | 15.262913% |
| B | 6446 | 210 | 3.257834% |
| C | 6447 | 535 | 8.298433% |
| D | 6447 | 1509 | 23.406235% |
Noise dominated data is calculated using 1-second bins in cleaned event files. If a bin has >2000 counts, and if more than 50% of those come from <1% of pixels, then it is considered to be noise-dominated and hence unusable.
| Quadrant | # 1 sec bins | Bins with >0 counts | Bins with >2000 counts | High rate bins dominated by noise | Noise dominated (total time) | Noise dominated (detector-on time) | Marked lightcurve |
|---|---|---|---|---|---|---|---|
| A | 7582 | 6447 | 882 | 882 | 11.63% | 13.68% | 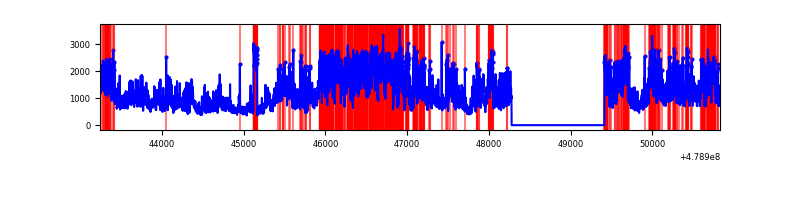 |
| B | 7581 | 6446 | 146 | 146 | 1.93% | 2.26% | 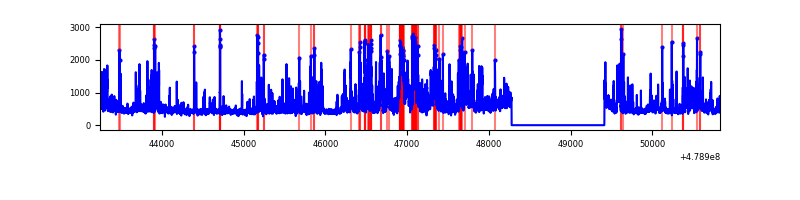 |
| C | 7582 | 6448 | 486 | 486 | 6.41% | 7.54% | 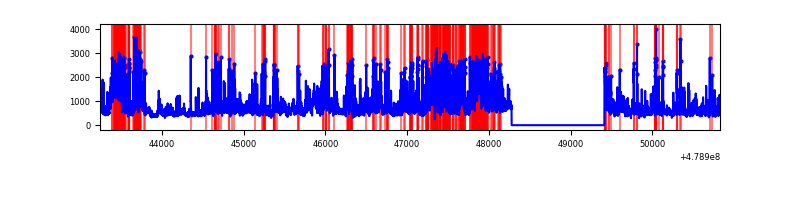 |
| D | 7581 | 6447 | 1487 | 1487 | 19.61% | 23.06% | 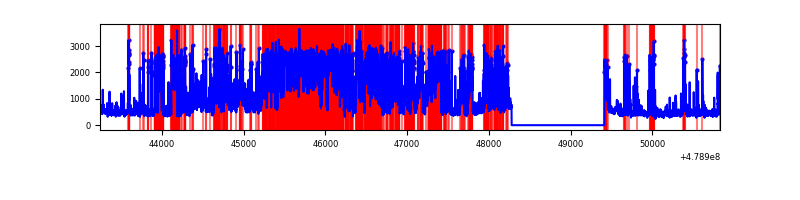 |
Top three noisy pixels from each quadrant. If the there are fewer than three noisy pixels in the level2.evt file, extra rows are filled as -1
| Pixel properties | Quadrant properties | ||||||
|---|---|---|---|---|---|---|---|
| Quadrant | DetID | PixID | Counts | Sigma | Mean | Median | Sigma |
| A | 12 | 3 | 1898918 | 11658.89 | 655 | 641 | 162.8 |
| A | 10 | 253 | 1493914 | 9171.43 | 655 | 641 | 162.8 |
| A | 12 | 80 | 685668 | 4207.32 | 655 | 641 | 162.8 |
| B | 12 | 32 | 286553 | 2030.93 | 667 | 645 | 140.8 |
| B | 4 | 81 | 246272 | 1744.79 | 667 | 645 | 140.8 |
| B | 10 | 14 | 203775 | 1442.92 | 667 | 645 | 140.8 |
| C | 12 | 249 | 1150847 | 6551.24 | 635 | 629 | 175.6 |
| C | 15 | 254 | 556014 | 3163.28 | 635 | 629 | 175.6 |
| C | 13 | 3 | 340228 | 1934.24 | 635 | 629 | 175.6 |
| D | 8 | 176 | 1861305 | 10752.15 | 598 | 576 | 173.1 |
| D | 9 | 1 | 1332060 | 7693.93 | 598 | 576 | 173.1 |
| D | 15 | 170 | 579735 | 3346.65 | 598 | 576 | 173.1 |
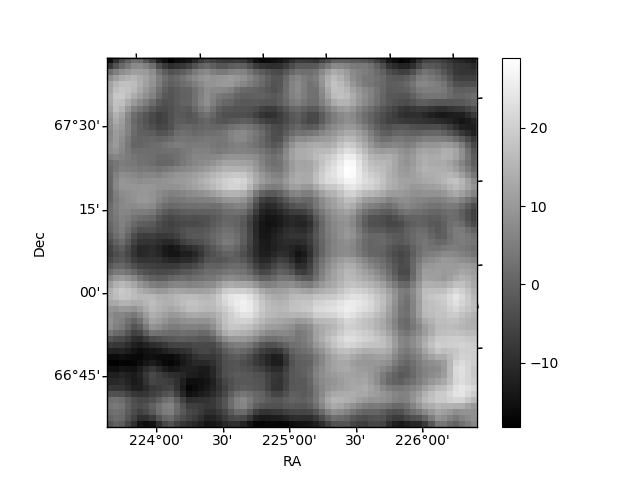
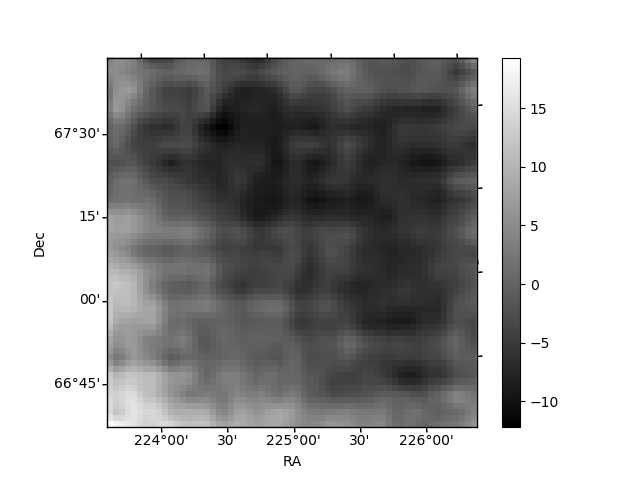
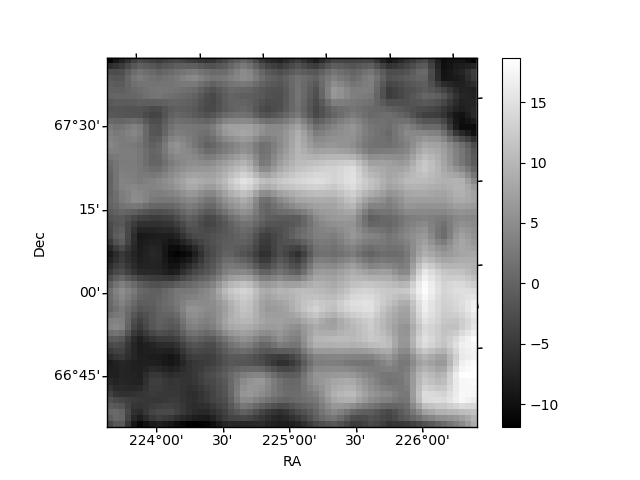
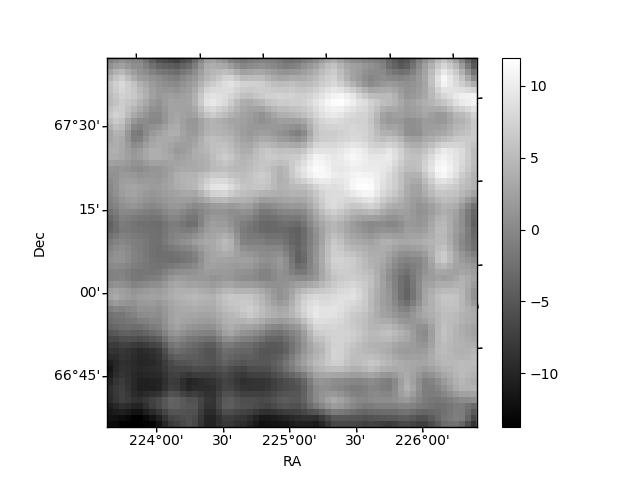
Histogram calculated using DETX and DETY for each event in the final _common_clean file
| Quadrant A | 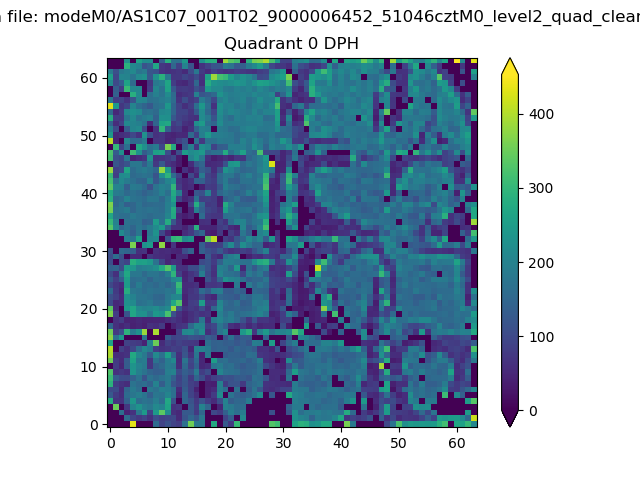 |
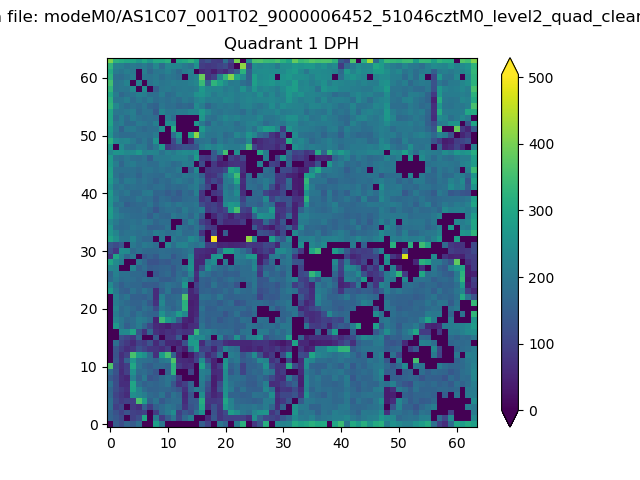 |
Quadrant B |
|---|---|---|---|
| Quadrant D | 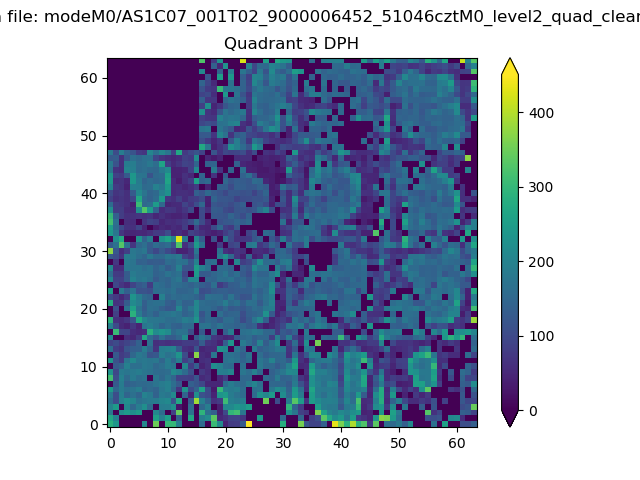 |
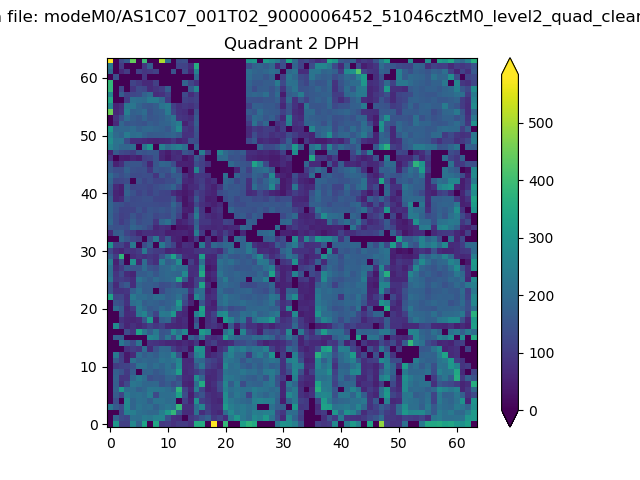 |
Quadrant C |
| Plot type | Count rate plots | Images |
|---|---|---|
| Comparison with Poisson distribution Blue bars denote a histogram of data divided into 1 sec bins. Red curve is a Poisson curve with rate = median count rate of data. |
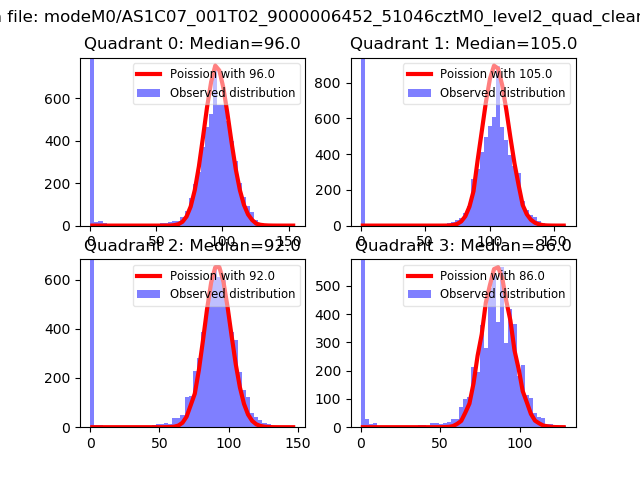 |
 |
| Quadrant-wise count rates Data is divided into 100 sec bins |
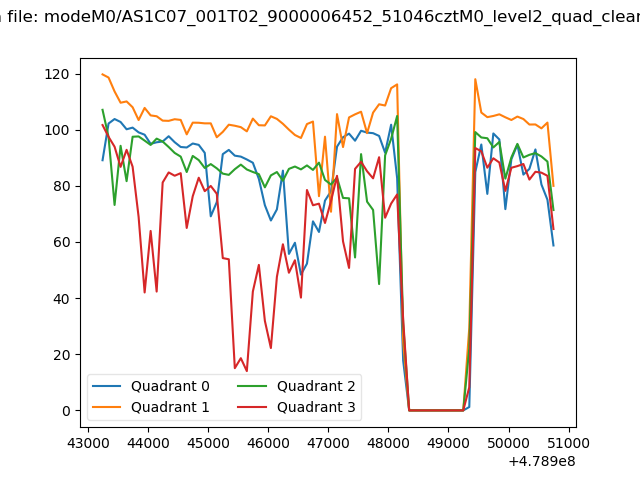 |
|
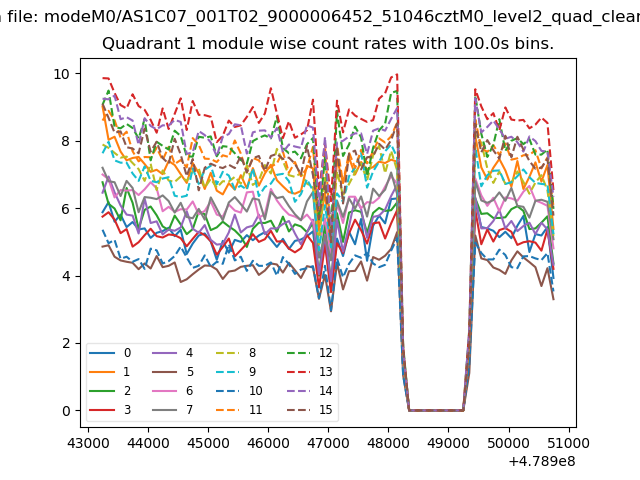
| Module-wise count rates for Quadrant A Data is divided into 100 sec bins |
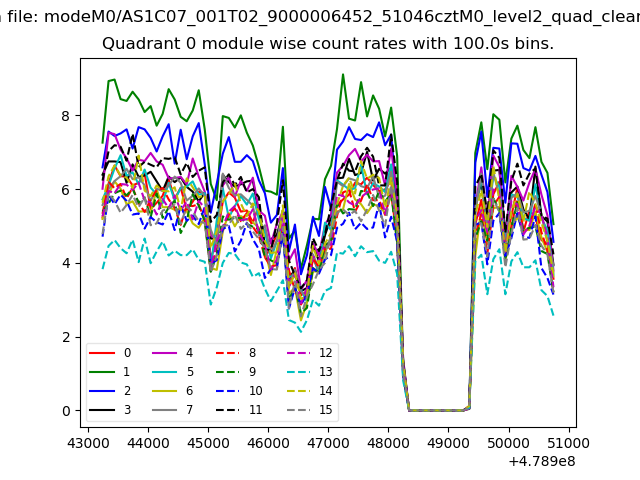 |
 |
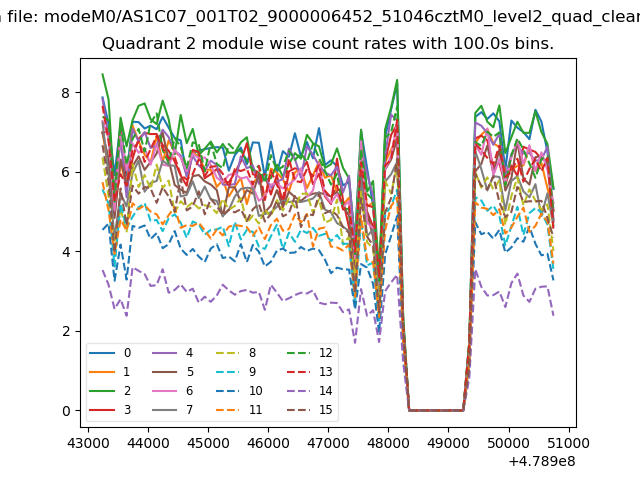
| Module-wise count rates for Quadrant B Data is divided into 100 sec bins |
 |
 |
| Module-wise count rates for Quadrant C Data is divided into 100 sec bins |
 |
 |
| Module-wise count rates for Quadrant D Data is divided into 100 sec bins |
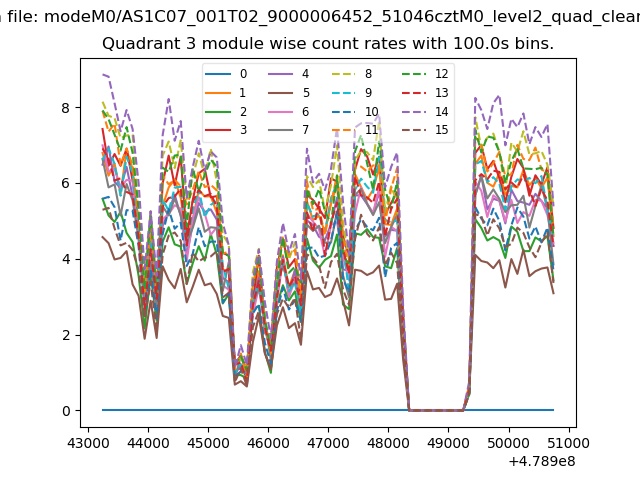 |
 |
| Parameter | Plot |
|---|---|
| CZT HV Monitor | 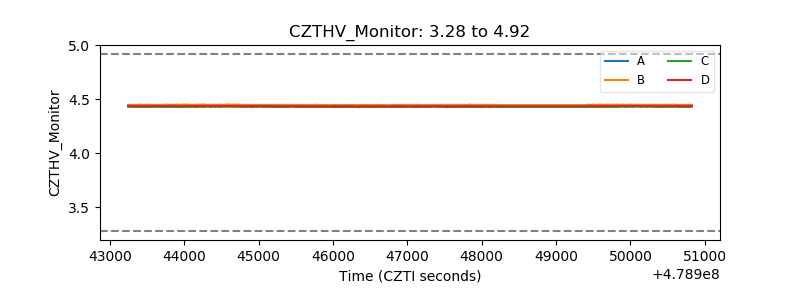 |
| D_VDD | 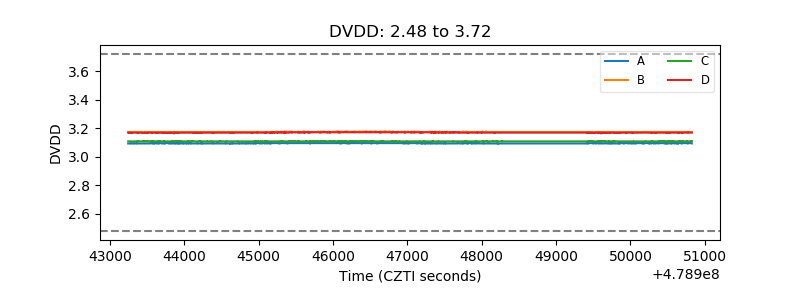 |
| Temperature 1 | 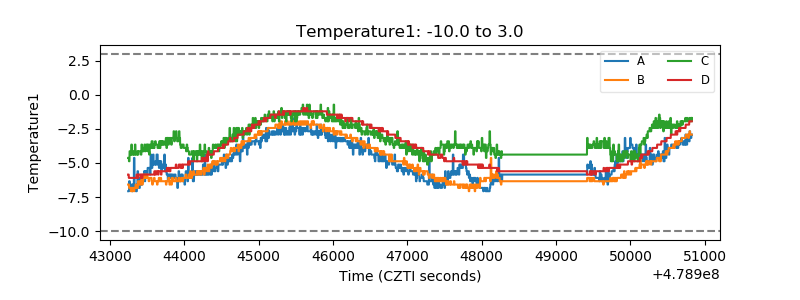 |
| Veto HV Monitor | 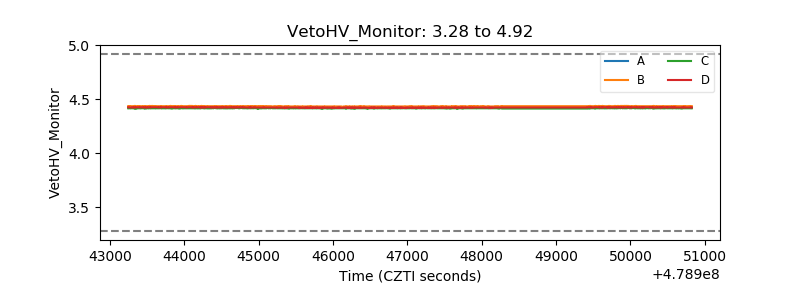 |
| Veto LLD | 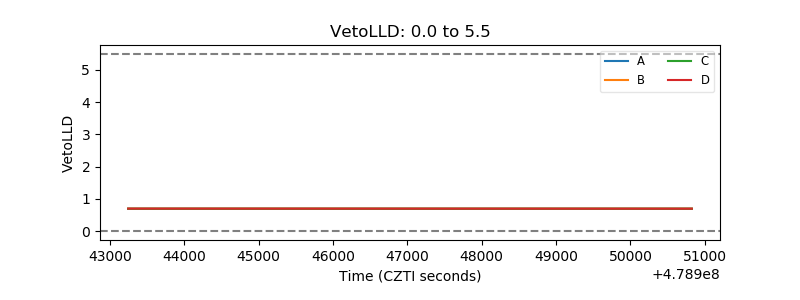 |
| Alpha Counter | 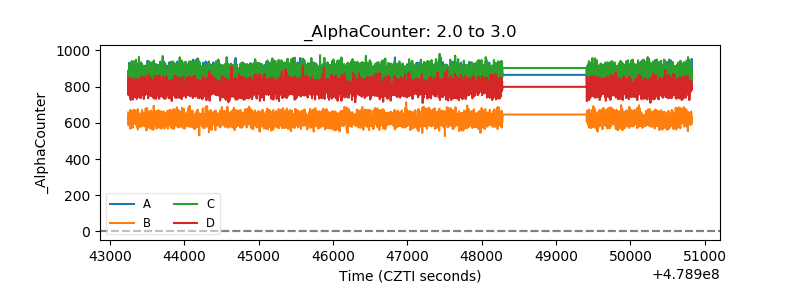 |
| _CPM_Rate | 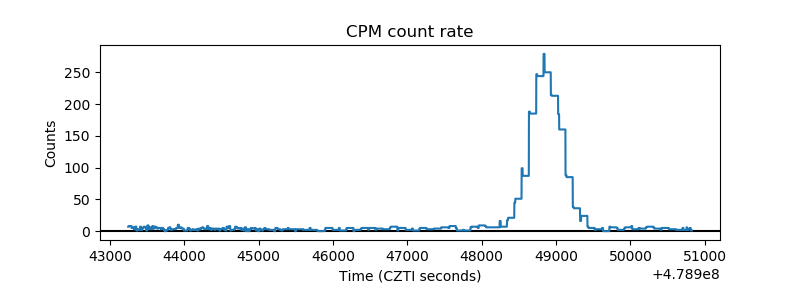 |
| CZT Counter | 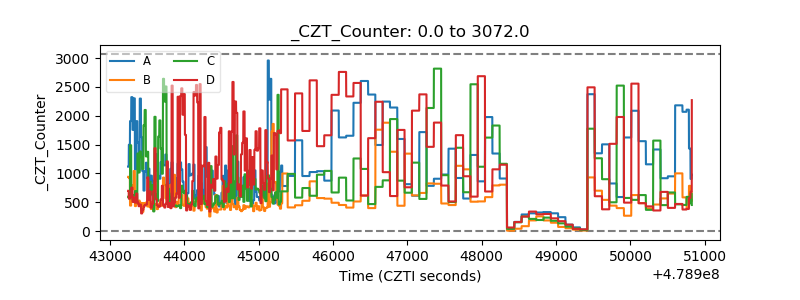 |
| +2.5 Volts monitor | 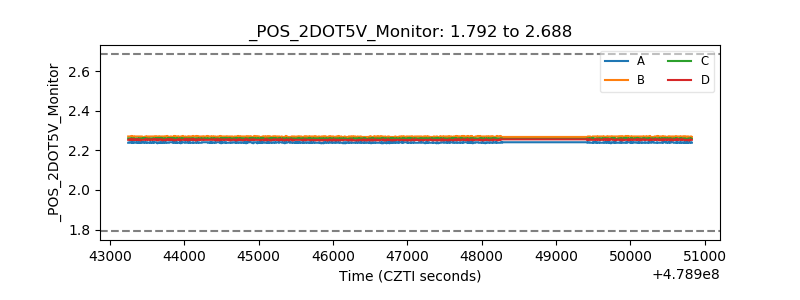 |
| +5 Volts monitor | 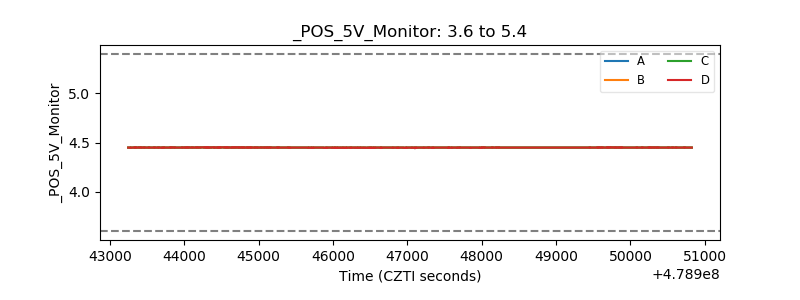 |
| _ROLL_ROT | 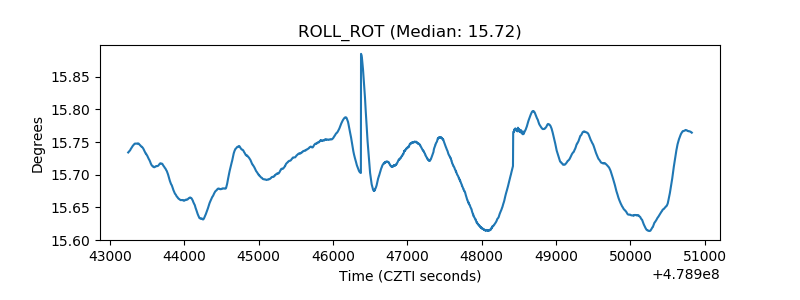 |
| _Roll_DEC | 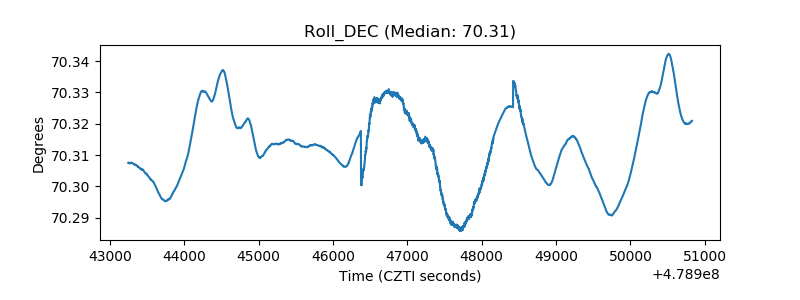 |
| _Roll_RA | 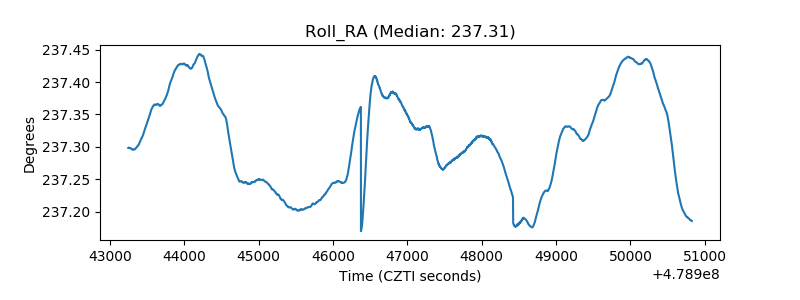 |
| Veto Counter | 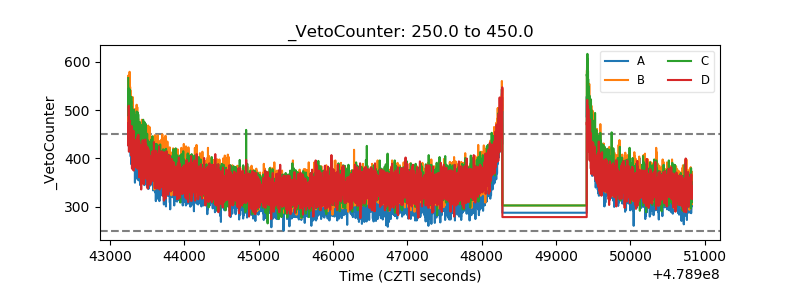 |