| Param | Original file | Final file |
|---|---|---|
| Filename | modeM0/AS1C07_001T02_9000006452_51047cztM0_level2.fits | modeM0/AS1C07_001T02_9000006452_51047cztM0_level2_quad_clean.evt |
| Size (bytes) | 747,005,760 | 85,769,280 |
| Size | 712.4 MB | 81.8 MB |
| Events in quadrant A | 10,048,263 | 479,371 |
| Events in quadrant B | 5,070,527 | 615,667 |
| Events in quadrant C | 6,459,966 | 527,457 |
| Events in quadrant D | 5,566,072 | 516,662 |
| Mode SS | |||
|---|---|---|---|
| Quadrant | BADHDUFLAG | Total packets | Discarded packets |
| A | 0 | 134 | 0 |
| B | 0 | 134 | 0 |
| C | 0 | 134 | 0 |
| D | 0 | 134 | 0 |
| Mode M9 | |||
|---|---|---|---|
| Quadrant | BADHDUFLAG | Total packets | Discarded packets |
| A | 0 | 8 | 0 |
| B | 0 | 8 | 0 |
| C | 0 | 8 | 0 |
| D | 0 | 8 | 0 |
| Mode M0 | |||
|---|---|---|---|
| Quadrant | BADHDUFLAG | Total packets | Discarded packets |
| A | 0 | 34436 | 8 |
| B | 0 | 19639 | 1 |
| C | 0 | 23689 | 1 |
| D | 0 | 21224 | 1 |
| Quadrant | Total seconds | Saturated seconds | Saturation percentage |
|---|---|---|---|
| A | 6556 | 1890 | 28.828554% |
| B | 6556 | 717 | 10.936547% |
| C | 6556 | 920 | 14.032947% |
| D | 6557 | 653 | 9.958823% |
Noise dominated data is calculated using 1-second bins in cleaned event files. If a bin has >2000 counts, and if more than 50% of those come from <1% of pixels, then it is considered to be noise-dominated and hence unusable.
| Quadrant | # 1 sec bins | Bins with >0 counts | Bins with >2000 counts | High rate bins dominated by noise | Noise dominated (total time) | Noise dominated (detector-on time) | Marked lightcurve |
|---|---|---|---|---|---|---|---|
| A | 7350 | 6555 | 1669 | 1669 | 22.71% | 25.46% | 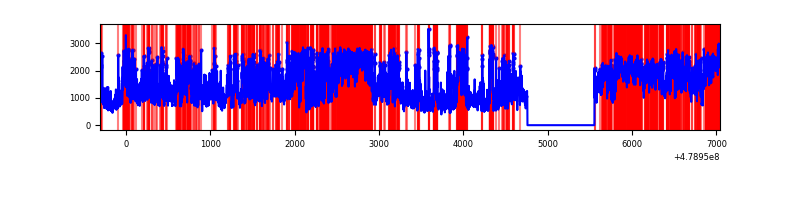 |
| B | 7351 | 6556 | 424 | 424 | 5.77% | 6.47% | 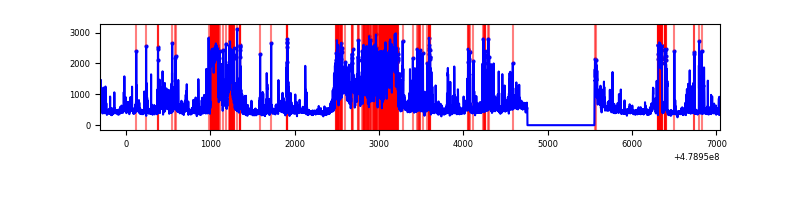 |
| C | 7351 | 6556 | 659 | 659 | 8.96% | 10.05% | 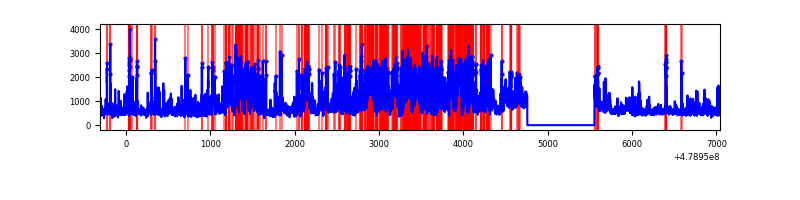 |
| D | 7352 | 6557 | 575 | 575 | 7.82% | 8.77% | 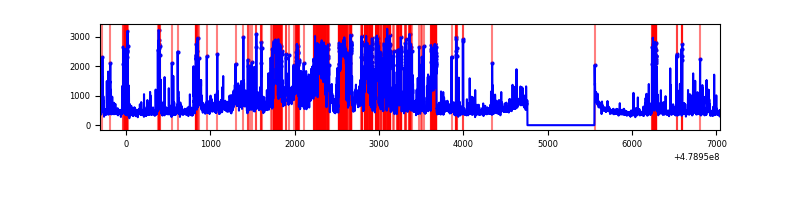 |
Top three noisy pixels from each quadrant. If the there are fewer than three noisy pixels in the level2.evt file, extra rows are filled as -1
| Pixel properties | Quadrant properties | ||||||
|---|---|---|---|---|---|---|---|
| Quadrant | DetID | PixID | Counts | Sigma | Mean | Median | Sigma |
| A | 12 | 80 | 2515594 | 15750.14 | 644 | 627 | 159.7 |
| A | 12 | 3 | 1633673 | 10227.06 | 644 | 627 | 159.7 |
| A | 10 | 253 | 1510808 | 9457.61 | 644 | 627 | 159.7 |
| B | 12 | 32 | 663237 | 4721.67 | 665 | 643 | 140.3 |
| B | 4 | 81 | 657078 | 4677.78 | 665 | 643 | 140.3 |
| B | 4 | 206 | 216453 | 1537.87 | 665 | 643 | 140.3 |
| C | 12 | 249 | 1981013 | 11363.37 | 637 | 632 | 174.3 |
| C | 15 | 158 | 637372 | 3653.6 | 637 | 632 | 174.3 |
| C | 12 | 247 | 202801 | 1160.04 | 637 | 632 | 174.3 |
| D | 8 | 176 | 1351397 | 7097.69 | 655 | 629 | 190.3 |
| D | 13 | 168 | 299116 | 1568.42 | 655 | 629 | 190.3 |
| D | 9 | 1 | 235262 | 1232.89 | 655 | 629 | 190.3 |
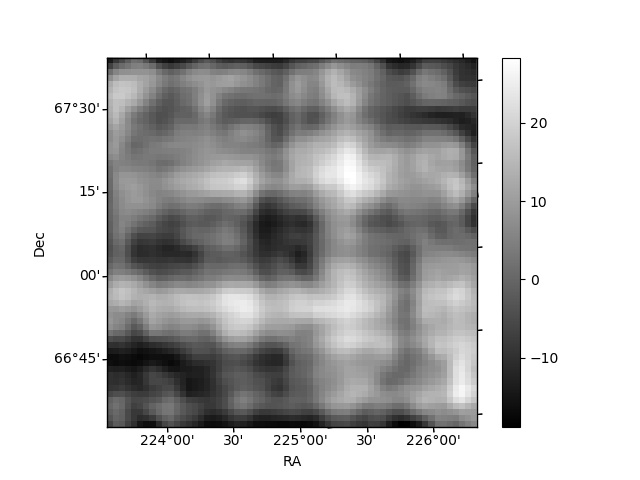
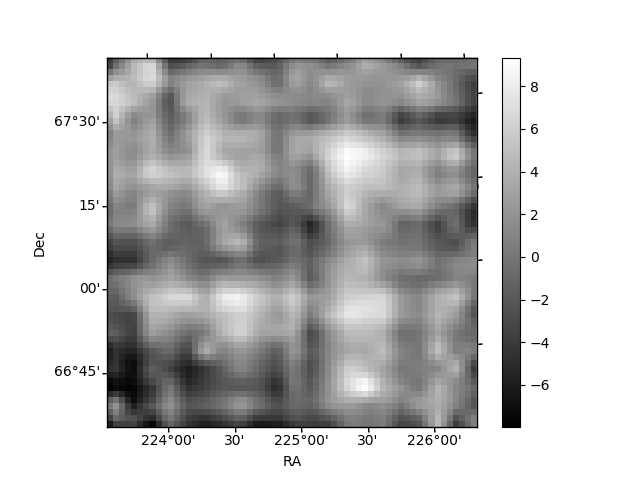
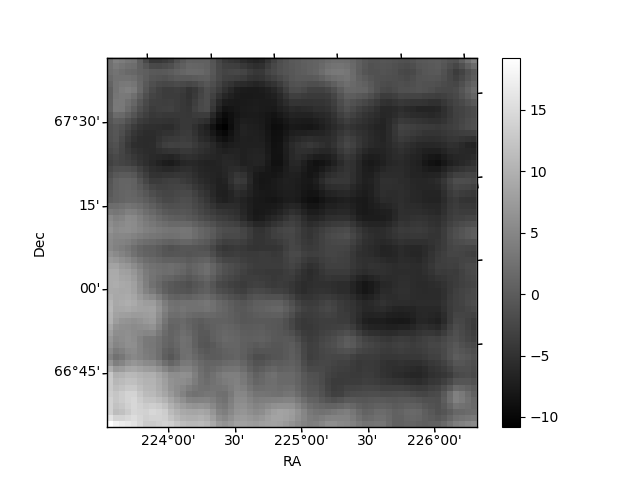
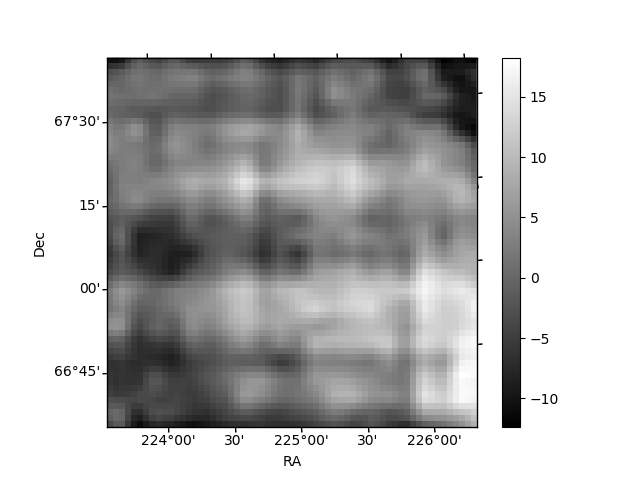
Histogram calculated using DETX and DETY for each event in the final _common_clean file
| Quadrant A | 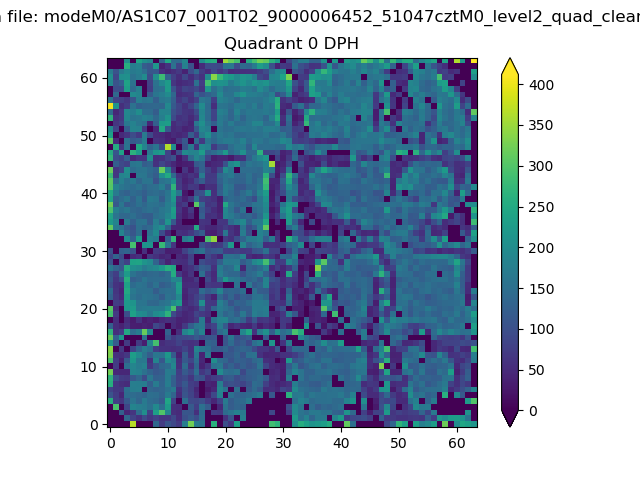 |
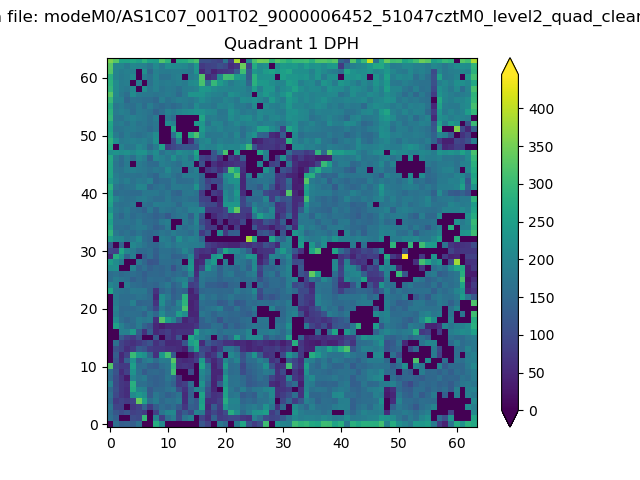 |
Quadrant B |
|---|---|---|---|
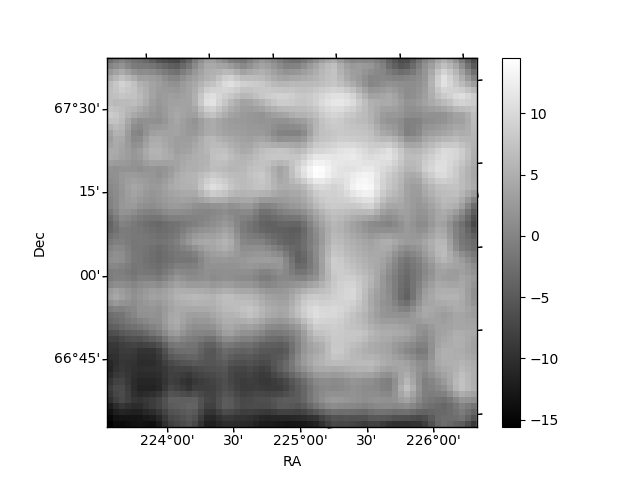
| Quadrant D | 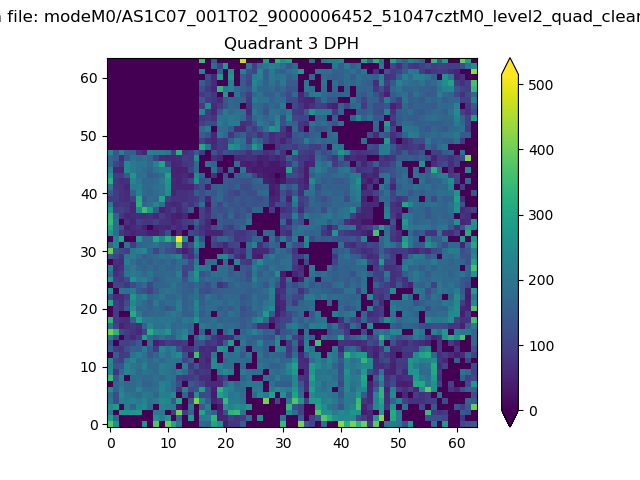 |
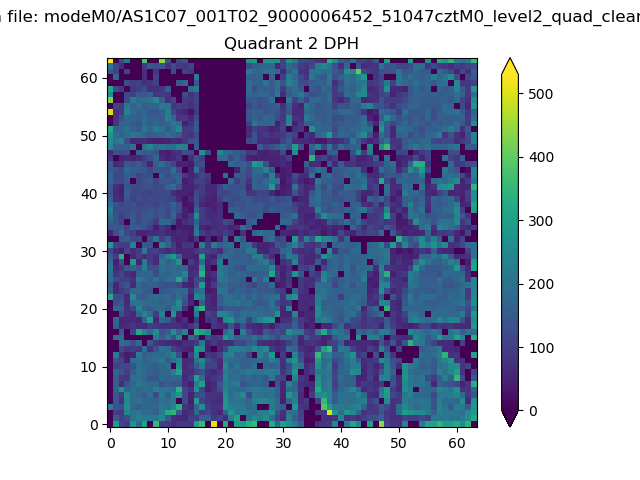 |
Quadrant C |
| Plot type | Count rate plots | Images |
|---|---|---|
| Comparison with Poisson distribution Blue bars denote a histogram of data divided into 1 sec bins. Red curve is a Poisson curve with rate = median count rate of data. |
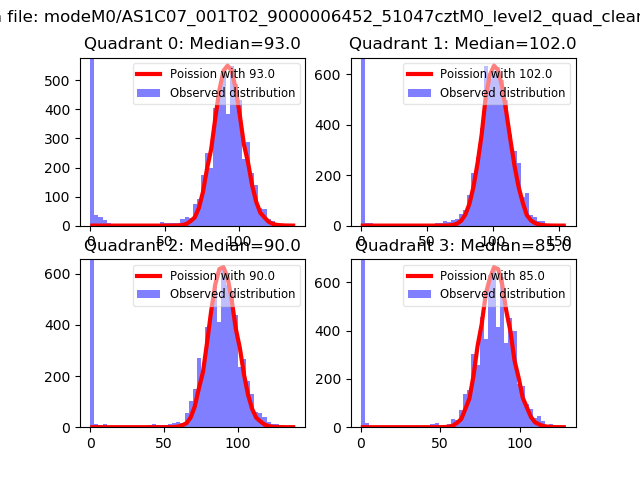 |
 |
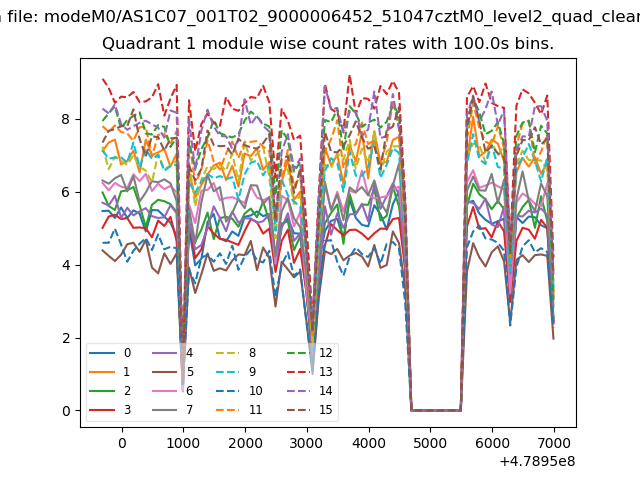
| Quadrant-wise count rates Data is divided into 100 sec bins |
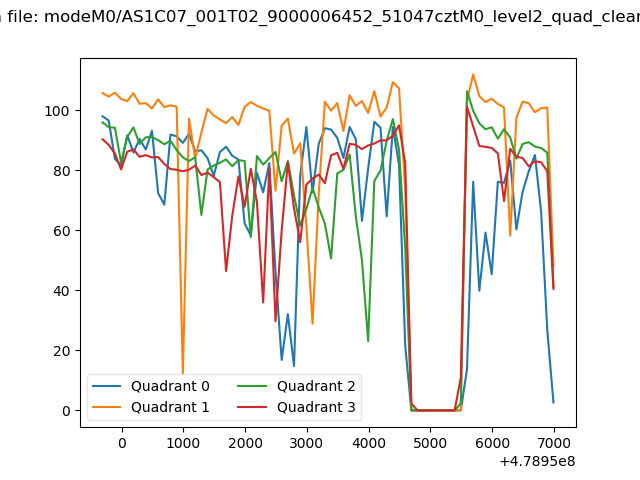 |
|
| Module-wise count rates for Quadrant A Data is divided into 100 sec bins |
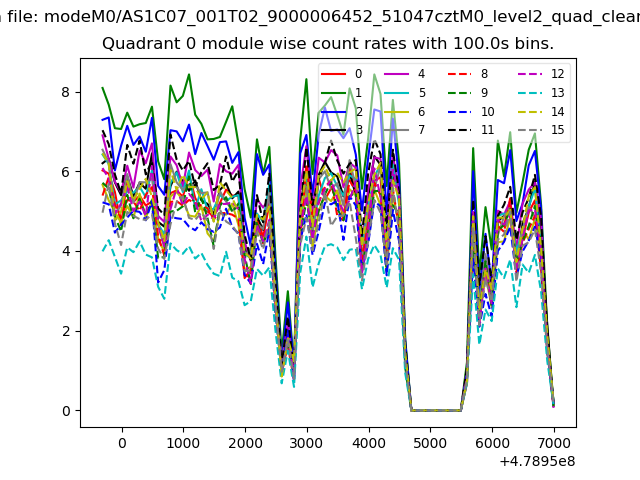 |
 |
| Module-wise count rates for Quadrant B Data is divided into 100 sec bins |
 |
 |
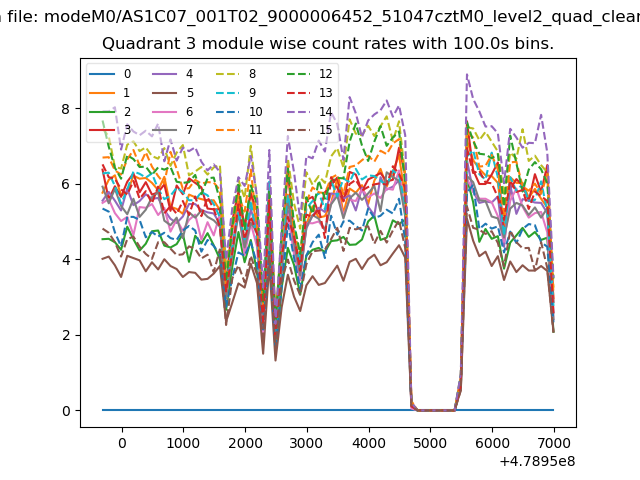
| Module-wise count rates for Quadrant C Data is divided into 100 sec bins |
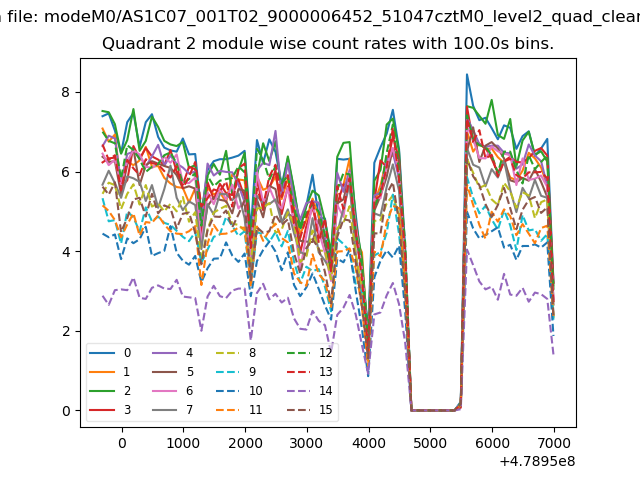 |
 |
| Module-wise count rates for Quadrant D Data is divided into 100 sec bins |
 |
 |
| Parameter | Plot |
|---|---|
| CZT HV Monitor | 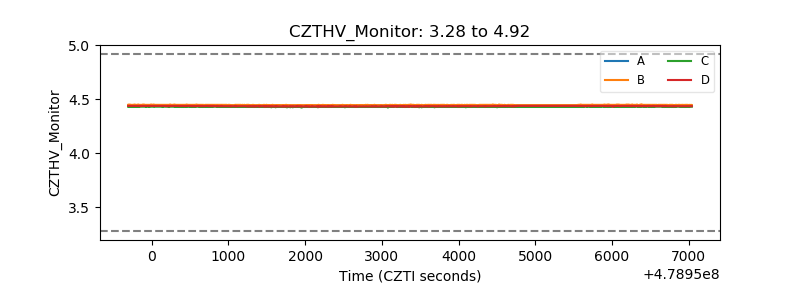 |
| D_VDD | 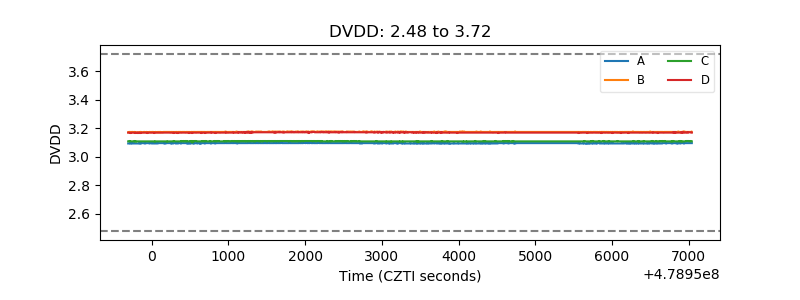 |
| Temperature 1 | 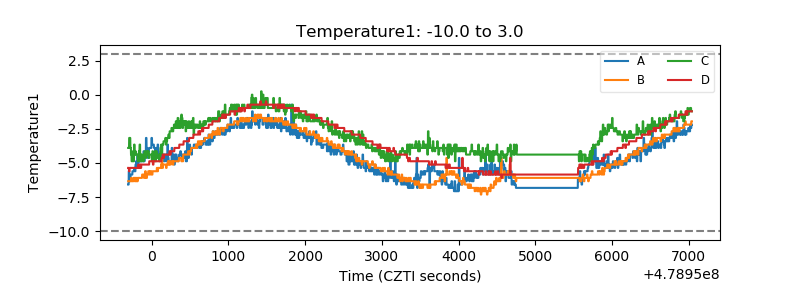 |
| Veto HV Monitor | 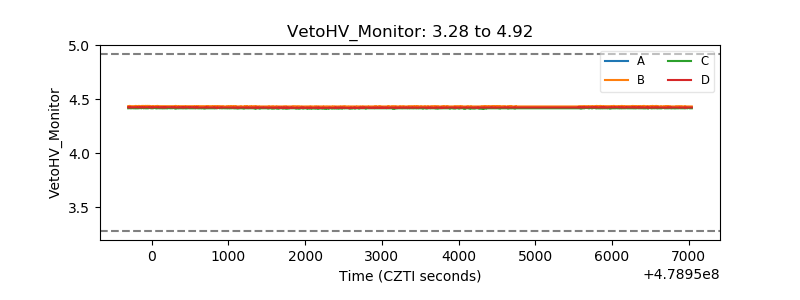 |
| Veto LLD | 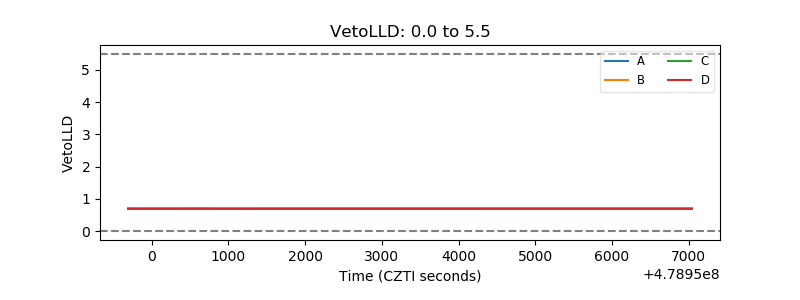 |
| Alpha Counter | 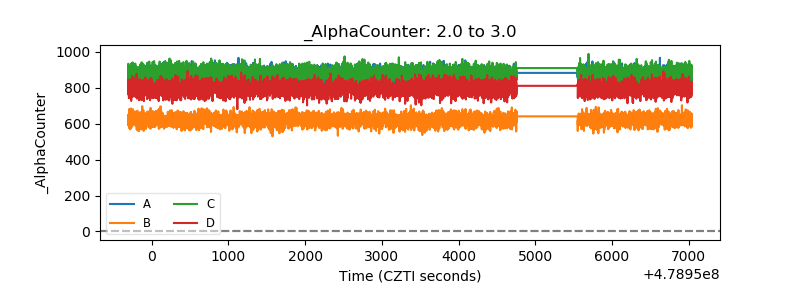 |
| _CPM_Rate | 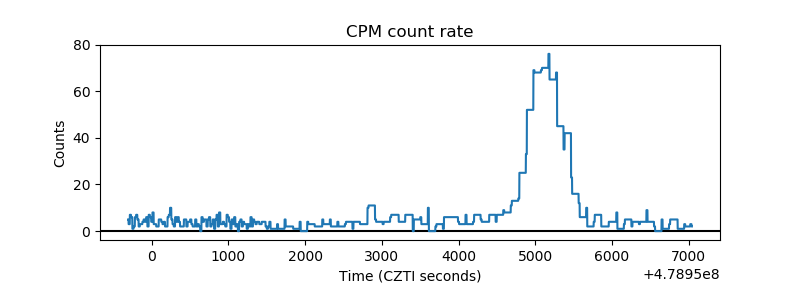 |
| CZT Counter | 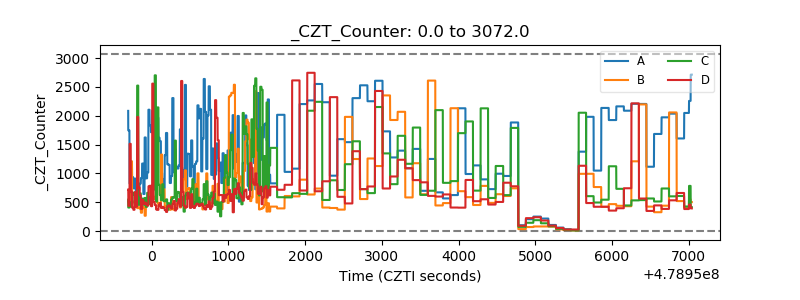 |
| +2.5 Volts monitor | 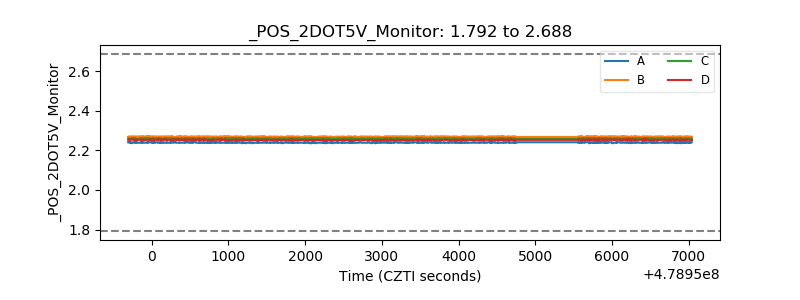 |
| +5 Volts monitor | 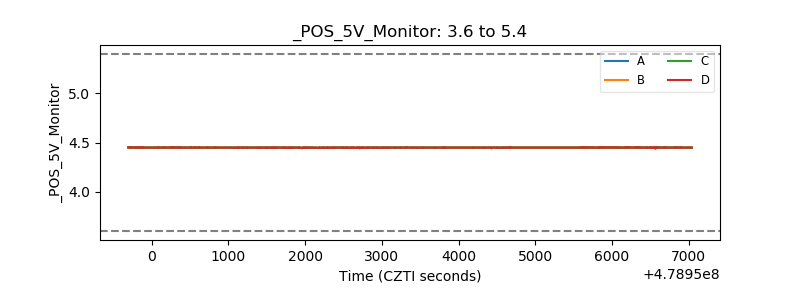 |
| _ROLL_ROT | 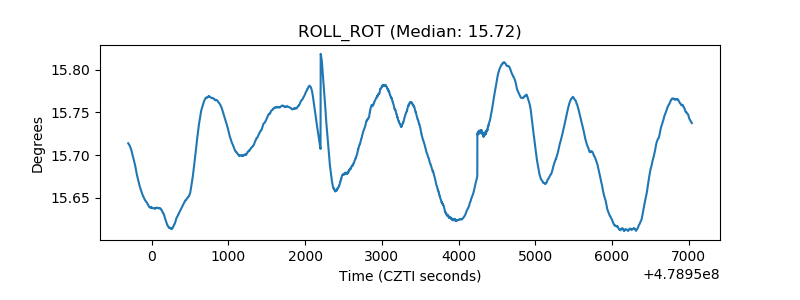 |
| _Roll_DEC | 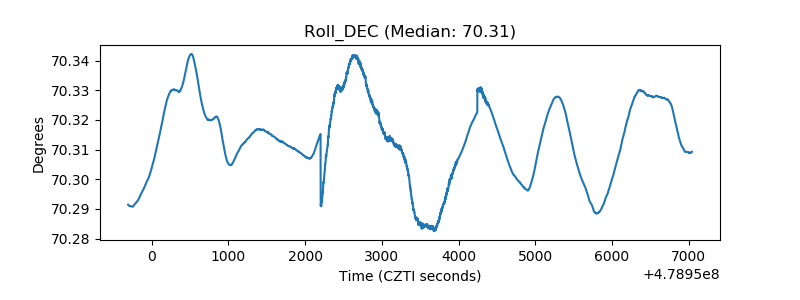 |
| _Roll_RA | 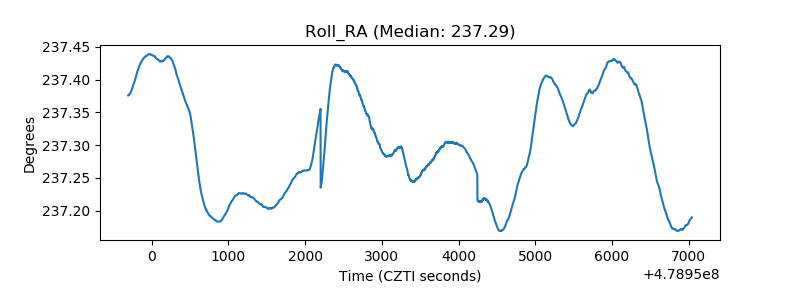 |
| Veto Counter | 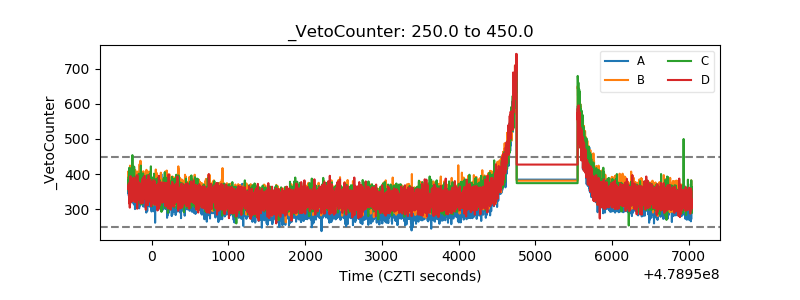 |