| Param | Original file | Final file |
|---|---|---|
| Filename | modeM0/AS1C07_001T02_9000006452_51048cztM0_level2.fits | modeM0/AS1C07_001T02_9000006452_51048cztM0_level2_quad_clean.evt |
| Size (bytes) | 2,967,848,640 | 367,709,760 |
| Size | 2.8 GB | 350.7 MB |
| Events in quadrant A | 35,577,779 | 2,202,329 |
| Events in quadrant B | 19,435,262 | 2,693,881 |
| Events in quadrant C | 26,855,777 | 2,269,526 |
| Events in quadrant D | 25,910,162 | 2,103,699 |
| Mode SS | |||
|---|---|---|---|
| Quadrant | BADHDUFLAG | Total packets | Discarded packets |
| A | 0 | 552 | 0 |
| B | 0 | 552 | 0 |
| C | 0 | 552 | 0 |
| D | 0 | 552 | 0 |
| Mode M9 | |||
|---|---|---|---|
| Quadrant | BADHDUFLAG | Total packets | Discarded packets |
| A | 0 | 47 | 0 |
| B | 0 | 47 | 0 |
| C | 0 | 47 | 0 |
| D | 0 | 47 | 0 |
| Mode M0 | |||
|---|---|---|---|
| Quadrant | BADHDUFLAG | Total packets | Discarded packets |
| A | 0 | 124778 | 6 |
| B | 0 | 76716 | 8 |
| C | 0 | 98715 | 6 |
| D | 0 | 96191 | 6 |
| Quadrant | Total seconds | Saturated seconds | Saturation percentage |
|---|---|---|---|
| A | 27087 | 5291 | 19.533355% |
| B | 27086 | 1739 | 6.420291% |
| C | 27087 | 2949 | 10.887141% |
| D | 27088 | 3468 | 12.802717% |
Noise dominated data is calculated using 1-second bins in cleaned event files. If a bin has >2000 counts, and if more than 50% of those come from <1% of pixels, then it is considered to be noise-dominated and hence unusable.
| Quadrant | # 1 sec bins | Bins with >0 counts | Bins with >2000 counts | High rate bins dominated by noise | Noise dominated (total time) | Noise dominated (detector-on time) | Marked lightcurve |
|---|---|---|---|---|---|---|---|
| A | 31802 | 27089 | 4548 | 4548 | 14.30% | 16.79% | 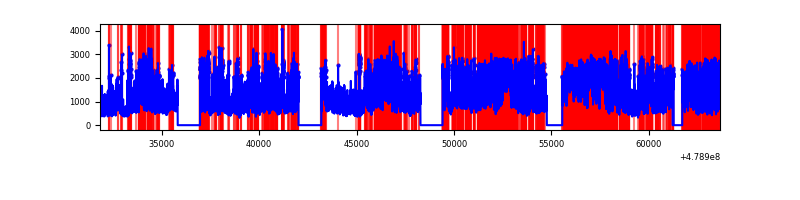 |
| B | 31802 | 27090 | 1018 | 1018 | 3.20% | 3.76% | 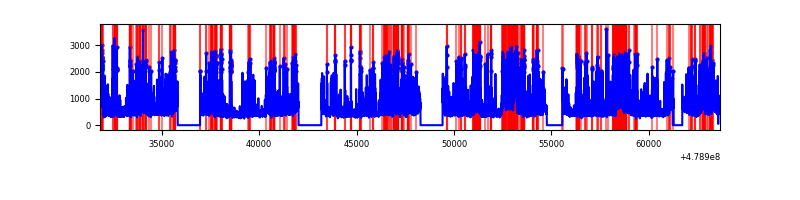 |
| C | 31802 | 27089 | 2569 | 2569 | 8.08% | 9.48% | 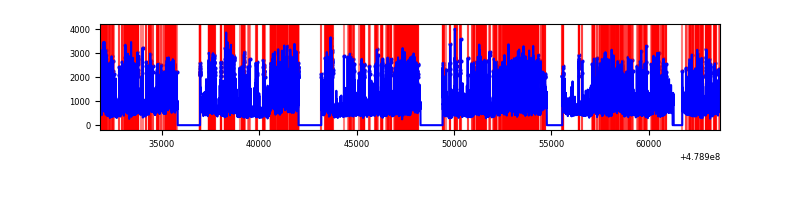 |
| D | 31803 | 27092 | 3215 | 3215 | 10.11% | 11.87% | 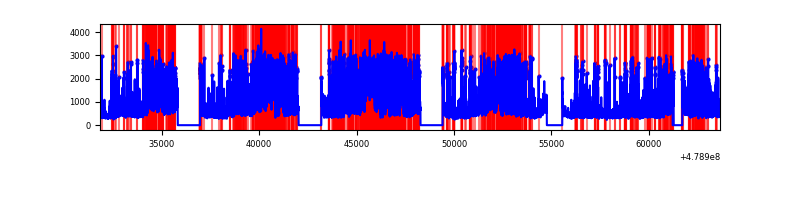 |
Top three noisy pixels from each quadrant. If the there are fewer than three noisy pixels in the level2.evt file, extra rows are filled as -1
| Pixel properties | Quadrant properties | ||||||
|---|---|---|---|---|---|---|---|
| Quadrant | DetID | PixID | Counts | Sigma | Mean | Median | Sigma |
| A | 12 | 3 | 7380224 | 10735.01 | 2716 | 2642 | 687.2 |
| A | 10 | 253 | 6181212 | 8990.35 | 2716 | 2642 | 687.2 |
| A | 12 | 80 | 4518764 | 6571.34 | 2716 | 2642 | 687.2 |
| B | 4 | 81 | 1795570 | 3085.4 | 2787 | 2698 | 581.1 |
| B | 12 | 32 | 1529519 | 2627.55 | 2787 | 2698 | 581.1 |
| B | 4 | 171 | 1007403 | 1729.02 | 2787 | 2698 | 581.1 |
| C | 12 | 249 | 7405518 | 10221.27 | 2662 | 2641 | 724.3 |
| C | 15 | 254 | 1558042 | 2147.57 | 2662 | 2641 | 724.3 |
| C | 15 | 158 | 1251244 | 1723.97 | 2662 | 2641 | 724.3 |
| D | 8 | 176 | 6365455 | 8469.34 | 2649 | 2549 | 751.3 |
| D | 9 | 1 | 1961879 | 2607.96 | 2649 | 2549 | 751.3 |
| D | 15 | 170 | 1398117 | 1857.57 | 2649 | 2549 | 751.3 |
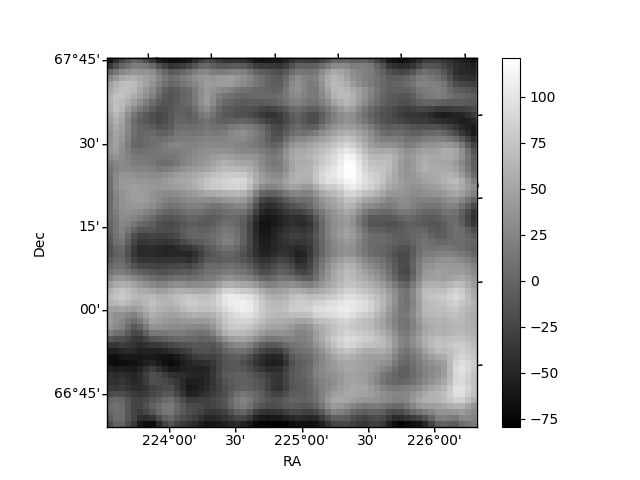
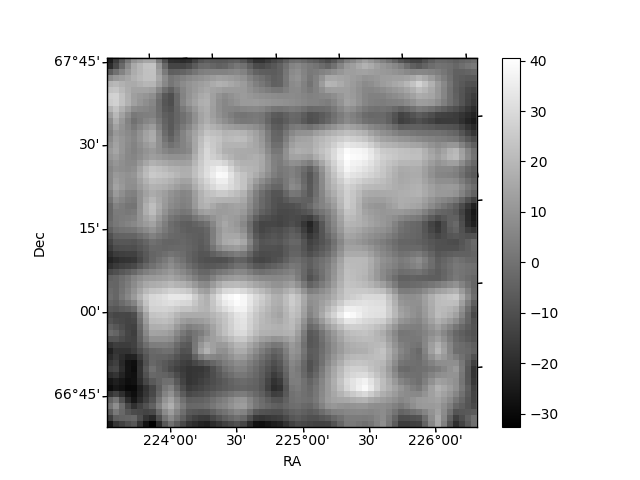
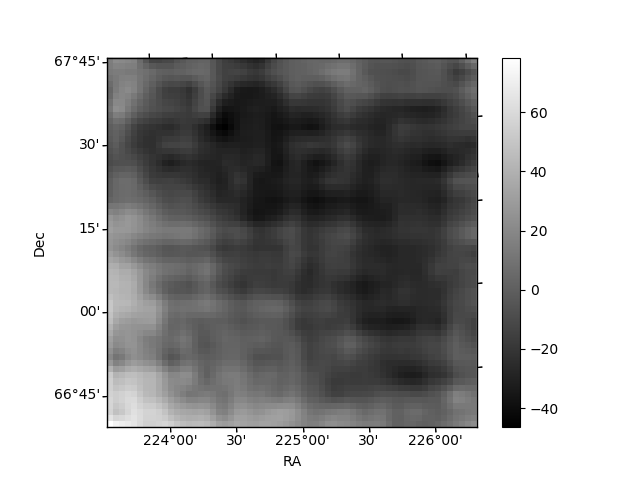
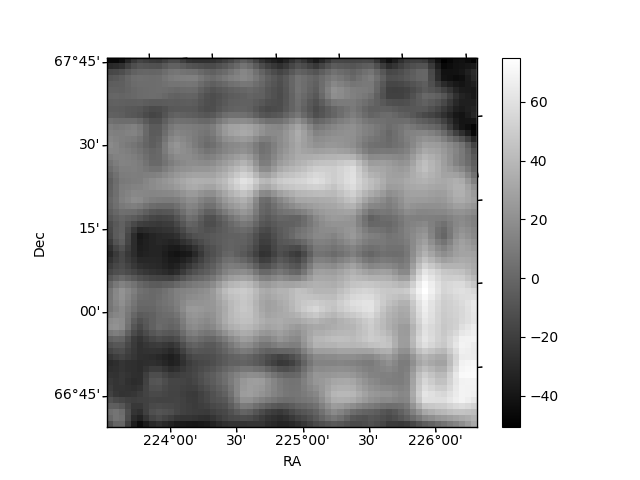
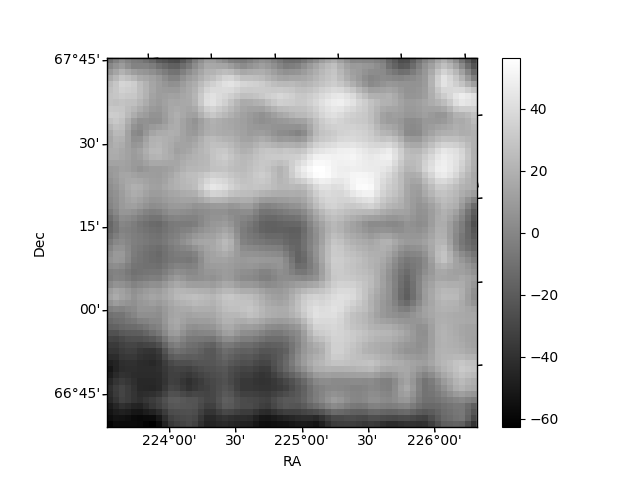
Histogram calculated using DETX and DETY for each event in the final _common_clean file
| Quadrant A | 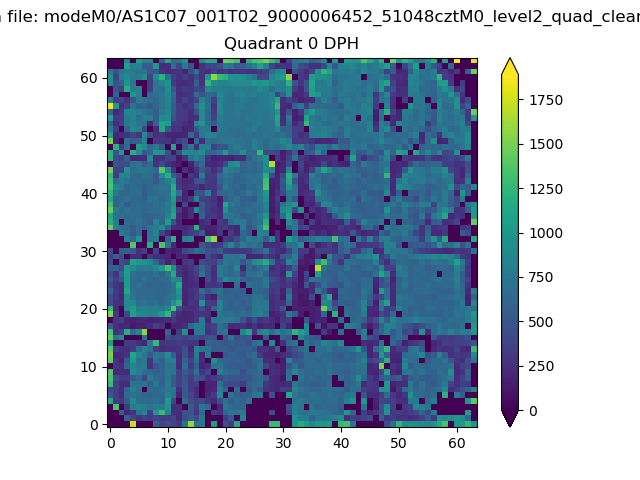 |
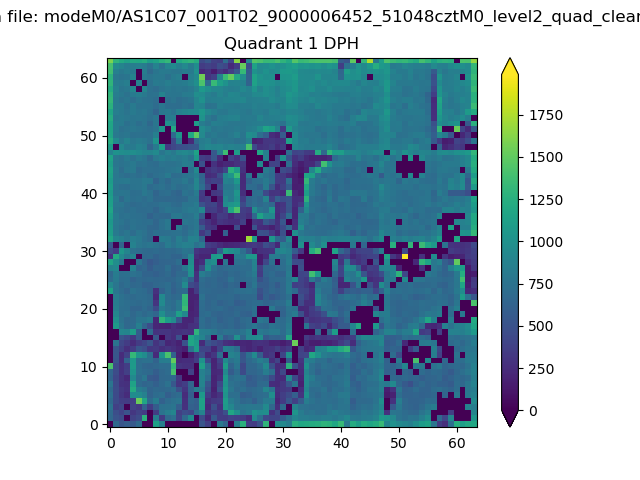 |
Quadrant B |
|---|---|---|---|
| Quadrant D | 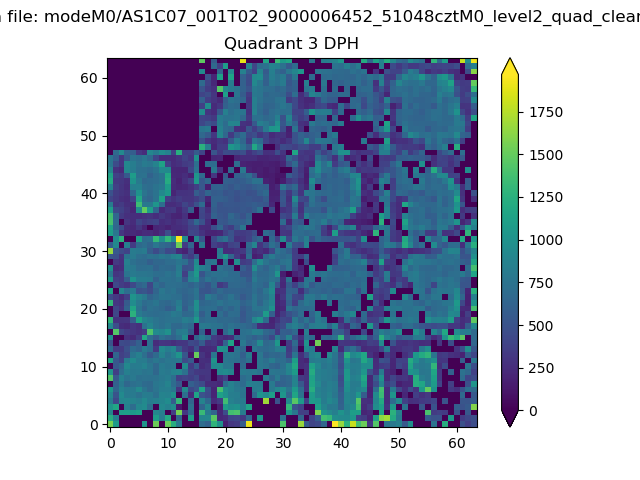 |
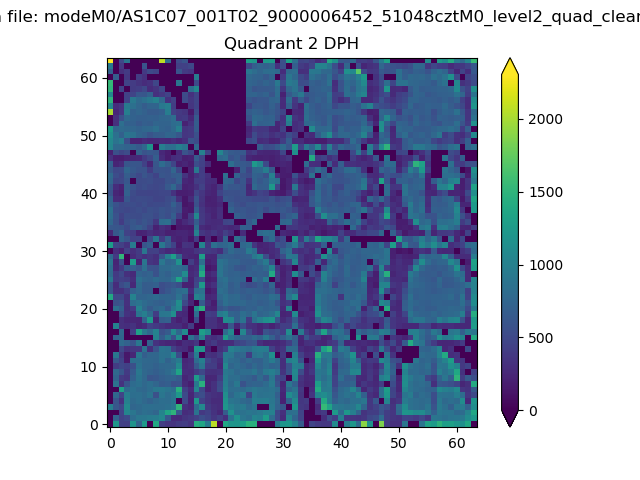 |
Quadrant C |
| Plot type | Count rate plots | Images |
|---|---|---|
| Comparison with Poisson distribution Blue bars denote a histogram of data divided into 1 sec bins. Red curve is a Poisson curve with rate = median count rate of data. |
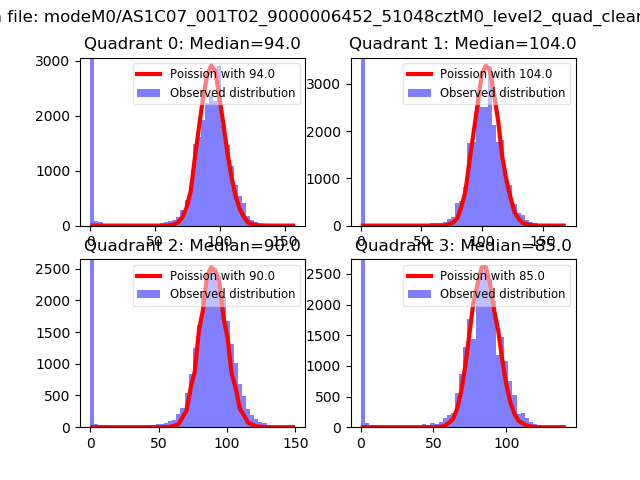 |
 |
| Quadrant-wise count rates Data is divided into 100 sec bins |
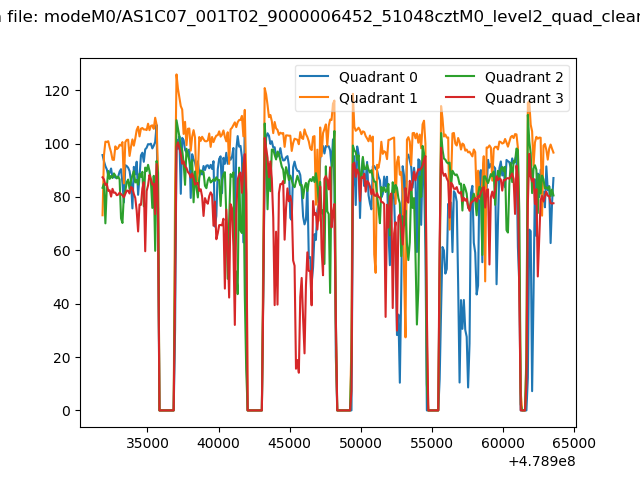 |
|
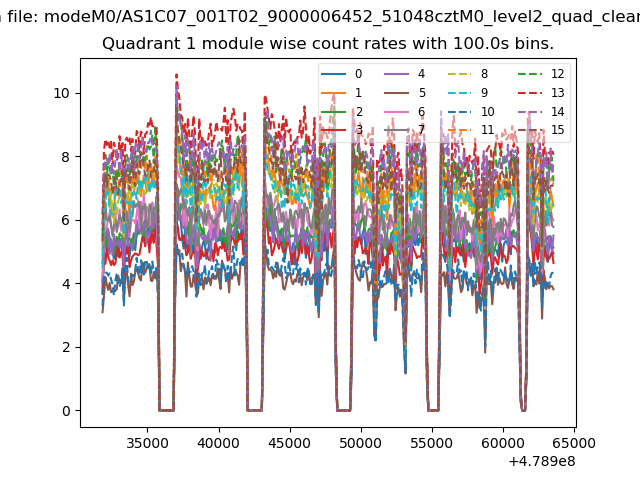
| Module-wise count rates for Quadrant A Data is divided into 100 sec bins |
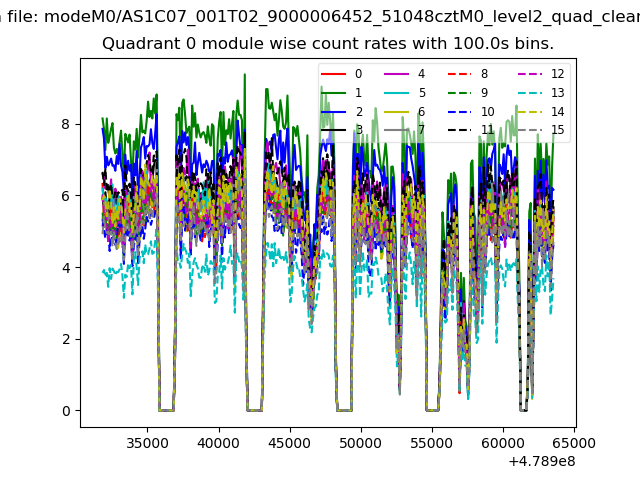 |
 |
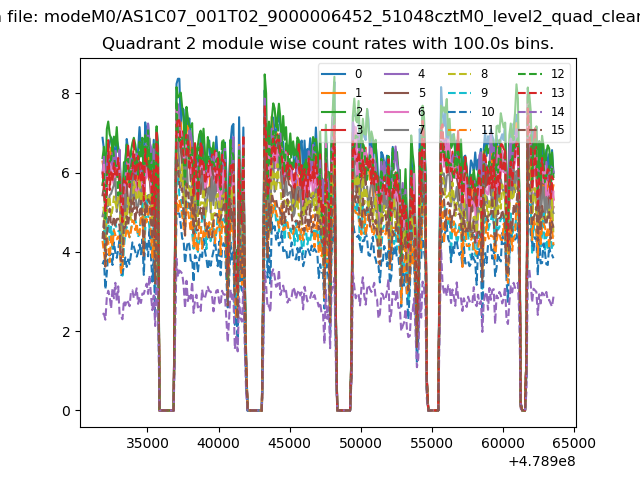
| Module-wise count rates for Quadrant B Data is divided into 100 sec bins |
 |
 |
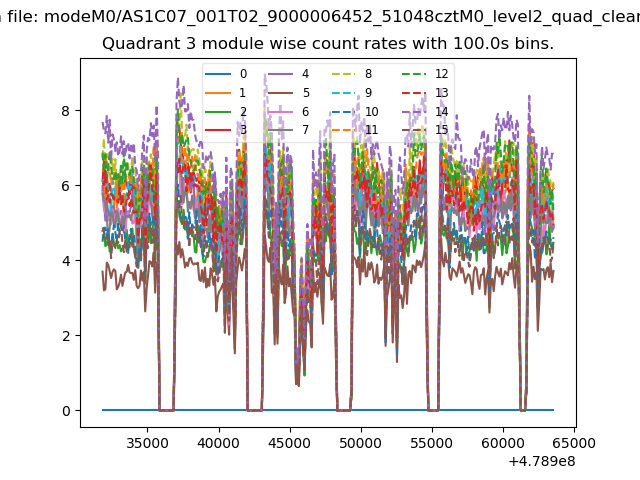
| Module-wise count rates for Quadrant C Data is divided into 100 sec bins |
 |
 |
| Module-wise count rates for Quadrant D Data is divided into 100 sec bins |
 |
 |
| Parameter | Plot |
|---|---|
| CZT HV Monitor | 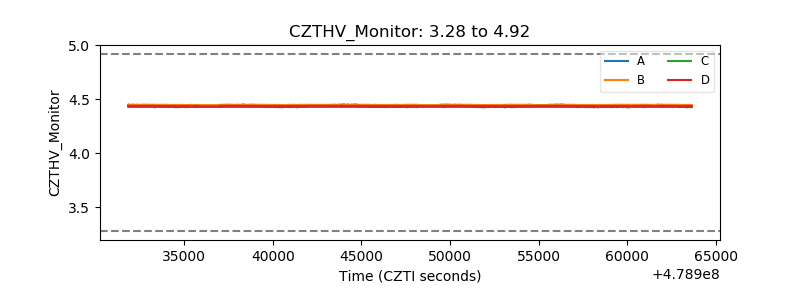 |
| D_VDD | 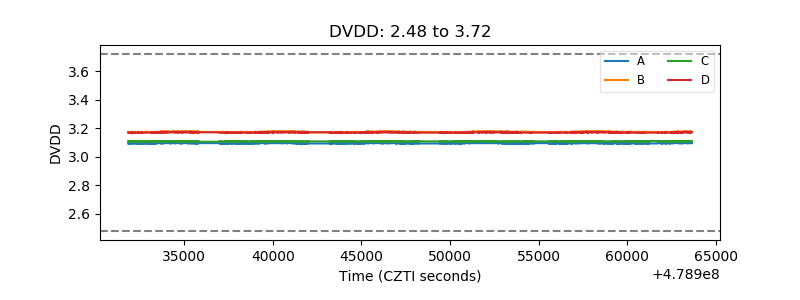 |
| Temperature 1 | 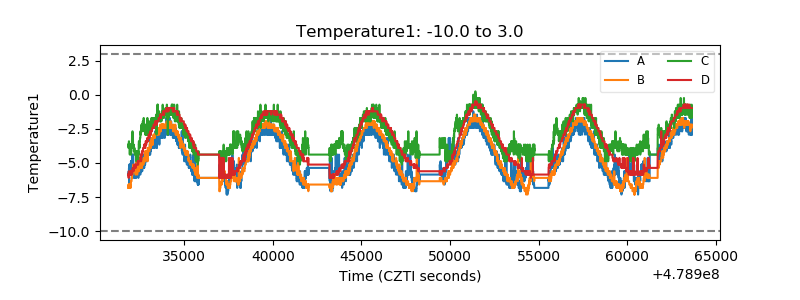 |
| Veto HV Monitor |  |
| Veto LLD | 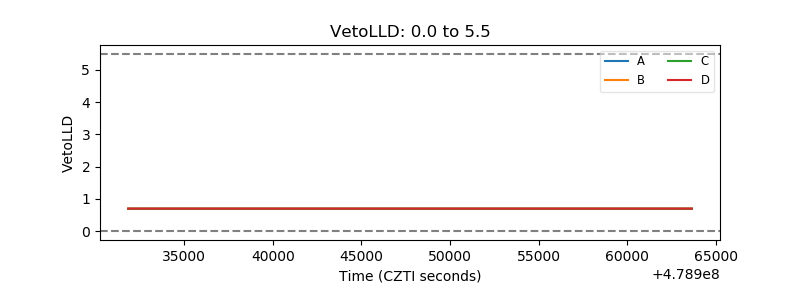 |
| Alpha Counter | 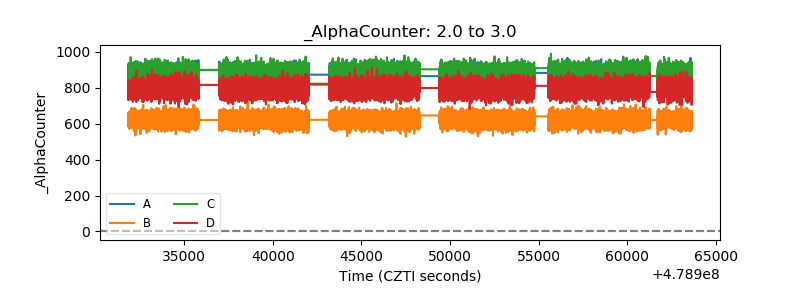 |
| _CPM_Rate | 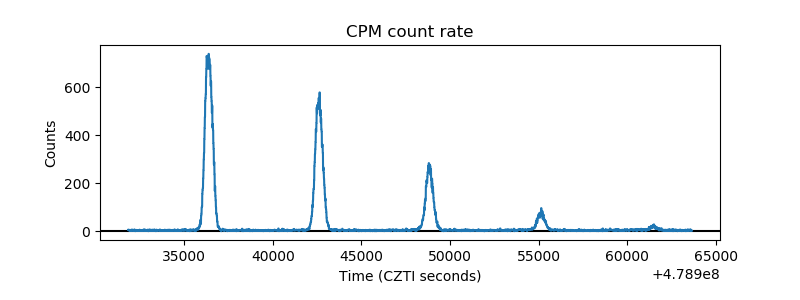 |
| CZT Counter | 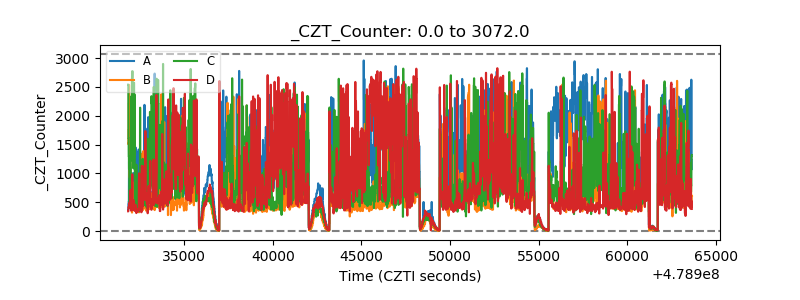 |
| +2.5 Volts monitor | 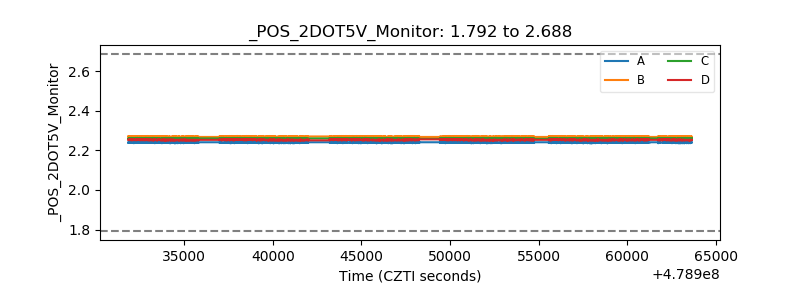 |
| +5 Volts monitor | 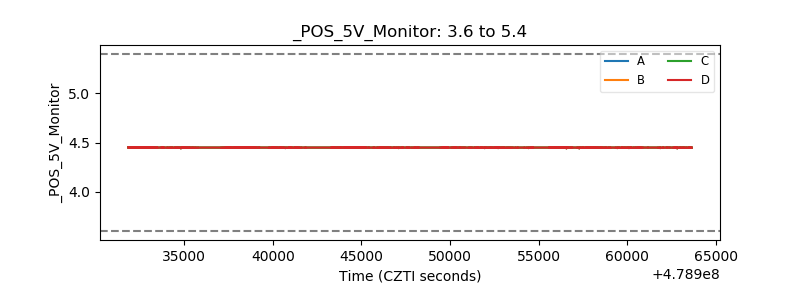 |
| _ROLL_ROT | 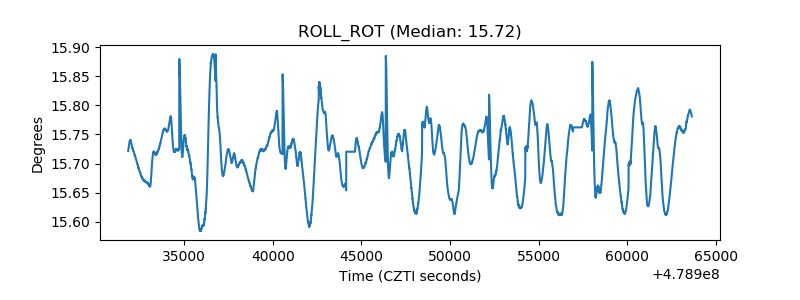 |
| _Roll_DEC | 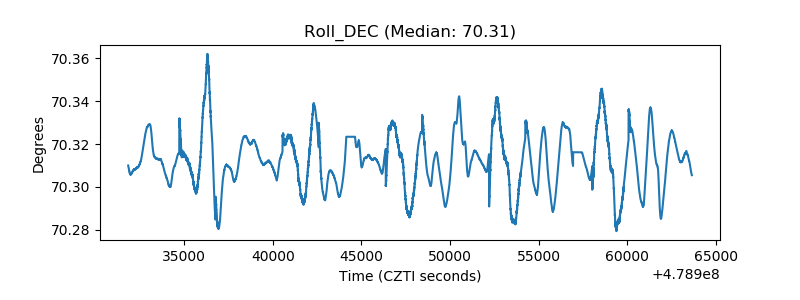 |
| _Roll_RA | 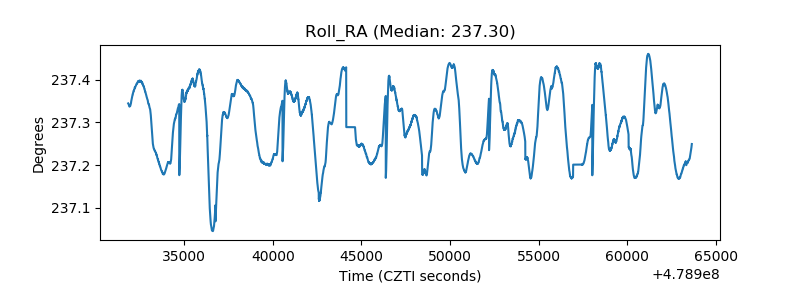 |
| Veto Counter | 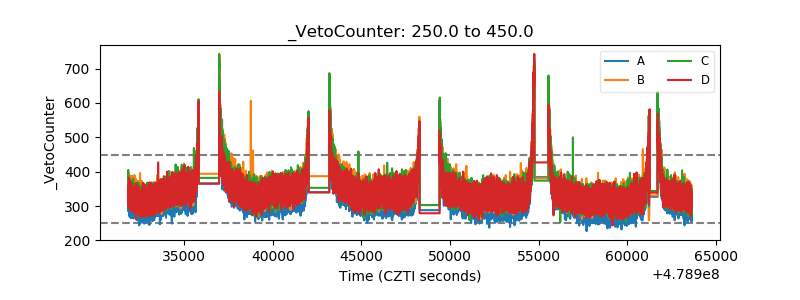 |