| Param | Original file | Final file |
|---|---|---|
| Filename | modeM0/AS1C07_001T02_9000006452_51049cztM0_level2.fits | modeM0/AS1C07_001T02_9000006452_51049cztM0_level2_quad_clean.evt |
| Size (bytes) | 785,214,720 | 97,724,160 |
| Size | 748.8 MB | 93.2 MB |
| Events in quadrant A | 7,848,678 | 638,339 |
| Events in quadrant B | 8,655,441 | 613,237 |
| Events in quadrant C | 6,723,864 | 612,083 |
| Events in quadrant D | 5,272,923 | 585,562 |
| Mode SS | |||
|---|---|---|---|
| Quadrant | BADHDUFLAG | Total packets | Discarded packets |
| A | 0 | 146 | 0 |
| B | 0 | 146 | 0 |
| C | 0 | 146 | 0 |
| D | 0 | 146 | 0 |
| Mode M0 | |||
|---|---|---|---|
| Quadrant | BADHDUFLAG | Total packets | Discarded packets |
| A | 0 | 28410 | 0 |
| B | 0 | 30808 | 0 |
| C | 0 | 25048 | 0 |
| D | 0 | 20693 | 0 |
| Quadrant | Total seconds | Saturated seconds | Saturation percentage |
|---|---|---|---|
| A | 7316 | 734 | 10.032805% |
| B | 7317 | 1597 | 21.825885% |
| C | 7317 | 659 | 9.006423% |
| D | 7317 | 393 | 5.371054% |
Noise dominated data is calculated using 1-second bins in cleaned event files. If a bin has >2000 counts, and if more than 50% of those come from <1% of pixels, then it is considered to be noise-dominated and hence unusable.
| Quadrant | # 1 sec bins | Bins with >0 counts | Bins with >2000 counts | High rate bins dominated by noise | Noise dominated (total time) | Noise dominated (detector-on time) | Marked lightcurve |
|---|---|---|---|---|---|---|---|
| A | 7316 | 7316 | 583 | 583 | 7.97% | 7.97% | 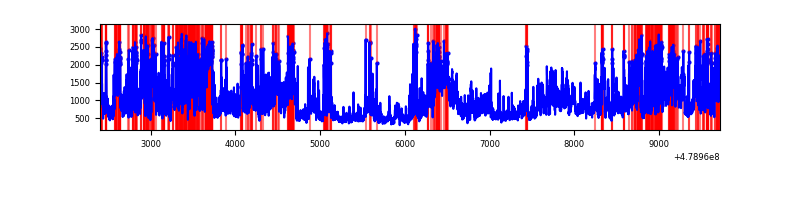 |
| B | 7317 | 7317 | 1150 | 1150 | 15.72% | 15.72% | 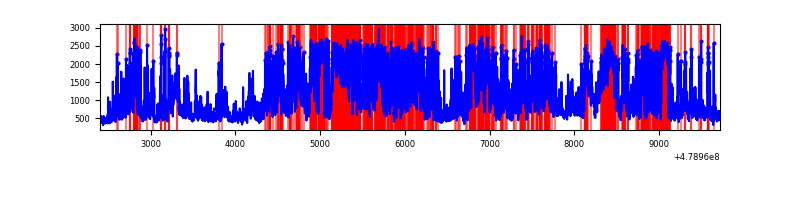 |
| C | 7317 | 7317 | 591 | 591 | 8.08% | 8.08% | 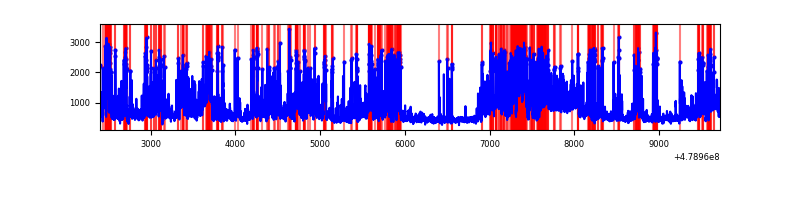 |
| D | 7316 | 7316 | 383 | 383 | 5.24% | 5.24% | 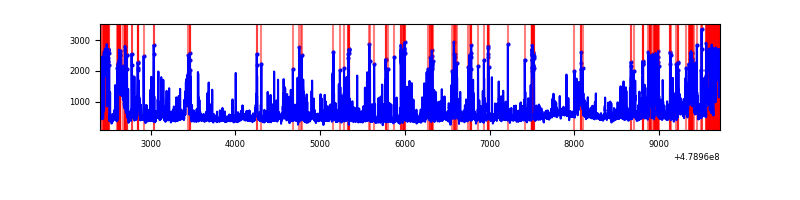 |
Top three noisy pixels from each quadrant. If the there are fewer than three noisy pixels in the level2.evt file, extra rows are filled as -1
| Pixel properties | Quadrant properties | ||||||
|---|---|---|---|---|---|---|---|
| Quadrant | DetID | PixID | Counts | Sigma | Mean | Median | Sigma |
| A | 10 | 253 | 2103604 | 11332.91 | 748 | 731 | 185.6 |
| A | 12 | 3 | 1025998 | 5525.42 | 748 | 731 | 185.6 |
| A | 12 | 80 | 463265 | 2492.71 | 748 | 731 | 185.6 |
| B | 10 | 44 | 1737420 | 11615.76 | 704 | 679 | 149.5 |
| B | 12 | 32 | 1596003 | 10669.92 | 704 | 679 | 149.5 |
| B | 4 | 171 | 883434 | 5904.09 | 704 | 679 | 149.5 |
| C | 12 | 249 | 2519752 | 12685.83 | 723 | 717 | 198.6 |
| C | 4 | 12 | 353838 | 1778.31 | 723 | 717 | 198.6 |
| C | 15 | 158 | 220976 | 1109.22 | 723 | 717 | 198.6 |
| D | 10 | 172 | 471747 | 2318.63 | 723 | 698 | 203.2 |
| D | 8 | 176 | 460564 | 2263.58 | 723 | 698 | 203.2 |
| D | 3 | 12 | 233249 | 1144.68 | 723 | 698 | 203.2 |
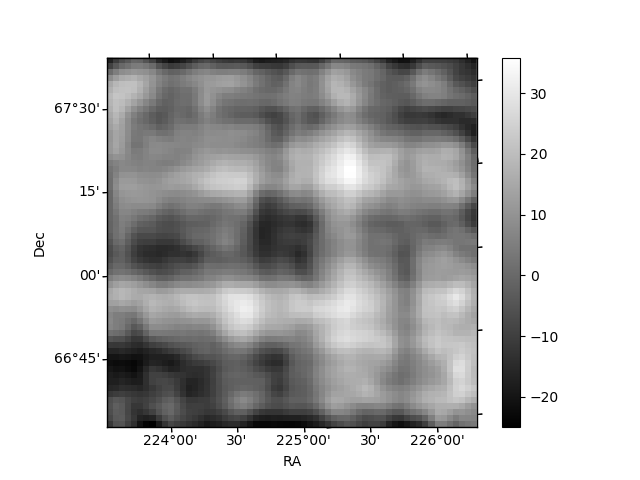
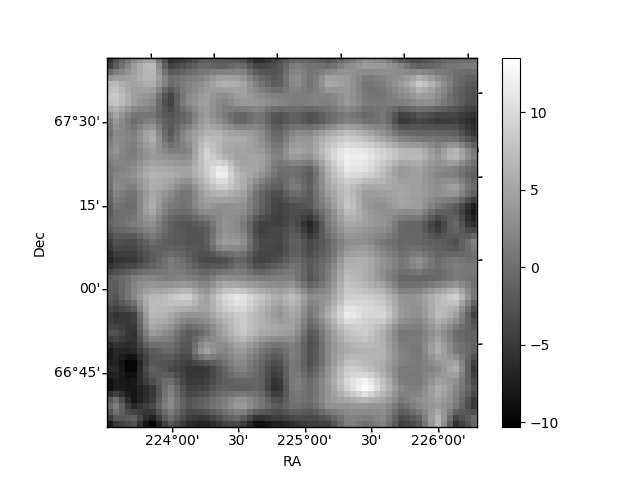
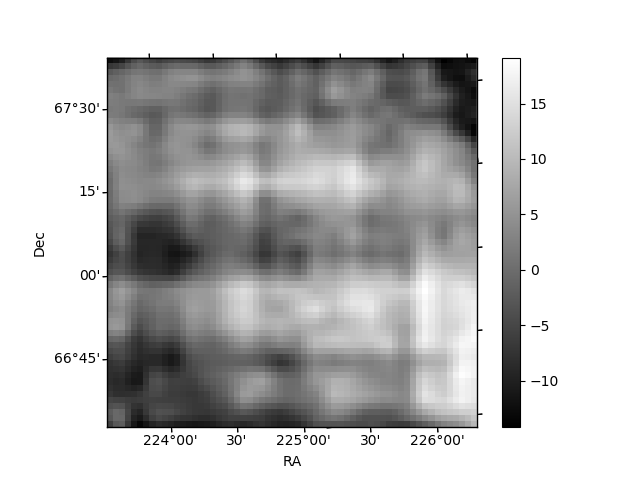
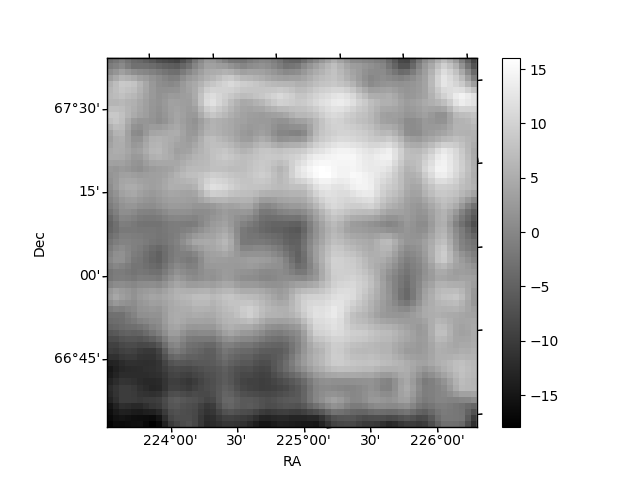
Histogram calculated using DETX and DETY for each event in the final _common_clean file
| Quadrant A | 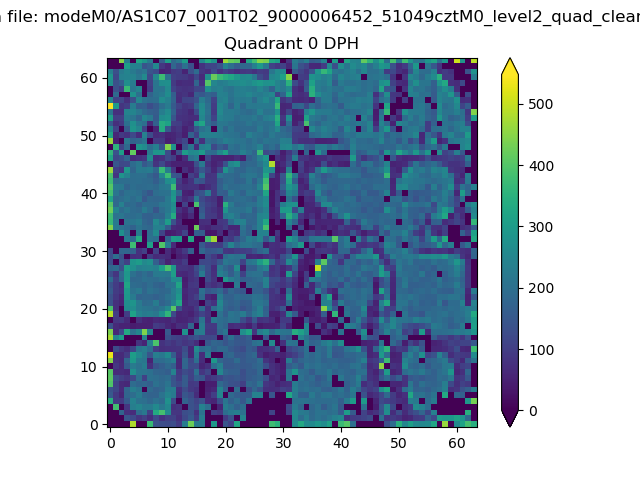 |
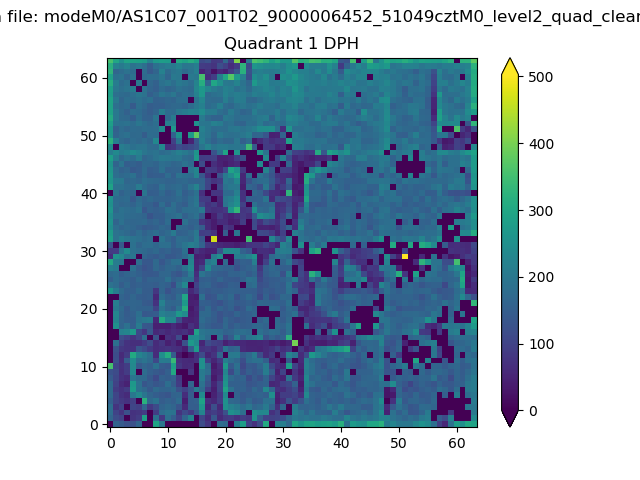 |
Quadrant B |
|---|---|---|---|
| Quadrant D | 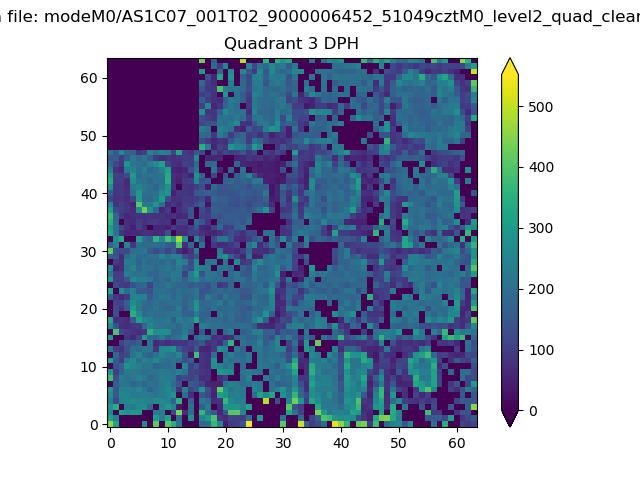 |
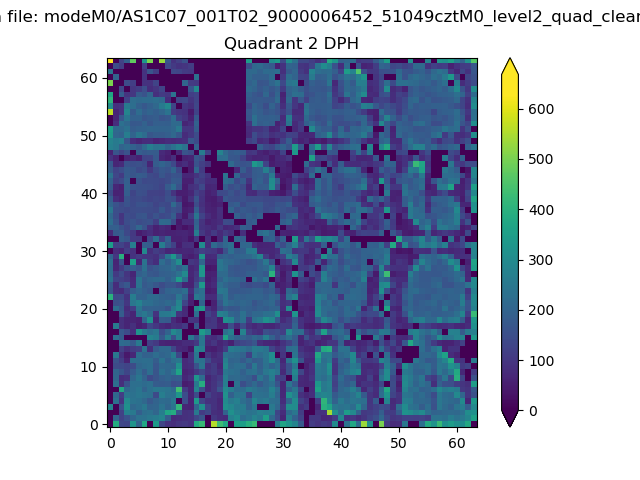 |
Quadrant C |
| Plot type | Count rate plots | Images |
|---|---|---|
| Comparison with Poisson distribution Blue bars denote a histogram of data divided into 1 sec bins. Red curve is a Poisson curve with rate = median count rate of data. |
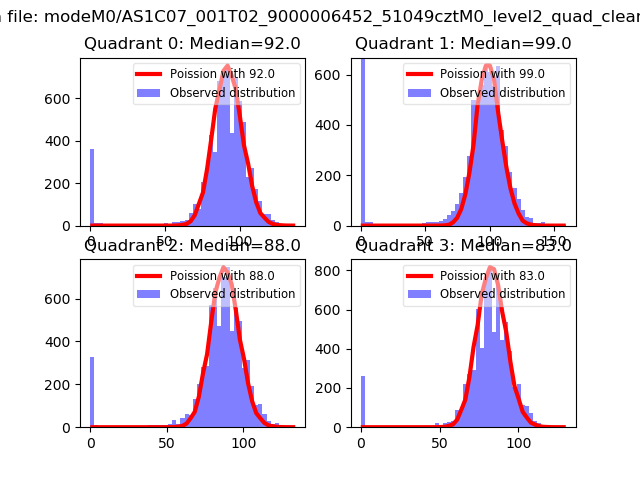 |
 |
| Quadrant-wise count rates Data is divided into 100 sec bins |
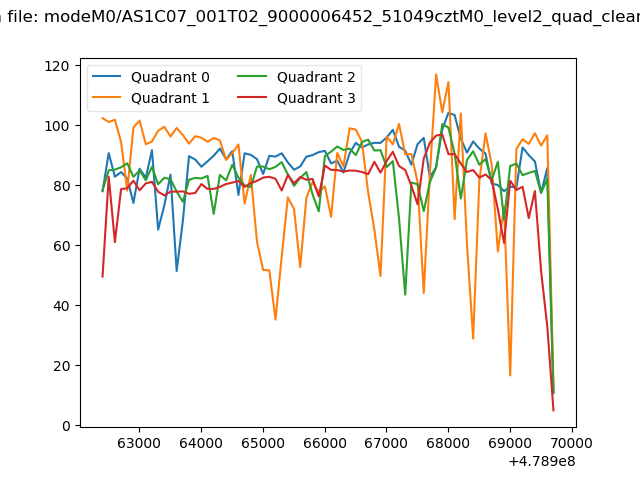 |
|
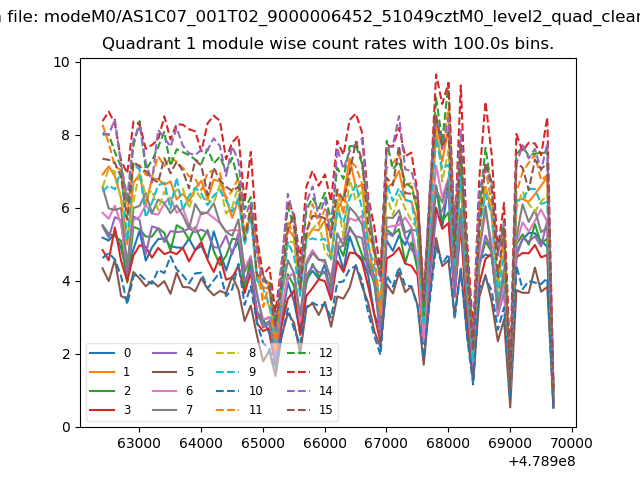
| Module-wise count rates for Quadrant A Data is divided into 100 sec bins |
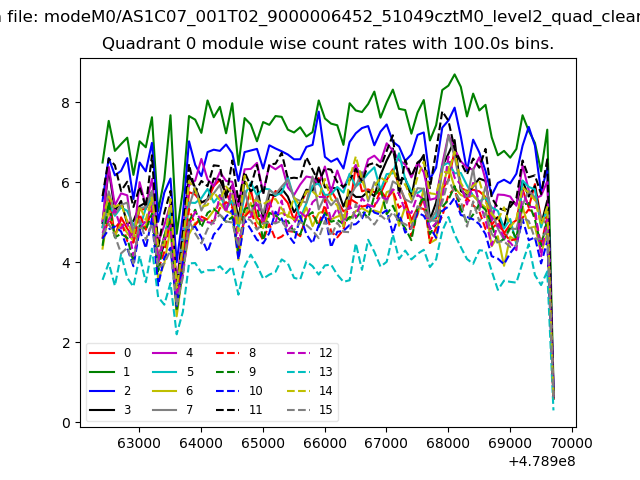 |
 |
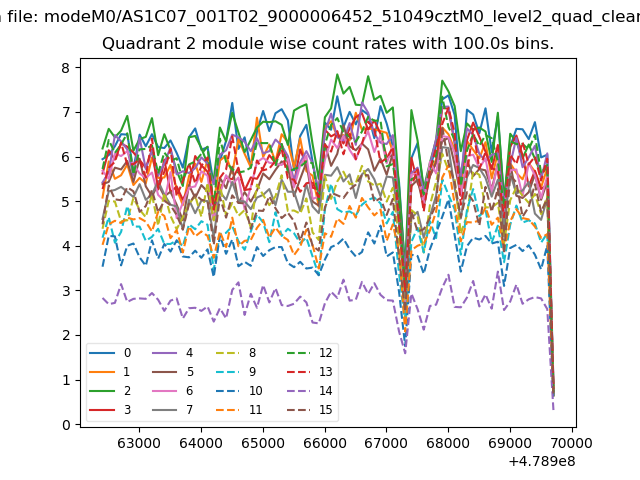
| Module-wise count rates for Quadrant B Data is divided into 100 sec bins |
 |
 |
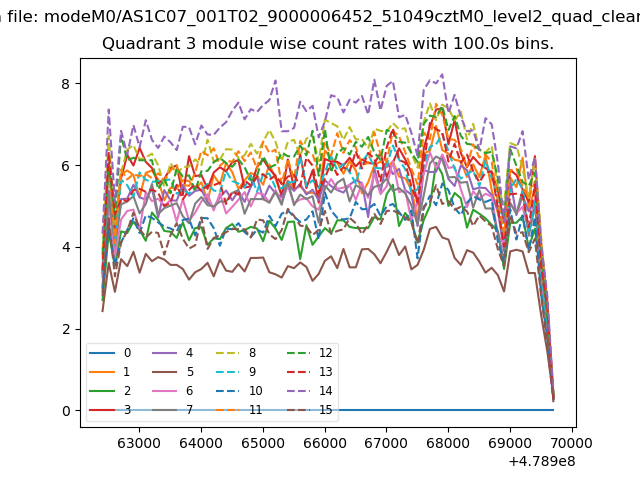
| Module-wise count rates for Quadrant C Data is divided into 100 sec bins |
 |
 |
| Module-wise count rates for Quadrant D Data is divided into 100 sec bins |
 |
 |
| Parameter | Plot |
|---|---|
| CZT HV Monitor |  |
| D_VDD | 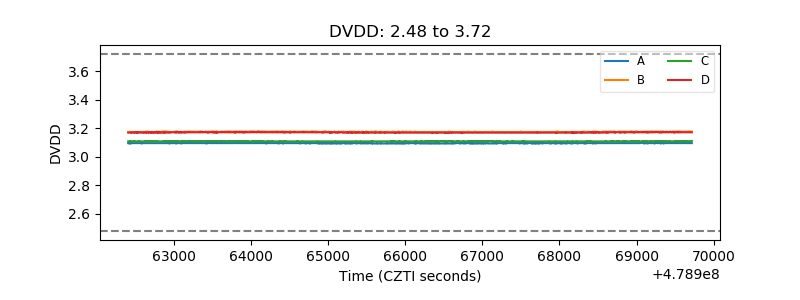 |
| Temperature 1 | 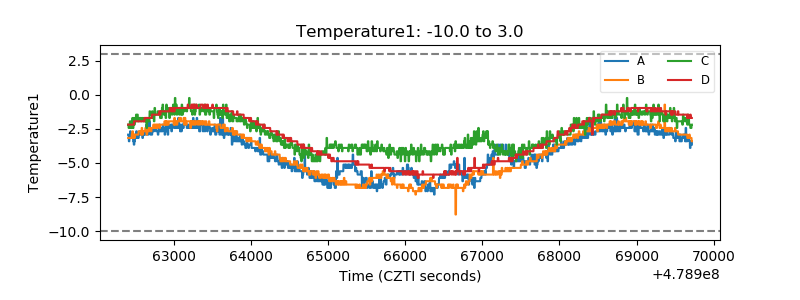 |
| Veto HV Monitor | 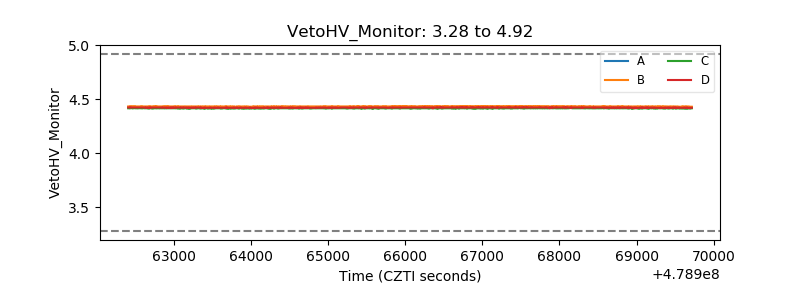 |
| Veto LLD | 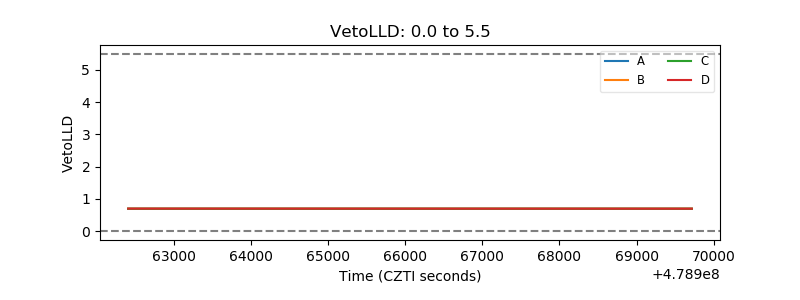 |
| Alpha Counter | 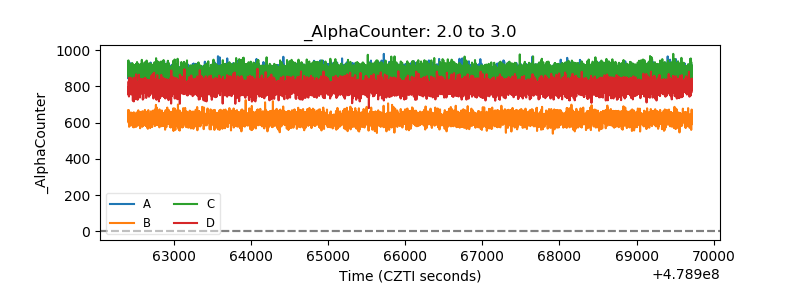 |
| _CPM_Rate | 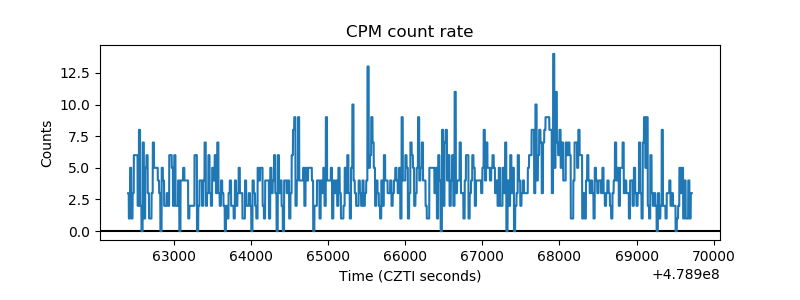 |
| CZT Counter | 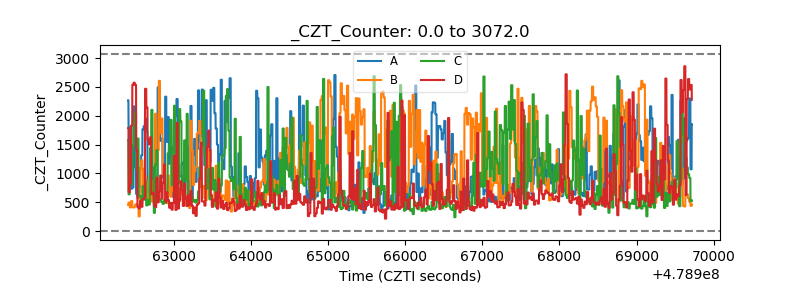 |
| +2.5 Volts monitor | 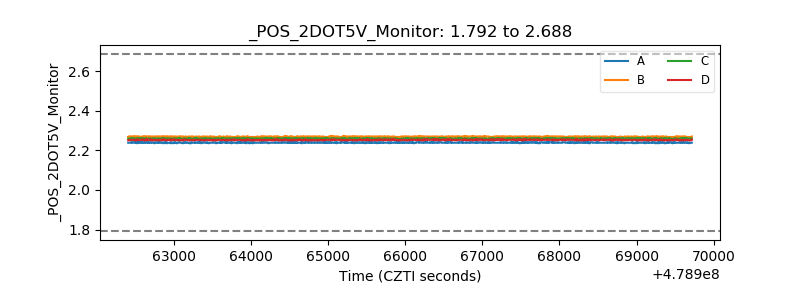 |
| +5 Volts monitor | 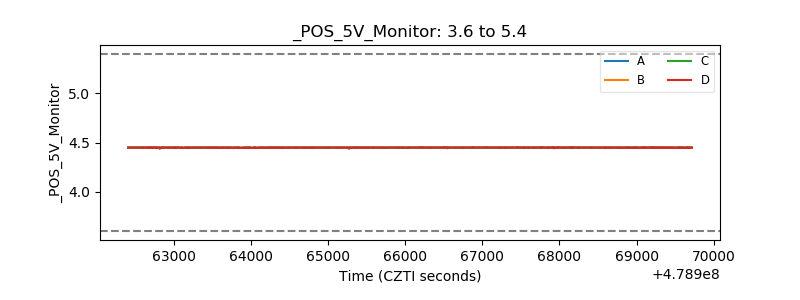 |
| _ROLL_ROT | 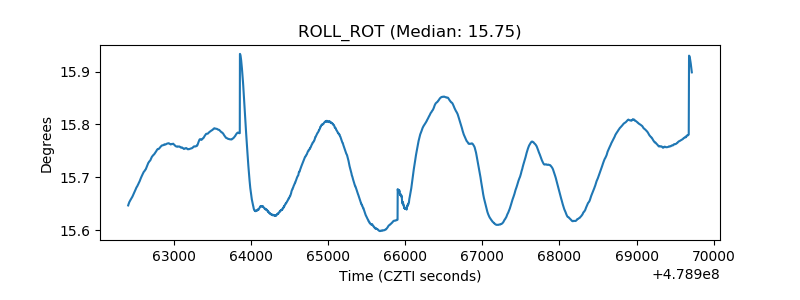 |
| _Roll_DEC | 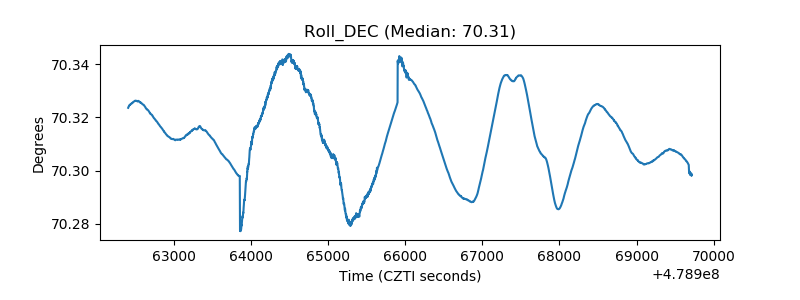 |
| _Roll_RA | 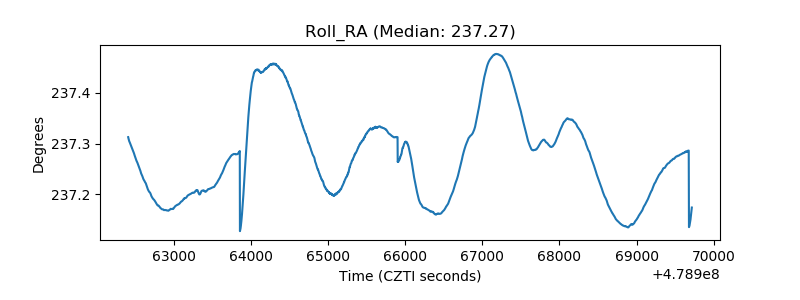 |
| Veto Counter | 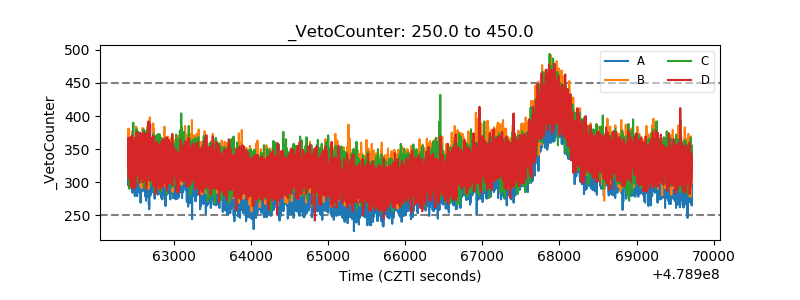 |