| Param | Original file | Final file |
|---|---|---|
| Filename | modeM0/AS1C07_001T02_9000006452_51054cztM0_level2.fits | modeM0/AS1C07_001T02_9000006452_51054cztM0_level2_quad_clean.evt |
| Size (bytes) | 1,132,090,560 | 109,031,040 |
| Size | 1.1 GB | 104.0 MB |
| Events in quadrant A | 10,485,341 | 709,826 |
| Events in quadrant B | 5,420,693 | 882,851 |
| Events in quadrant C | 9,033,506 | 761,503 |
| Events in quadrant D | 16,281,616 | 330,324 |
| Mode SS | |||
|---|---|---|---|
| Quadrant | BADHDUFLAG | Total packets | Discarded packets |
| A | 0 | 180 | 0 |
| B | 0 | 180 | 0 |
| C | 0 | 180 | 0 |
| D | 0 | 180 | 0 |
| Mode M9 | |||
|---|---|---|---|
| Quadrant | BADHDUFLAG | Total packets | Discarded packets |
| A | 0 | 14 | 0 |
| B | 0 | 14 | 0 |
| C | 0 | 14 | 0 |
| D | 0 | 14 | 0 |
| Mode M0 | |||
|---|---|---|---|
| Quadrant | BADHDUFLAG | Total packets | Discarded packets |
| A | 0 | 37451 | 2 |
| B | 0 | 22447 | 3 |
| C | 0 | 33002 | 2 |
| D | 0 | 54559 | 2 |
| Quadrant | Total seconds | Saturated seconds | Saturation percentage |
|---|---|---|---|
| A | 8884 | 1322 | 14.880684% |
| B | 8884 | 189 | 2.127420% |
| C | 8884 | 627 | 7.057632% |
| D | 8884 | 5221 | 58.768573% |
Noise dominated data is calculated using 1-second bins in cleaned event files. If a bin has >2000 counts, and if more than 50% of those come from <1% of pixels, then it is considered to be noise-dominated and hence unusable.
| Quadrant | # 1 sec bins | Bins with >0 counts | Bins with >2000 counts | High rate bins dominated by noise | Noise dominated (total time) | Noise dominated (detector-on time) | Marked lightcurve |
|---|---|---|---|---|---|---|---|
| A | 10253 | 8884 | 1258 | 1258 | 12.27% | 14.16% | 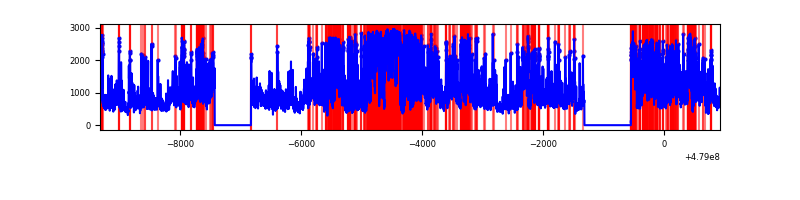 |
| B | 10253 | 8884 | 90 | 90 | 0.88% | 1.01% | 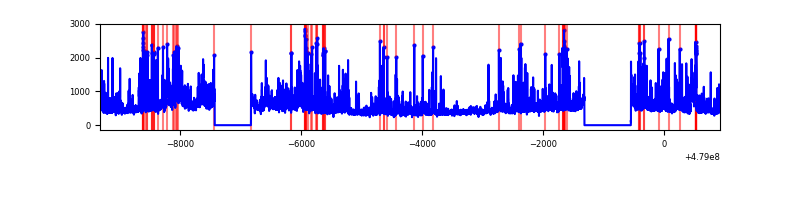 |
| C | 10253 | 8884 | 529 | 529 | 5.16% | 5.95% | 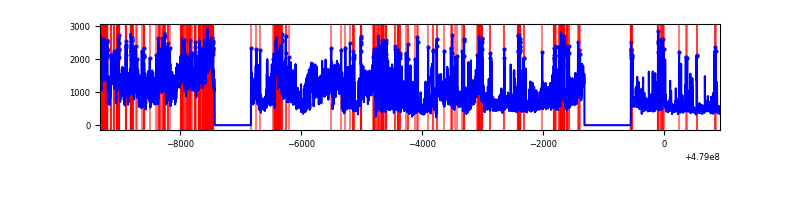 |
| D | 10253 | 8884 | 4628 | 4628 | 45.14% | 52.09% | 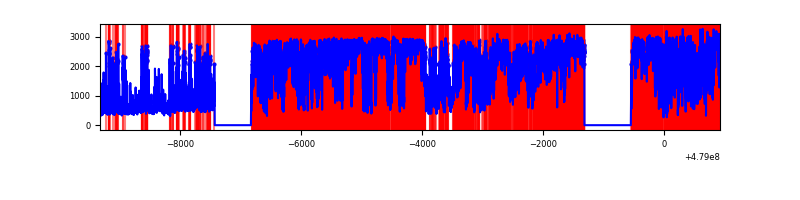 |
Top three noisy pixels from each quadrant. If the there are fewer than three noisy pixels in the level2.evt file, extra rows are filled as -1
| Pixel properties | Quadrant properties | ||||||
|---|---|---|---|---|---|---|---|
| Quadrant | DetID | PixID | Counts | Sigma | Mean | Median | Sigma |
| A | 3 | 62 | 1875236 | 8519.0 | 894 | 871 | 220.0 |
| A | 10 | 253 | 1691760 | 7685.1 | 894 | 871 | 220.0 |
| A | 12 | 3 | 1182975 | 5372.67 | 894 | 871 | 220.0 |
| B | 4 | 81 | 264734 | 1312.06 | 932 | 901 | 201.1 |
| B | 5 | 185 | 258627 | 1281.69 | 932 | 901 | 201.1 |
| B | 4 | 171 | 196163 | 971.05 | 932 | 901 | 201.1 |
| C | 12 | 247 | 3619287 | 14602.8 | 898 | 890 | 247.8 |
| C | 12 | 249 | 262098 | 1054.16 | 898 | 890 | 247.8 |
| C | 1 | 44 | 250872 | 1008.85 | 898 | 890 | 247.8 |
| D | 8 | 176 | 12581647 | 82419.8 | 528 | 508 | 152.6 |
| D | 3 | 12 | 683588 | 4474.9 | 528 | 508 | 152.6 |
| D | 10 | 172 | 141097 | 921.01 | 528 | 508 | 152.6 |
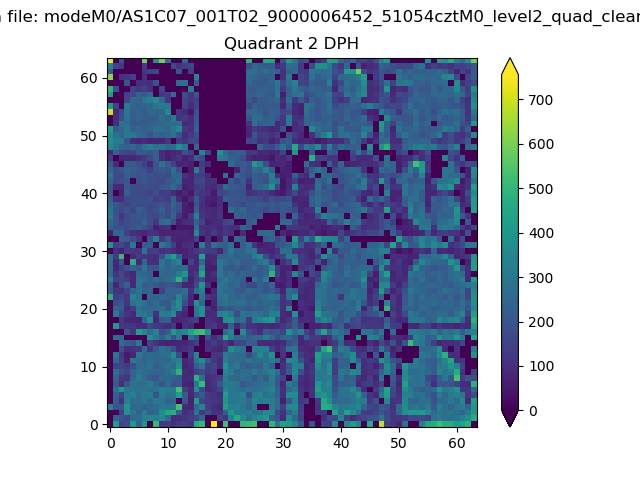
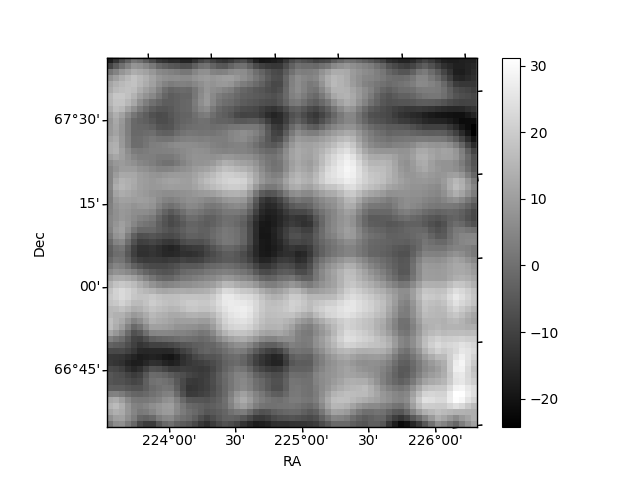
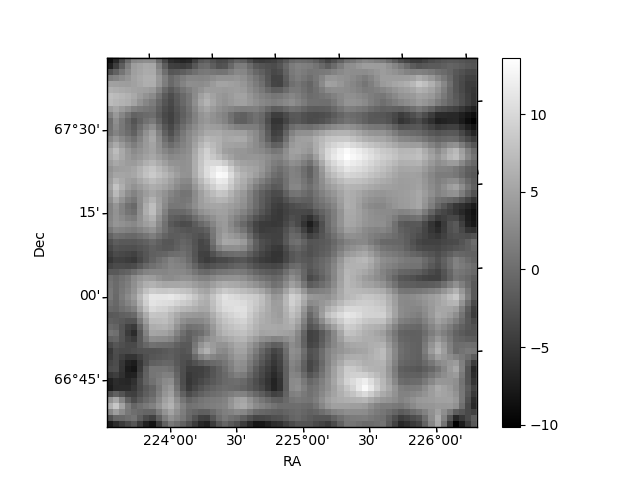
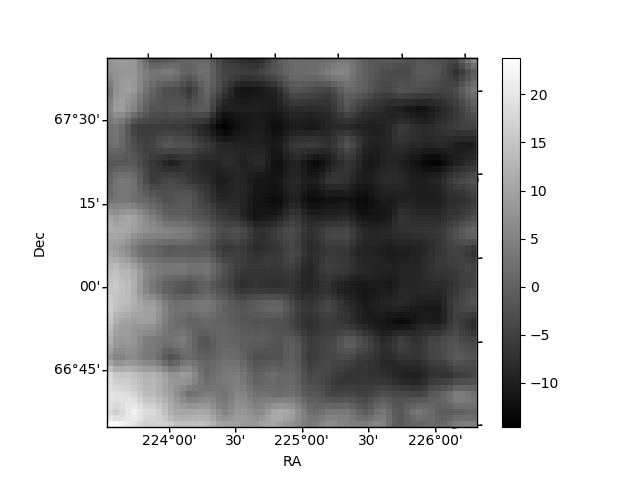
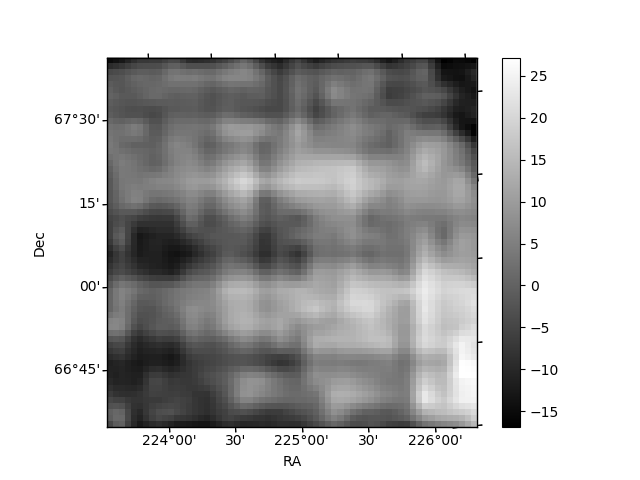
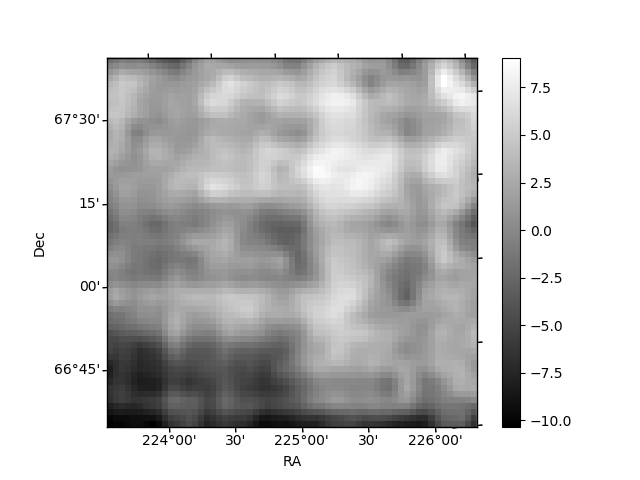
Histogram calculated using DETX and DETY for each event in the final _common_clean file
| Quadrant A | 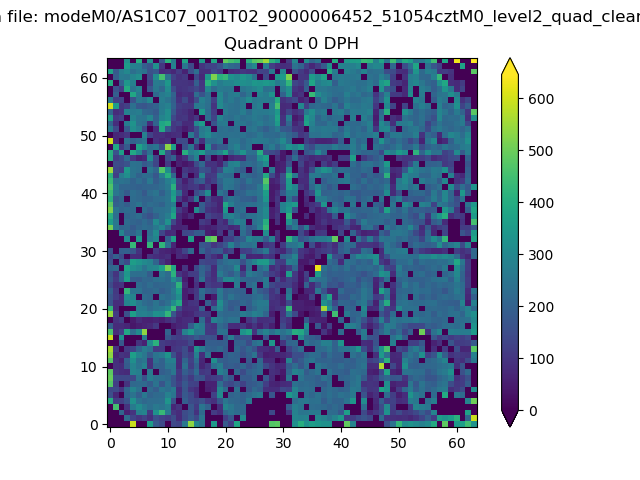 |
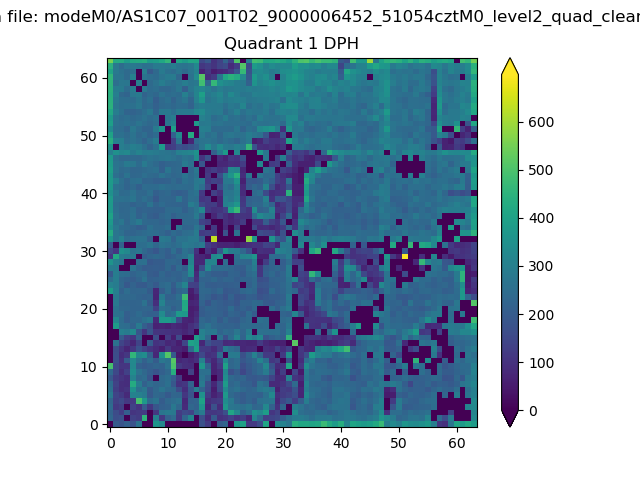 |
Quadrant B |
|---|---|---|---|
| Quadrant D | 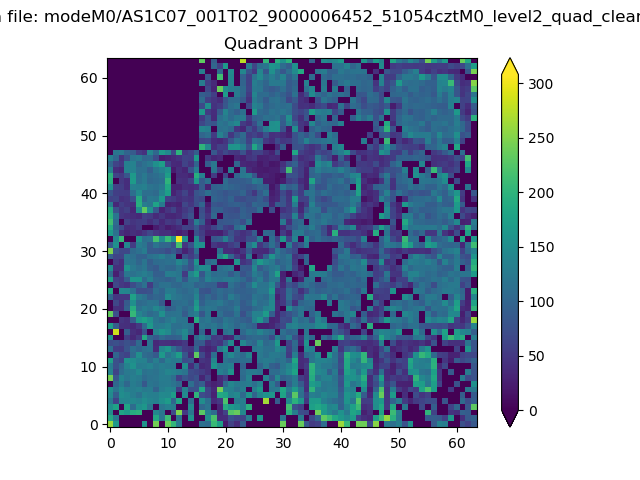 |
 |
Quadrant C |
| Plot type | Count rate plots | Images |
|---|---|---|
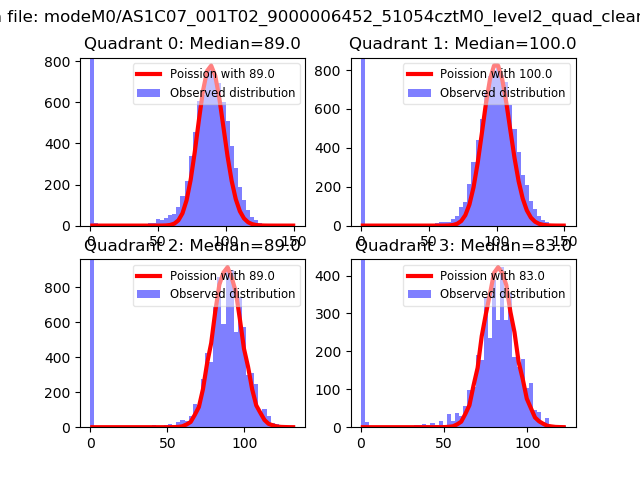
| Comparison with Poisson distribution Blue bars denote a histogram of data divided into 1 sec bins. Red curve is a Poisson curve with rate = median count rate of data. |
 |
 |
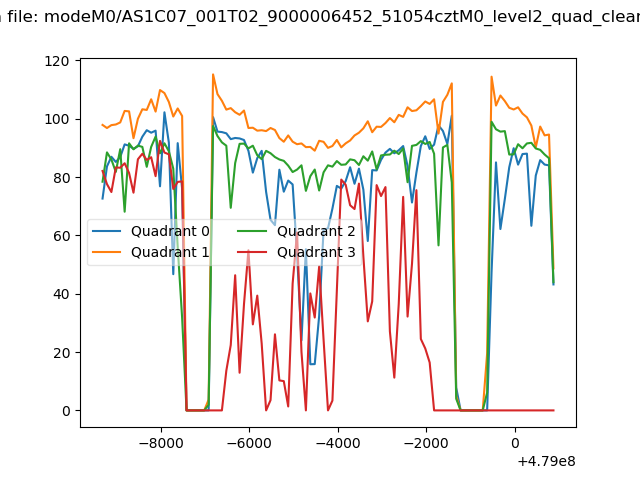
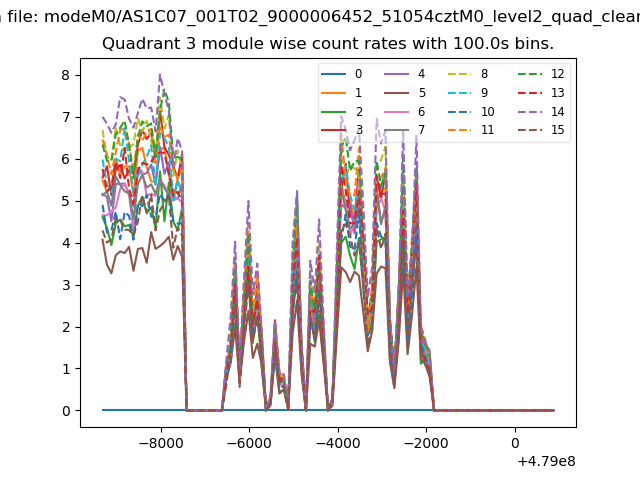
| Quadrant-wise count rates Data is divided into 100 sec bins |
 |
|
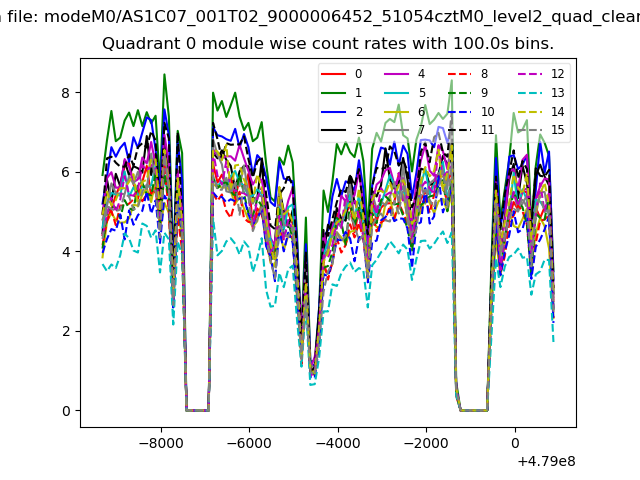
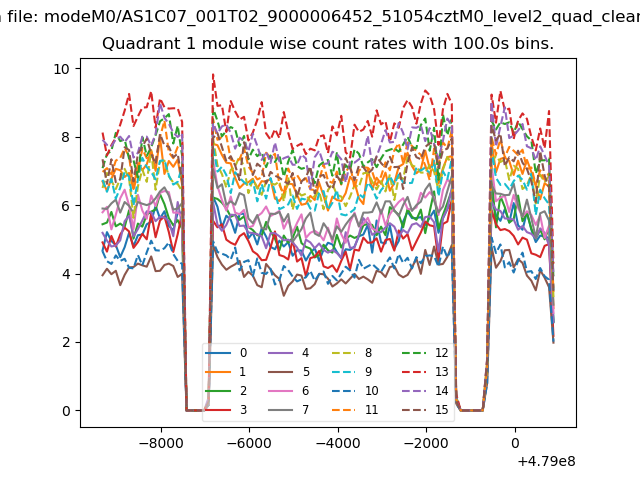
| Module-wise count rates for Quadrant A Data is divided into 100 sec bins |
 |
 |
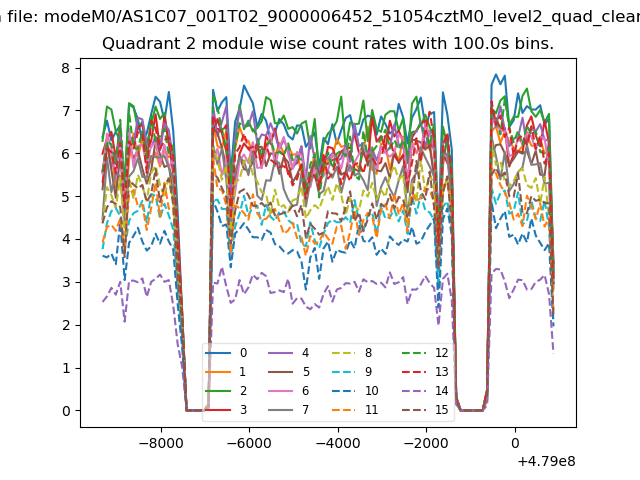
| Module-wise count rates for Quadrant B Data is divided into 100 sec bins |
 |
 |
| Module-wise count rates for Quadrant C Data is divided into 100 sec bins |
 |
 |
| Module-wise count rates for Quadrant D Data is divided into 100 sec bins |
 |
 |
| Parameter | Plot |
|---|---|
| CZT HV Monitor | 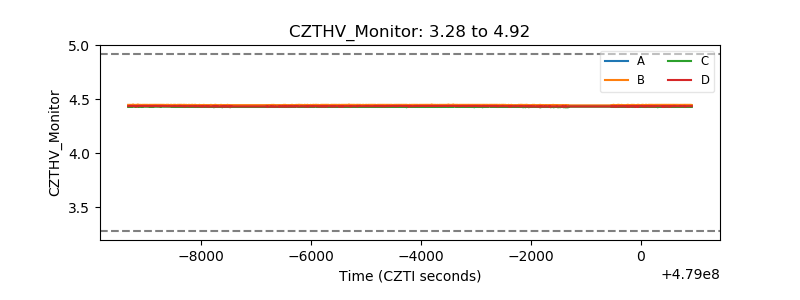 |
| D_VDD | 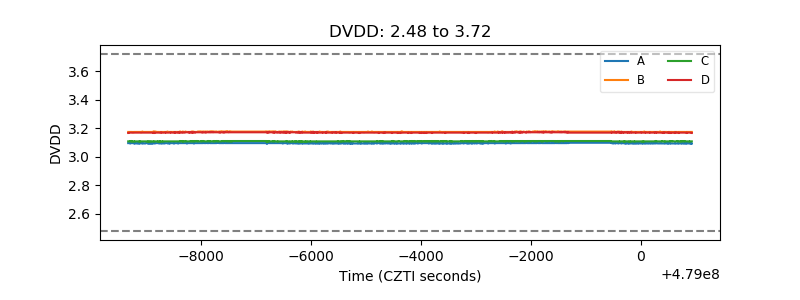 |
| Temperature 1 | 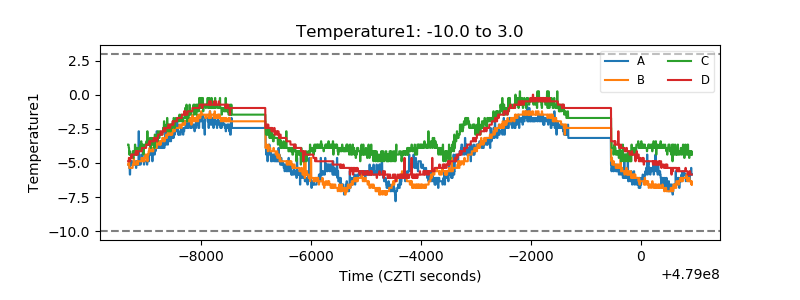 |
| Veto HV Monitor | 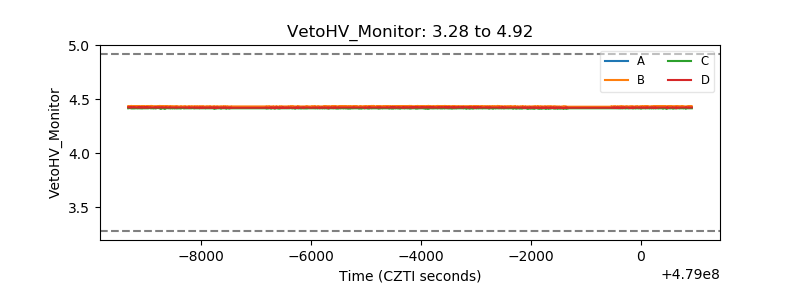 |
| Veto LLD | 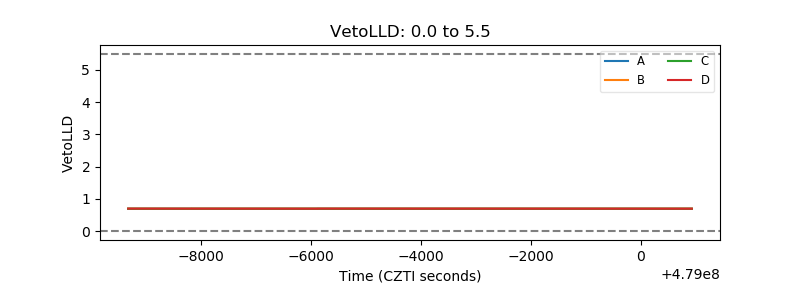 |
| Alpha Counter | 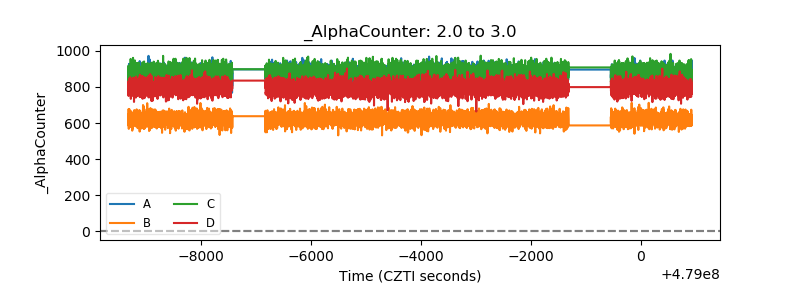 |
| _CPM_Rate | 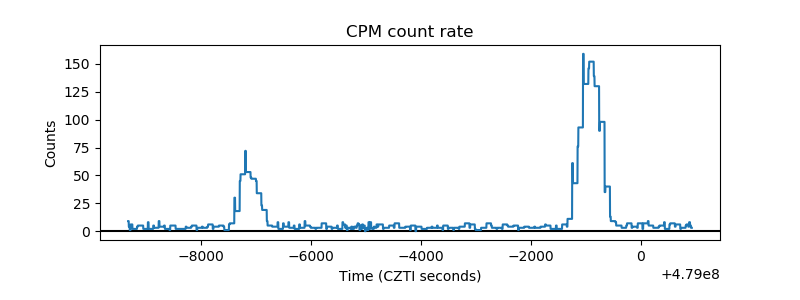 |
| CZT Counter | 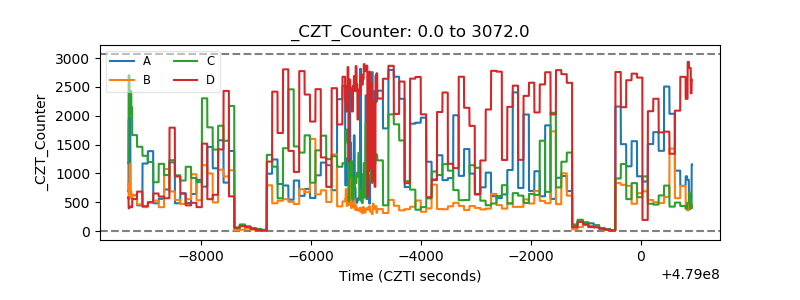 |
| +2.5 Volts monitor | 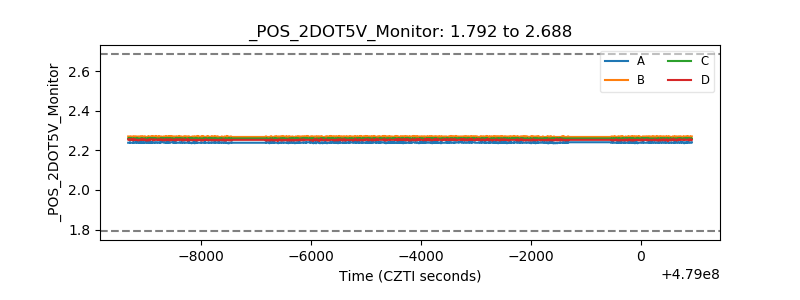 |
| +5 Volts monitor | 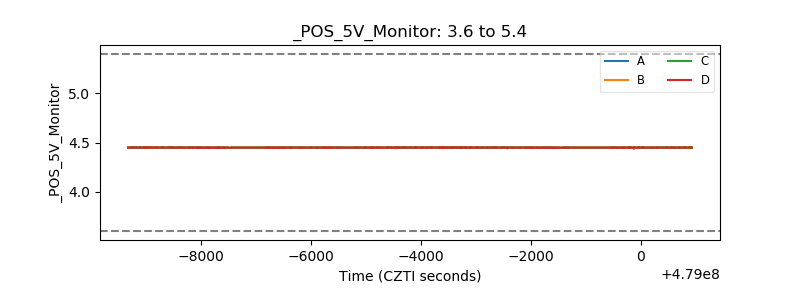 |
| _ROLL_ROT | 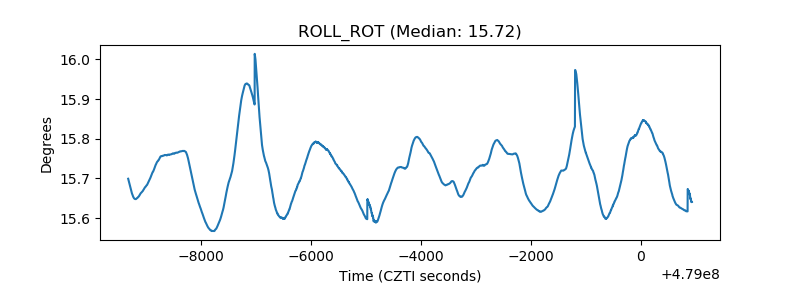 |
| _Roll_DEC | 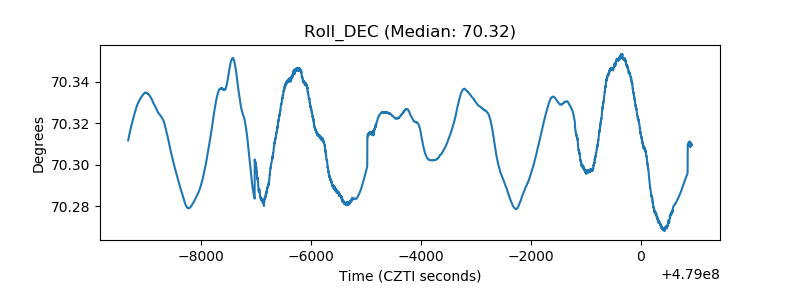 |
| _Roll_RA | 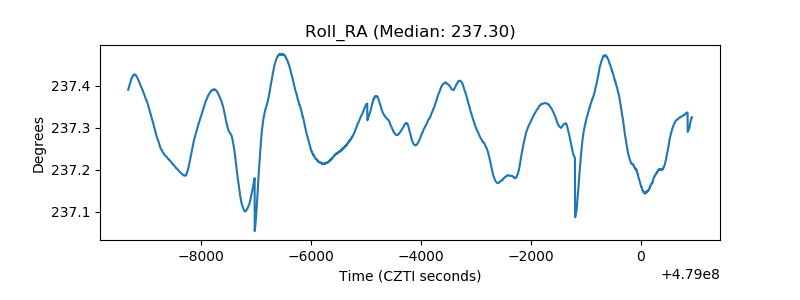 |
| Veto Counter | 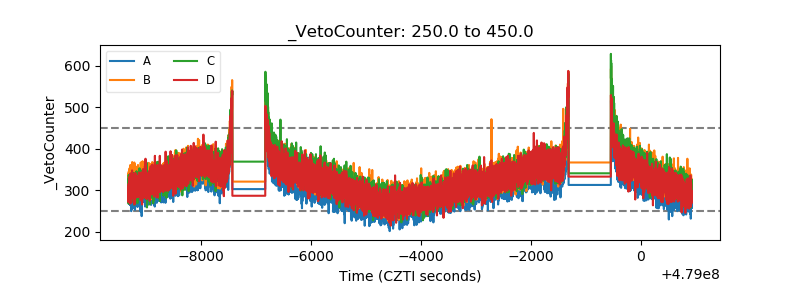 |